Servicios Personalizados
Revista
Articulo
Indicadores
-
 Citado por SciELO
Links relacionados
-
 Similares en
SciELO
Compartir
Epidemiologia e Serviços de Saúde
versión impresa ISSN 1679-4974versión On-line ISSN 2237-9622
Epidemiol. Serv. Saúde v.24 n.2 Brasília jun. 2015
http://dx.doi.org/10.5123/S1679-49742015000200003
NATIONAL HEALTH SURVEY METHODOLOGY ARTICLE
Sampling Design for the National Health Survey, Brazil 2013
Paulo Roberto Borges de Souza-JúniorI; Marcos Paulo Soares de FreitasII; Giuseppe de Abreu AntonaciIII; Célia Landmann SzwarcwaldI
IFundação Instituto Oswaldo Cruz, Instituto de Comunicação e Informação Científica
e Tecnológica em Saúde, Rio de Janeiro-RJ, Brasil
IIInstituto Brasileiro de Geografia e Estatística, Coordenação de métodos e Qualidade, Rio
de Janeiro-RJ, Brasil
IIIInstituto Brasileiro de Geografia e Estatística, Diretoria de Pesquisas, Rio de Janeiro-RJ, Brasil
ABSTRACT
This paper describes the sample design used in the Brazilian 2013 National Health Survey. The target population is composed by people resident in permanent private households throughout the country; the survey was household-based with stratified sampling and three clustering stages; census tracts form the primary sampling units, households are the units of second stage and adults (aged 18 years or older) define the third-stage units; the sample size considered the desired level of precision for the estimates of some indicators at different levels of disaggregation and different population groups; the final weighting was a product of inverse selection probabilities at each stage of the sampling plan, including non-response correction procedures and adjustment calibrations for the known population totals. Since this is a complex sample, appropriate procedures must be used during data processing.
Keywords: Population Surveys; Cluster Sampling; Sample Size.
Introduction
The National Health Survey (PNS), conducted between 2013 and 2014, was developed in partnership between the Ministry of Health's Health Surveillance Secretariat (SVS/MS), the Oswaldo Cruz Foundation (Fiocruz) and the Brazilian Institute of Geography and Statistics (IBGE). PNS is a nationwide population-based survey, and its main objective is (i) to produce national-level data about the health status and lifestyles of the Brazilian population, (ii) and also data about health care, regarding access, use of health services, preventive actions, continuity of care, and health care funding.1
PNS, as part of the IBGE Integrated Household Surveys System (SIPD), used the sample infrastructure built for this system.2 This sample planning stage of the research was also conducted by IBGE, in partnership with Fiocruz.
This article describes the sampling plan used in PNS, including the target population, the selection stages, the calculation of sample size and the definition of expansion factors.
Target Population
The target population was comprised of people living in permanent private households (PPH) located in the survey's geographical coverage area. The PPHs are those that were built to be used exclusively for housing and are intended to serve as a home to one or more people.3
The 'geographic coverage' area of the survey was defined as the entire national territory, divided into the census tracts of the 2010 Geographic Operating Base. Areas with special features and sparsely populated were excluded, these being classified by IBGE on the basis of tracts, such as indigenous villages, barracks, military bases, lodgings, camp sites, boats, penitentiaries, penal colonies, jails, nursing homes, orphanages, convents and hospitals. Census tracts located in indigenous lands were also excluded.
Questionnaire
The PNS questionnaire was stratified into three parts, as follows:
Part 1 - Household
Questions about household information and about visits to the household made by the Family Health team and endemic disease health workers.
This first part was answered by the head of the household or person who had this information at the time of the interview.
Part 2 - Household residents
Questions related to the general characteristics of all household residents, including education level, work, income, disabilities, health insurance coverage, use of health services, health of the elderly, mammography coverage and characteristics of children under 2 years old.
The second part was answered by all household members and in the case of a resident being absent or incapable of answering, the head of the household could answer the questionnaire (or part of it) on behalf of the absent or incapable resident, in the same way as is done in the Brazilian National Household Survey (PNAD). If this happened it was recorded on the questionnaire by making a note of which household resident replied, using an identification number.
Part 3 - Individual
Questions asked of a randomly selected resident, aged 18 years or older, regarding other work and social support characteristics, self-perception of health status, accidents and violence, lifestyles, chronic diseases, women's health, prenatal, dental and medical care.
In this part, an adult (≥18 years old) was randomly selected among eligible household residents. This part could only be answered by the selected resident and other household residents could not answer on their behalf.
Sampling Plan
The PNS sample was a subsample of the Master Sample of the Integrated Household Surveys System (SIPD). Before describing the PNS sampling plan, we will give a brief description of the Master Sample. For more information about the Master Sample or about SIPD, see Freitas et al 4 and Freitas and Antonaci.5
Master Sample
The Master Sample is a group of units of areas selected for use by various studies. These units are considered to be primary sampling units (PSUs) when planning the samples of each of the studies that use the Master Sample, including the National Health Survey (PNS). The PSUs are census tracts or groups of census tracts (when there are few households).
For the purposes of selecting the Master Sample, the PSUs were stratified according to four different criteria (Figure 1):
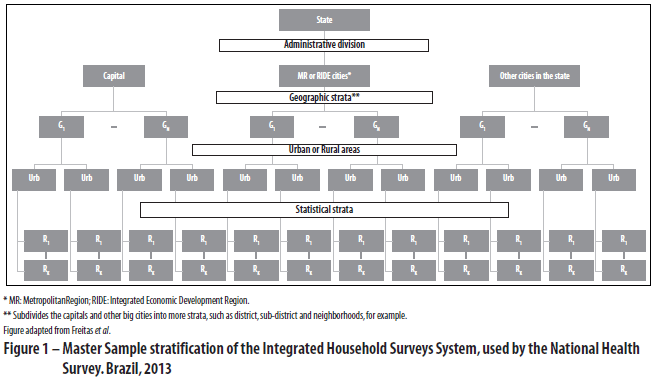
1. Administrative
This stratifies PSUs by state and, within each state, subdivides PSUs into the state capital city, its Metropolitan Region (MR) or Integrated Economic Development Region (RIDE) (in those states that have these administrative divisions), and the rest of municipalities in the state.
2. Geographic
This subdivides the state capital cities and other big cities into additional strata, such as district, sub-district and neighborhoods, for example.
3. Area situation
This subdivides the geographical strata into urban and rural areas.
4. Statistics
This subdivides the strata above (urban and rural) into homogeneous strata by total household income and total permanent private households (PPH), in order to improve the accuracy of the estimates.
The selection of PSUs within each stratum was carried out by probability proportional to size sampling (PPS), whereby the number of PPHs was used to measure the size of the PSU.
PNS sampling design
PNS is a household survey and the sample design applied was cluster sampling in three selection stages, with PSU stratification. As part of SIPD, in the first stage PSU selection was obtained by simple random sampling (SRS) among those previously selected for the Master Sample, maintaining the stratification of PSUs used in the Master Sample, as described above.
In the second stage, a fixed number of PPHs in each PSU selected in the first stage was selected by SRS. Household selection was done by using the updated National Address List for Statistical Purposes (CNEFE). It is important to highlight that, for the information contained in the first and second part of the survey, i.e., the parts concerning household characteristics and the set of all household residents, the PNS sampling plan had only these two selection stages.
In the third stage, within each household in the sample, a resident aged 18 or older was selected, also by SRS, to answer the individual survey (part 3). The selection was made from a list of eligible residents compiled during the interview.
Calculating the sample size
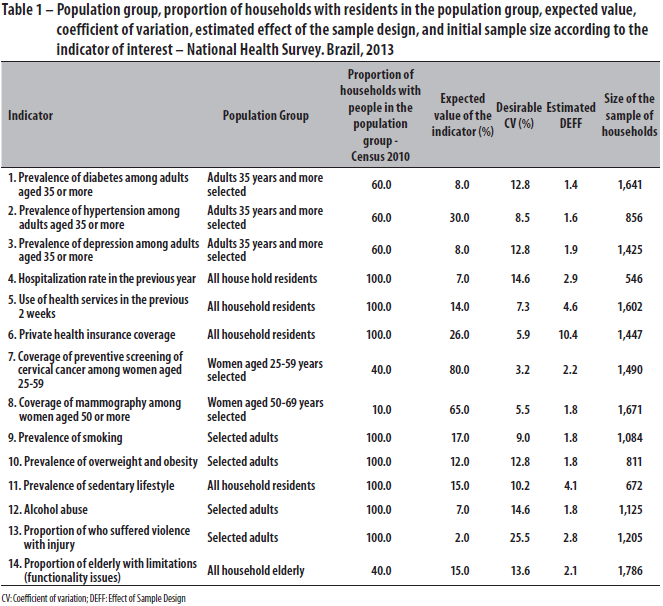
The sample size was defined based on the desirable level of accuracy, with 95% confidence intervals (95%CI) to estimate some indicators (or parameters) of interest at different levels of geographical breakdown and specific population groups. To make it possible to set the sample size in these specific population groups, it was necessary to evaluate the proportion of PPHs that had people in these groups, based on 2010 Census data. The desirable level of accuracy for each indicator was based on the extent of the 95% confidence interval expected. From there, we calculated the standard error and the coefficient of variation (CV) desirable for each indicator, and CV was used as a measure of precision in the calculation of sample size.
The initial sample size calculations are based on simple random sampling, it being necessary to consider the sample design effect (DEFF), which indicates how much the cluster sampling (CS), which is the case of PNS, is less effective than SRS. Because of this, the initial sample sizes were increased in order to achieve the same accuracy. The DEFFs used in PNS sample size calculations were estimated based on data from the 2008 Brazilian National Household Survey (PNAD, 2008).
The indicators used for determining the sample size, its respective population groups, the expected values, desirable coefficients of variation, the estimated DEFFs and sizes initially calculated for the household sample, are shown in Table 1.
The formulas used for sample size calculation in each domain are presented below:

Where,
nAAS is the sample size of people under simple random sampling;
N is the total number of people living in PPHs in the domain;
P is the proportion of interest;
Q = 1-P;
CV is the coefficient of variation of the estimated desirable ratio;
nAC is the sample size in cluster sampling;
EPA is the sample design effect (DEFF).
The data used in the calculations were obtained from the 2010 Census and PNAD 2008.
Initially, we calculated the minimum sample size required to estimate the indicators shown in Table 1, with the desirable coefficient of variation (CV) for each of the disseminating domains, that is, areas where the search is able to generate estimates with sufficient and representative accuracy of the population. The domains are: Brazil, country regions, states, metropolitan region (MR), state capital and the rest of the municipalities in each state. Table 1 shows also the minimum sample sizes initially computed for each indicator.
As the MR and the capitals are dissemination domains, the states that do not have MRs have two dissemination domains, namely the state capital and rest of the municipalities in the state. This means that the minimum sample size in these states required to estimate each indicator is about twice that of the size shown in Table 1. In the case of states that have MRs, the required size would be a little more than twice the size, since the MR is also a dissemination domain.
Based on the results found and what was presented above, some adjustments in the minimum sample sizes and in the geographic levels initially thought of as domains were necessary.
After several reviews, we decided to determine the minimum sample size of household per state as being 1800 and, as at least two dissemination domains are expected per state, we determined a minimum sample size of 900 households per domain.
The number of households selected in each PSU was set at 10, however in some domains there were insufficient PSUs in the Master Sample to complete the PNS sample. In these domains, it was necessary to select 14 households per PSU. That is, the number of households per PSU was of 10 or 14, depending on the dissemination domain. The sample sizes by state are shown in Table 2.
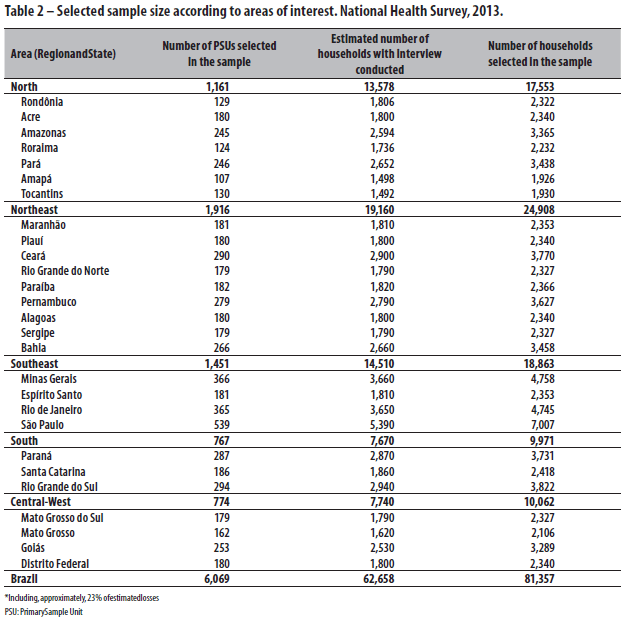
The number of households selected for the survey was approximately 23% higher than the minimum sample described above in order to take into account total loss, which includes non-response rate and the rate of misclas-sification of units in the records used for selection. This percentage was estimated based on other IBGE surveys, such as the Special Survey on Tobacco (PETaB), which was incorporated into PNAD 2008, although that survey only interviewed one person per household.
Sample Expansion
Because PNS has a complex sampling design and unequal selection probabilities, data analysis requires the definition of the expansion factors or sample weighting for households and all their residents, as well as for the resident selected to answer the third part of the questionnaire. The final weighing is a product of the inverse selection probabilities at each stage of the sampling plan, plus the non-response correction processes and calibration adjustments to the known population totals.
Weighting of primary sampling units (PSUs)
PSU weightings were calculated as the product between the inverse of the PSU selection probability for the Master Sample and the inverse of the PSU selection probability for PNS, as shown below:

where,
h is the index of the stratum;
i is the PSU index;
Whi is the basis weight of PSU i of stratum h in PNS;
mh is the number of PSUs selected in stratum h for Master Sample;
Nhi is the number of occupied permanent private households, occupied but without interviews having
been conduced (equivalent to closed households) and vacant in PSU i of stratum h [updated data from CNEFE (National Address List for Statistical
Purposes) at the time of selection of PSUs for the Master Sample];
Nh is the number of occupied permanent private households, occupied but without interviews having
been conducted (equivalent to closed households) and vacant in stratum h [updated data from CNEFE (National Address List for Statistical Purposes)
at the time of selection of PSUs for the Master Sample];
 is the number of PSUs selected in stratum h for use
by PNS.
Weighting households and all their residents
The weightings for households and all their residents were calculated by the product of the corresponding PSU weight and the inverse of the household selection probability within the PSU. Weightings were adjusted for non-response correction and to calibrate the estimates with population totals known through other sources. These weightings are used in the analysis of the answers to the first two parts of the questionnaire which provide information on the characteristics of the households and all their residents.
Households were selected with equal probability in each PSU, so the weighting of the household within the PSU is given by:

where,
h is the index of the stratum;
i is the PSU index;
j is the index of the household;
Wj|hi is the household selection weighting j in the PSU i of stratum h;
N*hi is the number of occupied and closed permanent private households in the PSU i of
stratum h [data from the last update of CNEFE at the time of households selection];
nhi is the number of selected households in PSU i of stratum h.
And the basic weighting of the household is obtained by the expression:

After determining the basic weighting, an adjustment was made to compensate interviews lost owing to non-response, i.e., interviews not conducted due to respondent refusal, no contact with the resident or some other reason for loss in occupied households.
The loss adjustment factor was calculated by the ratio between the number of selected and occupied households (households with residents) in the PSU and the number of selected and occupied households with interviews conducted in the PSU. The formula used is shown as follows:

where,
 is the number of selected and occupied households (households
with residents) in the PSU i of stratum h; and
 is the number of selected and occupied households
(households with residents) with interview conducted in the PSU i of stratum h.
After correcting the weightings for non-response, another adjustment was made to the household weightings, referred to as calibration, or post-stratification. The main goal of the calibration of weightings is to get estimates that are consistent with the population projections released by IBGE7,8, so that, in estimating the total population of certain geographical levels, the estimate obtained coincides with the population estimates produced by the IBGE Board of Surveys' Coordination of Population and Social Indicators (COPIS).
Calibration was done using the estimated population as at July 27, 2013, by means of the following expression:

where,
 is the population estimate produced by COPIS for geographical
level d on July 27, 2013; and
 is the population estimate obtained with the survey
data for geographical level d.
Therefore, the final household weight , with correction for losses and calibrated population totals, is given by:

Weighting of selected resident
The selection of the resident who answered to the individual interview was done by simple random sampling. The weighting of the selected resident was therefore calculated by the product of the household weighting multiplied by the number of eligible residents at the household (equivalent to the inverse of the probability of selection). Thus, the basic weighting is given by:

And the weighting of the selected resident, including allowing for household non-response , is given by:

where,
k is the index of the selected resident;
Ohij is the number of residents aged 18 or older in the household j in PSU i of stratum
h.
As there was interview loss after resident selection, there was also a need for non-response correction at this stage. Initially, this adjustment was done in a way equivalent to the one already described within the PSU, considering households with resident interviews conducted. After consideration of the estimates of people by sex and characteristics of non-respondents residents, we decided to make the adjustment by sex, because it was found that the loss was higher among men than among women. Weightings, by sex, were as follows:
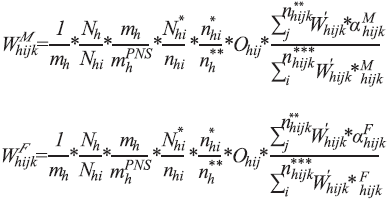
where,
 is the number of households selected with interview conducted
in the PSU i of stratum h;
 is the number of residents selected with interview conducted
in the PSU i of stratum h;
 indicates whether the resident selected in the household
j of PSU i of stratum h is male;
 indicates whether the selected resident in the household
j of PSU i of stratum h is female.
As household residents are sampled randomly, it is natural that due to this random selection, the population totals obtained with the expansion factors of the selected resident are not exactly the same as population totals obtained with the household expansion factors.
However, residents of the households as a whole form a much larger sample than just the selected residents and thus a more accurate estimate is obtained of these population totals. In order for the estimates to be equal, we chose to calibrate the selected resident weighting so that the population totals by sex and age groups would correspond to the total obtained with the household weighting. The four age groups used were 18-24 years, 25-39 years, 40-59 years and over 60 years.
The selected resident weighting was calibrated using the following formula, analogous to the weighting of the selected female resident:

where,
 is the population estimate obtained with the data of the
residents of the survey households for geographical level d male sex and age group c;
 is the population estimate obtained with the data
of the selected residents of the survey for geographical level d male sex and age group c.
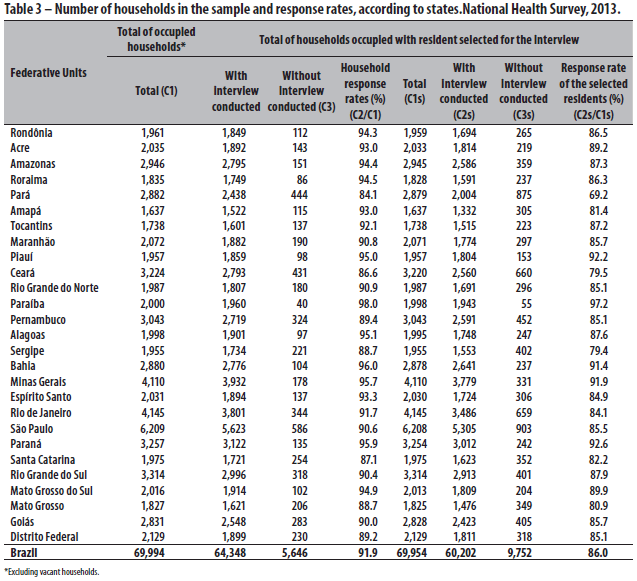
Non-response rates for households and for the selected resident are presented in Table 3.
Final Considerations
A certain amount of care needs to be taken when processing the data, since they are derived from a complex sample that generates estimates from data collected for households and all their residents (as per the sample selection stage) and for residents aged 18 years or older, who are randomly selected (third stage), including a weighting calibration process in both stages.
All samples originating from cluster sample research must be analyzed using statistical programs with algorithms for complex data analysis, which are able to correct the effect that the conglomeration of primary sampling units has on the estimates, i.e., the sampling plan design effect (DEFF). Most statistical packages have modules or libraries able to correct DEFF, including the Survey library of the R package , the SPSS Complex Sample module, SUDAAN, among others.
The calibration, or post-stratification process, also needs special care at the time of analysis. Generally, when there is no weighting calibration, it is sufficient to input the variables that define the strata, the PSUs, the type of design and the weightings corrected for non-response into the statistical program at the time of analysis. However, when the weightings go through a process of post-stratification, we must also input the population projections and the categories used for population total adjustments in the weighting calibration process. This information is provided by IBGE along with the database, however, not all statistical packages that perform analysis of complex sample data have this option.
In the case of PNS, there is a set of information related to the household and all its residents, including weightings corrected for non-response, both with and without calibration , the population projections and the categories of population projections. The same is true for the selected resident. The important thing is knowing when to use each one.
The final weightings with calibration adjustment should be used when it is not possible to incorporate the process of post-stratification into the analysis (informing the population projections and the categories of population projections) as the one-off estimates (average, totals, proportions) generated with this weighting are correct.
For professionals with little experience in analyzing data from complex samples, the database and necessary information about the variables that define the sampling plan and that have to be used for the data analysis in the statistical packages for complex data analysis are available at the PNS website (http://www.pns.icict.fiocruz.br/).
Authors' Contributions
Souza-Junior PRB, Freitas MPS, Antonaci GA participated in the conception and design of the study, writing, critical review of the contents and approval of the final version of the manuscript.
Szwarcwald CL participated in the conception and design of the study, critical review of the contents and approval of the final version of the manuscript.
All authors approved the final version of the manuscript and declare that they are responsible for all aspects of work, ensuring its accuracy and integrity.
References
1. Szwarcwald CL, Malta DC, Pereira CA, Vieira MLFP, Conde WL, Souza Júnior PRB, et al. National Health Survey in Brazil: design and methodology of application. Cien Saude Coletiva. 2014 Feb;19(2):333-42.
2. Instituto Brasileiro de Geografia e Estatística. Diretoria de Pesquisas. Coordenação de Trabalho e Rendimento. Sistema Integrado de Pesquisas Domiciliares - SIPD [Internet]. Rio de Janeiro: IBGE; 2007 [citado 2015 fev 2]. (Texto para discussão; 24). Disponível em: http://www.ibge.gov.br/home/estatistica/indicadores/sipd/texto_discussao_24.pdf
3. Instituto Brasileiro de Geografia e Estatística. Coordenação de Comunicação Social. Guia do Censo 2010 para jornalistas. Rio de Janeiro: IBGE; 2010. 40 p.
4. Freitas MPS, Lila MF, Azevedo RV, Antonaci GA. Amostra mestra para o Sistema Integrado de Pesquisas Domiciliares [Internet]. Rio de Janeiro: IBGE; 2007 [citado 2015 fev 2]. (Texto para discussão; 2.3). Disponível em: http://www.ibge.gov.br/home/estatistica/indicadores/sipd/texto_discussao_23.pdf
5. Freitas MPS, Antonaci GA. Sistema Integrado de Pesquisas Domiciliares: amostra mestra 2010 e amostra da PNAD contínua. Rio de Janeiro: IBGE; 2014 [citado 2015 mar 28]. (Texto para discussão; 50). Disponível em: http://biblioteca.ibge.gov.br/visualizacao/livros/liv86747.pdf
6. Cochran WG. Sampling techniques. 3th. New York: John Wiley & Sons; 1977.
7. Vasconcellos MTL, Silva PLN, Szwarcwald CL. Aspectos de amostragem da Pesquisa Mundial de Saúde no Brasil. Cad Saude Publica. 2005;21 supl 1:589-99.
8. Ruiz CMM, Silva PLN. Explorando alternativas para a calibração dos pesos amostrais da Pesquisa Nacional por Amostra de Domicílios. In: 6° Congreso de la Asociación Latinoamericana de Población [Internet]; 2014 ago 12-15; Lima. Peru: Asociación Latinoamericana de Población; 2014 [citado 2015 fev 2]. Disponível em: http://www.alapop.org/Congreso2014/DOCSFINAIS_PDF/ALAP_2014_FINAL948.pdf
 Correspondence:
Paulo Roberto Borges de Souza-Júnior
- Fundação Instituto Oswaldo Cruz,
Instituto de Comunicação e
Informação Científica e
Tecnológica em Saúde/
Ministério da Saúde,
Av. Brasil, no 4365,
Pavilhão Haity Moussatché,
Manguinhos, Rio de Janeiro-RJ,
Brasil. CEP: 21040-360.
E-mail: paulo.borges@icict.fiocruz.br
Received on 21/02/2015
Approved on 02/04/2015


 texto en
 Curriculum ScienTI
