Servicios Personalizados
Revista
Articulo
Indicadores
-
 Citado por SciELO
Links relacionados
-
 Similares en
SciELO
Compartir
Epidemiologia e Serviços de Saúde
versión impresa ISSN 1679-4974versión On-line ISSN 2237-9622
Epidemiol. Serv. Saúde v.24 n.2 Brasília jun. 2015
http://dx.doi.org/10.5123/S1679-49742015000200008
ORIGINAL ARTICLE
Unhealthy food consumption related to chronic non-communicable diseases in Brazil: National Health Survey, 2013
Rafael Moreira ClaroI; Maria Aline Siqueira SantosII; Tais Porto OliveiraII; Cimar Azeredo PereiraIII; Célia Landmann SzwarcwaldIV; Deborah Carvalho MaltaI,II
IUniversidade Federal de Minas Gerais, Escola de Enfermagem, Belo Horizonte-MG, Brasil
IIMinistério da Saúde, Secretaria de Vigilância em Saúde, Brasília-DF, Brasil
IIIFundação Instituto Brasileiro de Geografia e Estatística, Coordenação de Trabalho e Rendimentos, Rio de Janeiro-RJ, Brasil
IVFundação Instituto Oswaldo Cruz, Instituto de Comunicação e Informação Científica e Tecnológica em Saúde, Rio de Janeiro-RJ, Brasil
ABSTRACT
OBJECTIVE: to describe the consumption of unhealthy foods considered risk factors for chronic non-communicable diseases (NCDs) according to regional and sociodemographic characteristics of Brazilian adults.
METHODS: this was a cross-sectional survey representative of the Brazilian population aged ≥18 years using 2013 National Health Survey data; consumption prevalences were calculated by gender, age and schooling; consumption indicators were meat with excess fat, whole milk, soft drinks and sweets.
RESULTS: among the 60.202 respondents, the frequency of consumption of meat with excess fat was 37.2% (95%CI: 36.4-38.0), whole milk, 60.6% (95%CI: 59.8-61.4), regular consumption of soft drinks, 23.4% (95%CI: 22.7%-24.1), and regular consumption of candy and desserts, 21.7% (95%CI: 21.0-22.3); these factors were more common among men, young individuals and those with less schooling.
CONCLUSION: Consumption of dietary risk factors for NCDs is high in the Brazilian population.
Keywords: Health Surveys; Chronic Disease; Life Style; Feeding Behavior; Epidemiology, Descriptive.
Introduction
Since the second half of the 20th Century, favorable conditions to the occurrence of infectious diseases have been gradually replaced by a favorable scenario to the occurrence of Chronicle Non-Communicable Diseases (NCDs) related to excessive/unbalanced consumption of food and/or insufficient practice of physical activity.1 Such scenario is visible both in developed countries and, in great part, in developing countries, including Brazil.2 In this context, the 2003 Global Strategy of the World Health Organization (WHO) for Diet, Health and Physical Activity reinforces the need for improvement of the world food consumption pattern, focusing the reduction in the consumption of foods with high energy, low levels of nutrients and high levels of sodium, saturated fats, trans fats and refined carbohydrates.1,3
Studies on Brazilians' eating habits trends in the last decades emphasize the increase in consumption of meat and industrialized foods (soft drinks, biscuits and frozen meals) and the reduction in consumption of pulses, roots and tubers, fruits and vegetables.4,5 Based on these facts the Ministry of Health developed, along with other measures, the 2011-2022 Brazilian Strategic Action Plan to Combat Chronic Non-communicable Diseases (NCDs),6 in 2011, and re-edited the 'Dietary Guidelines for the Brazilian population: promoting a healthy diet', in 2014.7
Additionally, part of the Ministry's process of equipping the country with tools to monitor the frequency and distribution of the main determinant factors for NCDs was the introduction of the Surveillance System of Risk and Protection Factors for Chronic Diseases by Telephone Survey (Vigitel), which aims to continuously monitor, via telephone calls, the frequency and distribution of risk and protection factors for chronicle diseases in the capitals of all 26 Brazilian states, in addition to the Federal District. Vigitel (i) monitors the consumption of foods considered as risk or protection factors for the occurrence of NCDs, (ii) in addition to providing annual estimates of this kind of consumption among the target population.8,9 After the monitoring of risk and protection factors for NCDs - initially conducted by the Vigitel -, the National Health Survey (PNS) examined in 2013 the compatible group of food consumption indicators based on household interviews in an expanded sampling, which represents the entire country.10
The purpose of this study is to describe consumption of unhealthy foods considered risk factors for NCDs among Brazilian adults, based on regional and sociodemographic characteristics.
Methods
This is a descriptive study that uses data from the National Health Survey (PNS), 2013, which resulted from a cross-sectional survey representative of the entire adult population (aged 18 and older) about the food consumption indicators identified as unhealthy eating markers. The PNS comprises a household survey conducted in a partnership between the Ministry of Health and the Brazilian Geography and Statistics Institute (IBGE), and is part of the IBGE's Integrated System for Household Surveys (SIPD). The PNS is based on the main sample from the IBGE's National Survey for Household Sampling (PNAD), but it expanded the survey's geographic area for more accurate estimates.10,11
The sampling process used was the simple random sampling, divided in three stages: Census sectors (primary units); households (secondary units); and an adult resident aged 18 or older (tertiary units), selected to answer the specific survey from a list of residents made at the moment of the interview. Sampling weights were defined for the primary sampling units (UPA), for households and all of their residents, and for the selected resident.
The minimum size of the sampling was 1,800 households per Federation Unit (UF). The sampling was planned for 81,167 households, considering only occupied houses. 64,348 households were considered qualified, from which 60,202 adults were interviewed, resulting in an 8.1% non-answer ratio.
Field work was conducted under IBGE's guidance and the professionals involved in the survey - collecting agents, supervisors and coordinators - were previously trained. Interviews were done using PDA (Personal Digital Assistance) and handheld computers, and were scheduled in accordance to the respondents' availability and convenience, with two or more visits assured to each household, if necessary.
Other details of the sampling process and weighting are available in the article about the results of the PNS.10 The PNS survey can be accessed at: http://www.pns.icict.fiocruz.br/arquivos/Novos/Questionario%20PNS.pdf
The present study used data from questions related to unhealthy diets in the PNS. Based on those questions, four indicators were estimated:
a) Consumption of meat or chicken with excess fat. Prevalence (%) of individuals who reported consuming meat with excessive fat and/or chicken with skin (regardless of the amount consumed and the weekly frequency), based on two question proposed to the respondents, "When you eat red meat, do you usually: a) cut off excess of visible fat, b) eat it with fat?" "When you eat chicken, do you usually: a) cut off the skin, b) eat it with skin?" Both these habits - consumption of meat with fat and/or chicken with skin - are enough to establish a risk condition.22
b) Consumption of milk with full fat content. Prevalence (%) of individuals who reported drinking only whole milk (regardless of the amount and weekly frequency), based on the following question, "When you drink milk, what kind of milk do you usually drink: a) whole, b) skimmed or semi-skimmed, c) both kinds?" The reference to exclusive consumption of whole milk or of both kinds of milk - whole and skimmed - is enough to establish a risk condition.22
c) Regular consumption of soft drinks or artificial juice. Prevalence (%) of individuals who reported consuming soft drinks or artificial juice 5 days a week or more, based on the following question, "How many days a week do you usually drink soft drinks (or artificial juice)? a) 1 to 2, b) 3 to 4, c) 5 to 6 d) Every day e) Almost never f) Never"
d) Regular consumption of sweet foods. Prevalence (%) of individuals who reported consuming sweet foods 5 days a week or more, based on the following question, "How many days a week do you usually eat sweet foods, such as pieces of cake or pie, chocolate, sweets, biscuits or sweet biscuits? a) 1 to 2, b) 3 to 4, c) 5 to 6 d) Every day e) Almost never f) Never" The calculation of indicators used the classification employed by the Surveillance System of Risk and Protection Factors for Chronic Diseases by Telephone Survey (Vigitel).9
Prevalences of the results and their respective 95% confidence intervals (95%CI) were presented according to population strata based on sex (male; female), age (four age groups: 18 to 24, 25 to 39, 45 to 59 and 60 and older), education level (uneducated and incomplete primary school; complete primary school and incomplete secondary school; complete secondary school and incomplete university degree; university degree), race/ skin color (black; white; brown; yellow; indigenous), in addition to region (urban; rural) and state and region of residence. Classification of sociodemographic variables was based on the model employed by IBGE for the 2010 demographic census.
Significant differences between the indicators in the different populational strata consulted were identified based on the comparison among the 95%CI of frequencies. The absence of overlaping between intervals was assumed as significant difference (p<0.05). Analysis of data was performed using Stata software 11.0, which considered the effects of complex sampling from the 2013 PNS (survey module).
The PNS was approved by the National Commission for Ethics in Research (CONEP) of the National Health Council (CNS) from the Ministry of Health, under Decree n. 328,159 of June 26, 2013.
Results
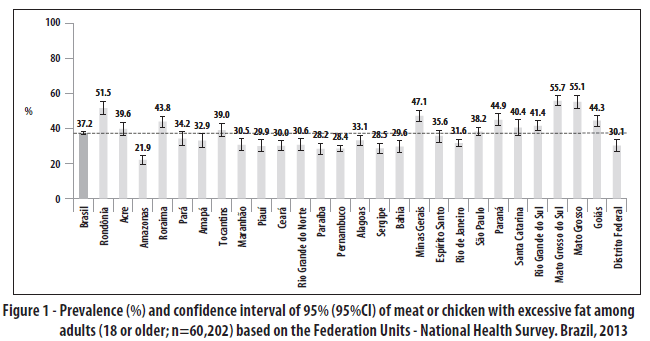
Consumption of meat or chicken with excessive fat was reported by 37.2% of the respondents, and is higher among men (47.2%; 95%CI: 46.0 - 48.4), individuals aged 25 to 39 (41.0%; 95%CI: 39.8 - 42.3), individuals with complete primary school and incomplete secondary school (42.2%; 95%CI: 40.4 - 44.1) and in the black population (39.7%; 95%CI: 37.4 - 42.1) (Table 1). This consumption was also higher among residents of rural areas (45.8%; 95%CI: 43.9 - 47.8) and in the Southern (42.5%; 95%CI: 40.5 - 44.5) and Central-Western regions (45.7%; 95%CI: 44.0 - 47.5) (Table 1). When comparing states, the highest frequencies were found in Mato Grosso do Sul (55.7%; 95%CI: 52.9% - 58.5), Mato Grosso (55.1%; 95%CI: 51.3 -59.0) and Rondônia (51.5%; 95%CI: 47.7 - 55.4), and the lowest in Amazonas (21.9%: 95%CI: 19.6 - 24.4), Paraíba (28.2%; 95%CI: 25.0 - 31.5) and Bahia (28.4%; 95%CI: 26.3 - 32.9) (Figure 1).
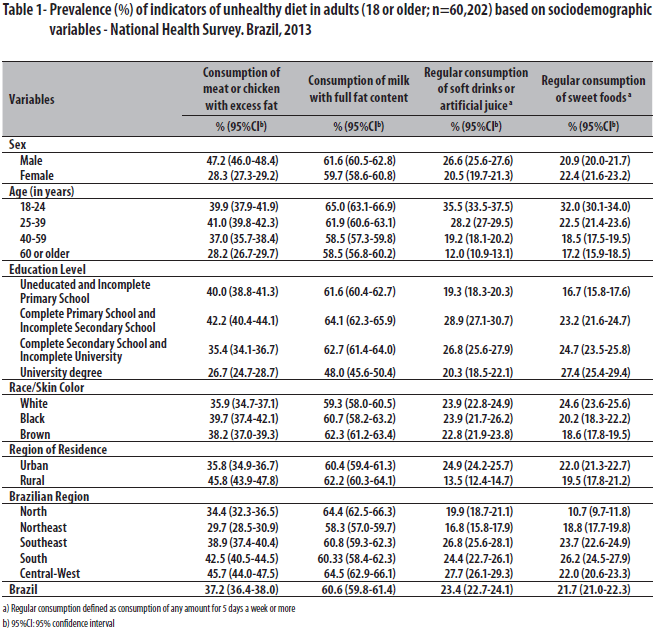
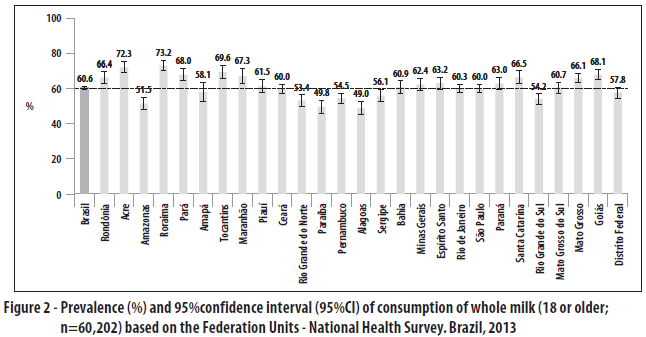
Consumption of whole milk was reported by 60.6% (95%CI: 59.8 - 61.4) of the respondents, and is higher among younger individuals (aged 18 to 24) (65.0%; 95%CI: 63.1 - 66.9) and those with an incomplete university degree. No differences based on sex and race/skin color were found (Table 1). Frequency of consumption was the same in both urban and rural areas, and higher in the Central-Western region (64.5%; 95%CI: 62.9 - 66.1) (Table 1). Among the states, the highest frequencies were found in Roraima (73.2%; 95%CI: 70.2 - 76.1), Acre (72.3%; 95%CI: 69.0 - 75.7) and Tocantins (69.6%; 95%CI: 65.9 - 73.3), and the lowest in Alagoas (49.0%; 95%CI: 45.5 - 52.6), Paraíba (49.8%; 95%CI: 46.1 - 53.4) and Amazonas (51.5%; 95%CI: 48.1 - 54.9) (Figure 2)
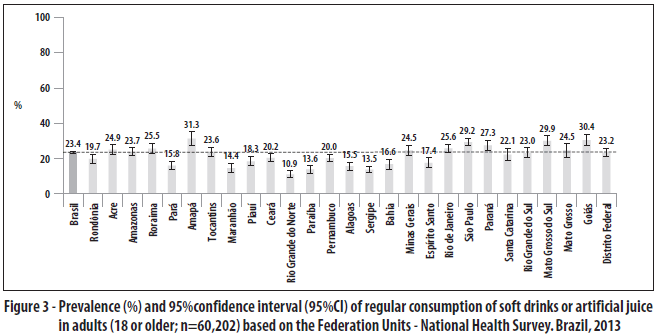
Prevalence of regular consumption of soft drinks or artificial juice was 23.4% (95%CI: 22.7 - 24.1), it was higher among men (26.6%; 95%CI: 25.6 - 27.6), and showed a decrease in older individuals. This consumption was also higher in intermediary levels of education and did not show significant differences based on race/skin color. Comparing the regions of residence, consumption of soft drinks and artificial juices was higher in the urban area (24.9%;95%CI : 24.2 - 25.7) and in the Central-West region (27.7%; 95%CI: 26.1 - 29.3) (Table 1). Comparing states, the highest frequencies of this consumption were found in Amapá (31.3%; 95%CI: 27.5 - 35.1), Goiás (30.4%; 95%CI: 27.5 - 33.4) and Mato Grosso do Sul (29.9%; 95%CI: 27.1 - 32.7); and the lowest in Rio Grande do Norte (10.9%; 95%CI: 9.0 - 12.8), Sergipe (13.5%; 95%CI: 11.7 - 15.3) and Paraíba (13.6%; 95%CI: 11.4 - 15.8) (Figure 3).
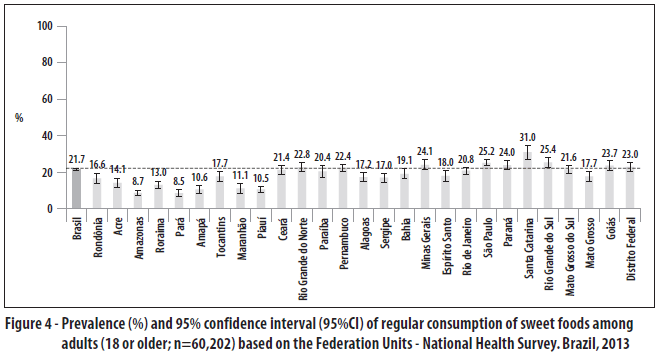
At last, prevalence of regular consumption of sweet foods was 21.7% (95%CI: 21.0 - 22.3) in the group studied. This prevalence decreases in older individuals and increases in higher levels of education, and is higher among white skin individuals (24.6%; 95%CI: 23.6 - 25.6) when compared to other groups (Table 1). This consumption was also higher among residents of urban areas (45.8%; 95%CI: 43.9 - 47.8) and in the South (42.5%; 95%CI: 40.5 - 44.5) and Central-West (45.7%; 95%CI: 44.0 - 47.5) (Table 1). The Federation Units with the highest prevalences of this consumption were Santa Catarina (31.0%; 95%CI: 27.2 - 34.8), Rio Grande do Sul (25.4%; 95%CI: 22.6 - 28.1) and São Paulo (25.2%; 95%CI: 23.5 - 26.8), and the lowest prevalences were found in Pará (8.5%; 95%CI: 6.6 -10.5), Amazonas (8.7%; 95%CI: 7.4 - 10.1) and Piauí (10.5%; 95%CI; 8.7 - 12.3) (Figure 4).
Discussion
The detailed study about the frequency of consumption of foods which are considered to be risk factors for NCDs in the Brazilian population gives important information for the planning and evaluation of preventive actions against these diseases in the country. With regard to groups of population studied, the indicators show a prevalence of more than 20%, which indicates a high presence of risk behaviors in the population. The worst situation was the high prevalence of consumption of foods with saturated fats: 6 in 10 Brazilians reported consuming whole milk, and 4 in 10 reported consuming meat or chicken with excessive fat. Consumption of sugar-based foods was less frequent, with 2 in 10 Brazilians reporting consuming soft drinks (or artificial juice) or sweets on a regular basis. In general, risk factors were more prevalent among men, younger age groups and lower levels of education individuals.
Some restrictions should be noticed in the analysis of these results. A central matter is the validity and reproducibility of the indicators presented. Although no study on the data collected by the PNS has been conducted yet, three of the four indicators here presented had their validity analyzed (the questions on these indicators are shared by the Vigitel and the PNS).12-14 The indicators of consumption of meat or chicken with excessive fat, whole milk and soft drinks showed satisfactory validity in all the published studies until the present moment.12-14 However, the fact that the information was self-reported (by the respondents), makes it natural to believe that, in case of bias - given that these behaviors are seen as negative by sanitary authorities and the public opinion -, the real frequencies would still be higher than those observed in the study. Even if the indicator of consumption of sweet foods was not evaluated until the conclusion of this report, it is natural to assume that its validity is similar to that seen in other indicators, given that they were calculated in a similar way.
The instrument for data collection employed by the PNS does not allow the daily evaluation of the total quantity of saturated fat and free sugars consumed, because that information on the consumed quantity of foods - the aim of this study - and other sources of these nutrients are not calculated. Nonetheless, the high prevalence of foods evaluated in the total consumption of saturated fat and free sugars in the Brazilian population makes it possible to conclude that its inquiry is somehow close to the consumption of these nutrients.15 A study conducted from data on eating habits collected by the 2008-2009 Family Budget Survey POF/IBGE emphasizes the high prevalence of meat (together with oils and fats) in the consumption of saturated fat and of soft drinks in the consumption of sugar by the Brazilian population, reinforcing the reliability of the data here presented.15
Few studies have evaluated the consumption of foods and drinks rich in saturated fat and sugars, which allows the direct comparison of their results to this study.15-17 In general, analyses of consumption adjustment of nutrients by the Brazilian population using data from the POF/IBGE of 2002-2003 and 2008-2009 show that the Brazilian population's consumption of saturated fat is within the maximum limit recommended by WHO (10% of total calories).1,4 However, the high frequency of individuals who reported consuming meat or chicken with excessive fat and whole milk shows that the consumption of this nutrient could reach even lower levels if simple actions were taken at home, for example: cutting the visible fat and the skin off the meat and the chicken before their consumption, and replacing whole milk for skimmed milk.
Consumption of free sugars by the Brazilian population is known to exceed in more than 50% the maximum limit recommended by WHO, of 10% of total calories.1,18 Indeed, the frequency of consumption of soft drinks and artificial juices identified in the present study is similar to that noticed in the United States of America in 2011, of 26.3%.19 This situation is alarming, given the clearly defined relation between consumption of sweet drinks and excessive weight gain.20
Evidence indicates the coexistence of saturated fat and free sugars in the Brazilian population's consumption pattern,21 suggesting that educational and preventive intervention might form an interesting strategy for reduction in the excessive consumption of these nutrients.
The 2011-2022 Strategic Action Plan to Combat Chronic Non-communicable Diseases (NCDs) in Brazil, from the Ministry of Health, prioritizes the reduction in the exposure of the population to risk factors, and the incentives to protective factors, aiming at expanding measures of health protection: creating spaces for practicing physical activity, prohibiting cigarette advertisement, creating smoking-free places, in addition to supporting healthy lifestyles for a better quality of life and well-being of the population.22,23 Even though the reduction in consumption of fats and free sugars are not explained in the planned targets, they can be acknowledged several times among the actions suggested by the Plan, like regulating nutritional composition of processed foods for the reduction of their sugar level.22
Furthermore, from the several on-going actions against eating habits deemed inappropriate for the Brazilian population, one which is important to highlight is the publishing of a new edition of the "Dietary Guidelines for the Brazilian population: Promoting a Healthy Diet", in 2014.7 One of the recommendations in the Guide is to prioritize in natura or minimally processed foods, especially vegetables, over ultra-processed foods, like soft drinks and sweets.
This study has identified a high prevalence of consumption of unhealthy foods considered risk factors for NCDs in the Brazilian population. In general, this consumption was higher among men, younger and less educated individuals. Preventive actions against NCDs to promote health should take the distribution of these factors on the population into consideration, in order to make them more effective.
Authors' Contributions
Claro RM, Santos MAS and Malta DC were part of the conception and designing of the study, data analysis, critical revision and discussion of results, in addition to the writing of the initial version of the manuscript.
Oliveira TP, Pereira CA and Szwarcwald CL were part of the conception and designing of the study, data analysis and writing of the manuscript.
All the authors have approved the final version of the manuscript and are responsible for all its aspects, assuring their accuracy and integrity.
References
1. World Health Organization. Diet, nutrition and the prevention of chronic diseases: report of a Joint WHO/FAO Expert Consultation. Geneva: World Health Organization; 2003.
2. Popkin BM, Gordon-Larsen P. The nutrition transition: worldwide obesity dynamics and their determinants. Int J Obes Relat Metab Disord [Internet]. 2004 Nov [cited 2015 Jan 8];28 Suppl 3:S2-S9. Available from: http://www.ncbi.nlm.nih.gov/pubmed/15543214
3. World Health Organization. Integrated prevention of noncommunicable diseases: global strategy on diet, physical activity and health. Geneva: World Health Organization; 2004.
4. Levy-Costa RB, Sichieri R, Pontes NS, Monteiro CA. Disponibilidade domiciliar de alimentos no Brasil: distribuição e evolução (1974-2003). Rev Saude Publica [Internet]. 2005 ago [citado 2015 jan 8];39(4):530-40. Disponível em: http://www.scielo.br/pdf/rsp/v39n4/25522.pdf
5. Levy RB, Claro RM, Mondini L, Sichieri R, Monteiro CA. Distribuição regional e socioeconômica da disponibilidade de alimentos no Brasil, 2008-2009. Rev Saude Publica [Internet]. 2012 fev [citado 2015 jan 8];46(1):6-15. Disponível em: http://www.scielo.br/pdf/rsp/v46n1/3014.pdf
6. Malta DC, Silva Júnior JB. Plano de Ações Estratégicas para o Enfrentamento das Doenças Crônicas Não Transmissíveis no Brasil após três anos de implantação, 2011-2013. Epidemiol Serv Saude [Internet]. 2014 jul-set [citado 2015 fev 26];23(3):389-98. Disponível em: http://scielo.iec.pa.gov.br/pdf/ess/v23n3/v23n3a02.pdf
7. Ministério da Saúde (BR). Secretaria de Atenção à Saúde. Departamento de Atenção Básica. Guia alimentar para a população brasileira: promovendo a alimentação saudável. 2. ed. Brasília: Ministério da Saúde; 2014.
8. Ministério da Saúde (BR). Secretaria de Vigilância em Saúde. Secretaria de Gestão Estratégica e Participativa. Vigitel Brasil 2006: vigilância de fatores de risco e proteção para doenças crônicas por inquérito telefônico. Brasília: Ministério da Saúde; 2007.
9. Ministério da Saúde (BR). Secretaria de Vigilância em Saúde. Vigitel Brasil 2013: vigilância de fatores de risco e proteção para doenças crônicas por inquérito telefônico. Brasília: Ministério da Saúde; 2014. (Série G. Estatística e informação em saúde).
10. Instituto Brasileiro de Geografia e Estatística. Pesquisa Nacional de Saúde: percepção do estado de saúde, estilos de vida e doenças crônicas: 2013. Rio de Janeiro: IBGE; 2014.
11. Szwarcwald CL, Malta DC, Pereira CA, Vieira MLFP, Conde WL, Souza Júnior PRB, et al. Pesquisa Nacional de Saúde no Brasil: concepção e metodologia de aplicação. Cien Saude Coletiva [Internet]. 2014 fev [citado 2015 jan 8];19(2):333-42. Disponível em: http://www.scielo.br/pdf/csc/v19n2/1413-8123-csc-19-02-00333.pdf
12. Mendes LL, Campos SF, Malta DC, Bernal RTI, Sá NNBD, Velásquez-Meléndez G. Validade e reprodutibilidade de marcadores do consumo de alimentos e bebidas de um inquérito telefônico realizado na cidade de Belo Horizonte (MG), Brasil. Rev Bras Epidemiol [Internet]. 2011 set [citado 2015 jan 8];14 supl 1:S80-S89. Disponível em: http://www.scielo.br/pdf/rbepid/v14s1/a09v14s1.pdf
13. Monteiro CA, Moura EC, Jaime PC, Claro RM. Validade de indicadores do consumo de alimentos e bebidas obtidos por inquérito telefônico. Rev Saude Publica [Internet]. 2008 ago [citado 2015 jan 26];42(4):582-9. Disponível em: http://www.scielo.br/pdf/rsp/v42n4/6923.pdf
14. Neves ACMD, Gonzaga LAA, Martens IBG, Moura EC. Validação de indicadores do consumo de alimentos e bebidas obtidos por inquérito telefônico em Belém, Pará, Brasil. Cad Saude Publica [Internet]. 2008 dez [citado 2015 jan 26];26(12):2379-88. Disponível em: http://www.scielo.br/pdf/csp/v26n12/16.pdf
15. Pereira RA, Duffey KJ, Sichieri R, Popkin BM. Sources of excessive saturated fat, trans fat and sugar consumption in Brazil: an analysis of the first Brazilian nationwide individual dietary survey. Public Health Nutr [Internet]. 2012 Jan [cited 2015 Jan 26];17(1):113-21. Available from: http://www.ncbi.nlm.nih.gov/pubmed/23190560
16. Rombaldi AJ, Neutzling MB, Silva MC, Azevedo MR, Hallal PC. Fatores associados ao consumo regular de refrigerante não dietético em adultos de Pelotas, RS. Rev Saude Publica [Internet]. 2011 abr [citado 2015 jan 26];45(2):382-90. Disponível em: http://www.scielo.br/pdf/rsp/v45n2/1664.pdf
17. Muniz LC, Schneider BC, Silva ICM, Matijasevich A, Santos IS. Fatores de risco comportamentais acumulados para doenças cardiovasculares no sul do Brasil. Rev Saude Publica [Internet]. 2012 mar [citado 26 fev 2015];46(3):534-42. Disponível em: http://www.scielo.br/pdf/rsp/v46n3/3690.pdf
18. Levy RB, Claro RM, Monteiro CA. Disponibilidade de "açúcares de adição" no Brasil: distribuição, fontes alimentares e tendência temporal. Rev Bras Epidemiol [Internet]. 2012 mar [citado 2015 jan 26];15(1):3-12. Disponível em: http://www.scielo.br/pdf/rbepid/v15n1/01.pdf
19. Kumar GS, Pan L, Park S, Lee-Kwan SH, Onufrak S, Blanck HM. Sugar-sweetened beverage consumption among adults-18 States, 2012. MMWR Morb Mortal Wkly Rep [Internet]. 2014 Aug [cited 2015 Jan 26];63(32):686-90. Available from: http://www.cdc.gov/mmwr/preview/mmwrhtml/mm6332a2.htm
20. Malik VS, Schulze MB, Hu FB. Intake of sugar-sweetened beverages and weight gain: a systematic review. Am J Clin Nutr [Internet]. 2006 Aug [cited 2015 Jan 26];84(2):274-88. Available from: http://www.ncbi.nlm.nih.gov/pubmed/16895873
21. Levy RB, Claro RM, Monteiro CA. Aquisição de açúcar e perfil de macronutrientes na cesta de alimentos adquirida pelas famílias brasileiras (2002-2003). Cad Saude Publica [Internet]. 2010 mar [citado 2015 jan 26];26(3):472-80. Disponível em: http://www.scielo.br/pdf/csp/v26n3/05.pdf
22. Ministério da Saúde (BR). Secretaria de Vigilância em Saúde. Departamento de Análise de Situação de Saúde. Plano de ações estratégicas para o enfrentamento das Doenças Crônicas Não Transmissíveis (DCNT) no Brasil 2011-2022. Brasília: Ministério da Saúde; 2011.
23. Malta DC, Morais Neto OL, Silva Junior JB. Apresentação do plano de ações estratégicas para o enfrentamento das doenças crônicas não transmissíveis no Brasil, 2011 a 2022. Epidemiol Serv Saude [Internet]. 2011 out-dez [citado 2015 jan 26];20(4):425-38. Disponível em: http://scielo.iec.pa.gov.br/pdf/ess/v20n4/v20n4a02.pdf
 Correspondence:
Rafael Moreira Claro
Universidade Federal de Minas Gerais,
Escola de Enfermagem,
Departamento de Nutrição,
Av. Prof. Alfredo Balena, no 190,
Santa Efigênia, Belo Horizonte-MG,
Brasil. CEP: 30130-100.
E-mail: rafael.claro@gmail.com
Received on 09/02/2015
Approved on 17/03/2015


 texto en
 Curriculum ScienTI
