


Serviços Personalizados
Journal

Artigo
 texto em
  Inglês (pdf)
 Artigo em XML
 Referências do artigo
 Enviar este artigo por email
Indicadores
-
 Citado por SciELO
Links relacionados
-
 Similares em
SciELO
Similares em
SciELO
Compartilhar

 Permalink
Epidemiologia e Serviços de Saúde
versão impressa ISSN 1679-4974versão On-line ISSN 2337-9622
Epidemiol. Serv. Saúde v.25 n.3 Brasília jul./set. 2016
http://dx.doi.org/10.5123/S1679-49742016000300003
ORIGINAL ARTICLE
Spatial and temporal analysis of Aids cases in Brazil, 1996-2011: increased risk areas over time*
1Universidade de Brasília, Programa de Pós-Graduação em Medicina Tropical, Brasília-DF, Brasil
2Fundação Instituto Oswaldo Cruz, Diretoria Regional de Brasília, Brasília-DF, Brasil
METHODS:
this is an ecological study involving georeference of AIDS cases incidence, prevalence and density in Brazilian municipalities using the Kernel method for the periods 1996-1999, 2000-2003, 2004-2007 and 2008-2011.
RESULTS:
633,512 AIDS cases were reported between 1996-2011; between 2008-2011, there was increased risk of AIDS transmission in Recife-João Pessoa region, the emergence of areas with average density in the regions of Belém, São Luís, Maceió, Aracaju and Salvador, and a decline in the intensity of risk in São Paulo, Campinas and Ribeirão Preto; prevalence rates were most concentrated in the Southeast, South and Midwest regions of the country.
CONCLUSION:
overall, AIDS incidence in Brazil showed successive increases in the periods analyzed; case prevalence indicates spatial clusters, with high concentrations in the Southeast, South and Midwest regions.
Key words: Acquired Immunodeficiency Syndrome; Risk; Indicators; Spatial Analysis; Ecological Studies
Introduction
Acquired Immunodeficiency Syndrome (AIDS) is a retrovirus mainly transmitted sexually and parenterally, which, in the course of its natural history, causes depletion of CD4+ T-cells, resulting in low immunity and predisposition to severe opportunistic diseases. Since the 1990s, considerable progress has been made in the care of AIDS patients, and the discovery and the improvement of Highly Active Antiretroviral Therapy (HAART) was the factor that had greater impact on prognosis and epidemiology of this disease.1,2
AIDS is a notifiable disease in Brazil. Data on AIDS in this country are recorded in different information systems, being the most important the surveillance database from the Information System for Notifiable Diseases (SINAN). Other systems involved in AIDS surveillance include the Laboratory Tests Control System of the National CD4+/CD8+ T-cell and Viral Load Count Network (SISCEL), the Logistic Control System of Medicines (SICLOM) and the Mortality Information System (SIM). The epidemiology of this disease is also monitored by descriptive studies carried out regularly, such as studies on parturients3 and conscripts,4 and those on behavior, attitude and practice in specific population strata.5
In 2014, about 730,000 people were living with HIV in Brazil, and there was a prevalence of infection in 0.4 to 0.7% of the population.6 From 2008 to 2013, the average incidence of AIDS in Brazil was 40,000 cases per year, with an average incidence rate of 21 cases per 100,000 inhabitants. In the same period, mortality due to AIDS presented a standardized rate of about six per 100,000 inhabitants per year (approximately 12,000 deaths per year).7
AIDS surveillance has changed since the beginning of the pandemic, resulting from revisions of definitions and implementation of new practices of case prevention.8 In this context, the epidemiological information has acquired a leading role in defining and conducting surveillance actions, contributing to the implementation of new protocols for treatment and prevention.
The geographical distribution of AIDS cases in Brazil is heterogeneous, due to its wide territory and the concentration of cases in certain regions. In the 2000s, there was an increase in the number of cases in the North and Northeast regions of the country, whilst the other regions presented stability.9 The highest concentration of cases occur in large urban centers, such as state capitals and metropolitan regions, as well as cities with higher sociodemographic and socioeconomic flow, such as the coastal cities.10,11 In several Brazilian geographic regions, the number of cases in smaller municipalities present variation, and is not homogeneous among municipalities with similar characteristics, located in different regions.12
Geoprocessing and spatial analysis of data on AIDS cases can provide to public health managers a better understanding of the epidemic in Brazil.10,12 Understanding the spatial distribution of AIDS cases can help identify geographic areas under greater epidemiological pressure.13 The use of geoprocessing techniques - i.e. Geographic Information Systems (GIS) -, which have in their conception the use of geographic information when reporting the location (geographical position) of the event, provides information in order to support the implementation of interventions, complementing the list of strategies adopted by health surveillance to tackle HIV/AIDS. The increasing complexity and the changes on epidemiological behavior of HIV infection require the use of indicators that are different from other infectious diseases. In order to assist in this monitoring, the use of spatial analysis techniques can contribute to a better understanding of the transmissibility of this disease.14-16 This study aimed to identify areas with higher risk of AIDS transmission in Brazil.
Methods
An ecological study was carried out with spatial analysis of 633,512 AIDS cases, according to the Brazilian definition of case: individuals with CD4+ T-cells counts lower than 350 cells/mm³, or with diagnosis of opportunistic disease or, still, by death.17
For the database with AIDS cases, we compared the data from different information systems: Information System for Notifiable Diseases (SINAN), Laboratory Tests Control System - National CD4+/CD8+ T-cell and Viral Load Count Network (SISCEL) and Mortality Information System (SIM). In order to relate these three databases, we adopted probabilistic procedures, using the software RecLink(r), version 3.0, being the patient's name, date of birth and the mother's name the key-variables for comparison. The records from SISCEL and SIM whose key-variables were incomplete or blank were excluded from the analysis.
The information regarding the diagnosis date and the individuals' place of residence were settled in a way to obtain the same information in a single database. The diagnosis date and the individuals' place of residence were taken from SINAN. From the SISCEL and SIM cases, the date of collection of biological sample (from SISCEL) was used as proxy for the diagnosis date. The date of death was taken from SIM. As for the information about individuals' place of residence, the data from each of those systems were used.
After comparing the databases, it was possible to obtain the numbers of AIDS cases in each of the 5,565 Brazilian municipalities, and at least one case was found in 5,123 (92.1%) municipalities. Then, the incidence rate and the coefficient of AIDS prevalence were calculated. For the incidence rate, the numerators were considered to be the new AIDS cases identified each year: the cases identified in a given year were divided by the resident population of that same year for each year, from 1996 to 2011. The calculation of AIDS prevalence, in the years 1999, 2003, 2007 and 2011, was performed by calculating for each of these years the total cumulative AIDS cases since 1980 (the year of the first case identified in Brazil) up to the given year, discounting deaths within the same period. Then, the value found was divided by the total of the resident population in that year. In both indicators, the resulting value was multiplied by the constant '100,000'. Four periods - or time intervals - were determined to calculate the average rate of AIDS incidence, of cumulative incidence, and of coefficient of prevalence: 1996-1999, 2000-2003, 2004-2007 and 2008-2011.
The size of the resident population in the municipalities was obtained from demographic censuses and intercensal population projections produced by the Brazilian Institute of Geography and Statistics (IBGE). From IBGE, we also obtained the geographic coordinates of Brazilian municipalities for the construction of thematic maps.18
The spatial analysis was done with the average incidence rate and prevalent cases, in order to identify a pattern in the density of the disease. For this purpose, we used the Kernel method with adaptive influence radius, which is the ability to describe how the density at one area can influence in its neighborhood - in the case of this study, in neighboring municipalities, taking into account the influence of different geographic areas in Brazilian municipalities.19,20 This method allows estimating the probability of an event in each cell of a regular grid. Each cell of this grid is considered in a way that nearby events get larger weights, and the furthest, less weight. The decrease of these weights was defined gradually.19,20
The descriptive data analysis was conducted with the software Statistical Package for the Social Sciences (SPSS(r)) from International Business Machines (IBM(r)), version 18.0; Spatial data analysis was conducted with the software TerraView(r), version 4.2.2; and the linkage of database was conducted with the software RecLink(r) version 3.0.
This study was approved by the Research Ethics Committee of the College of Health Sciences from the University of Brasilia (CEP/FS-UnB) on August 30, 2013, No. 379,170, and by the Department of STD, AIDS and Viral Hepatitis (DDAHV) from the Ministry of Health's Surveillance Secretariat (SVS).
Results
AIDS incidence in Brazil presented successive increases in the analyzed periods. The risk of getting AIDS, represented by the average incidence rate, also showed the same pattern, as well as the prevalence of cases, which showed persistent increase for all periods (Table 1).
Table 1 - Indicators of AIDS incidence and prevalence, Brazil, 1996-2011
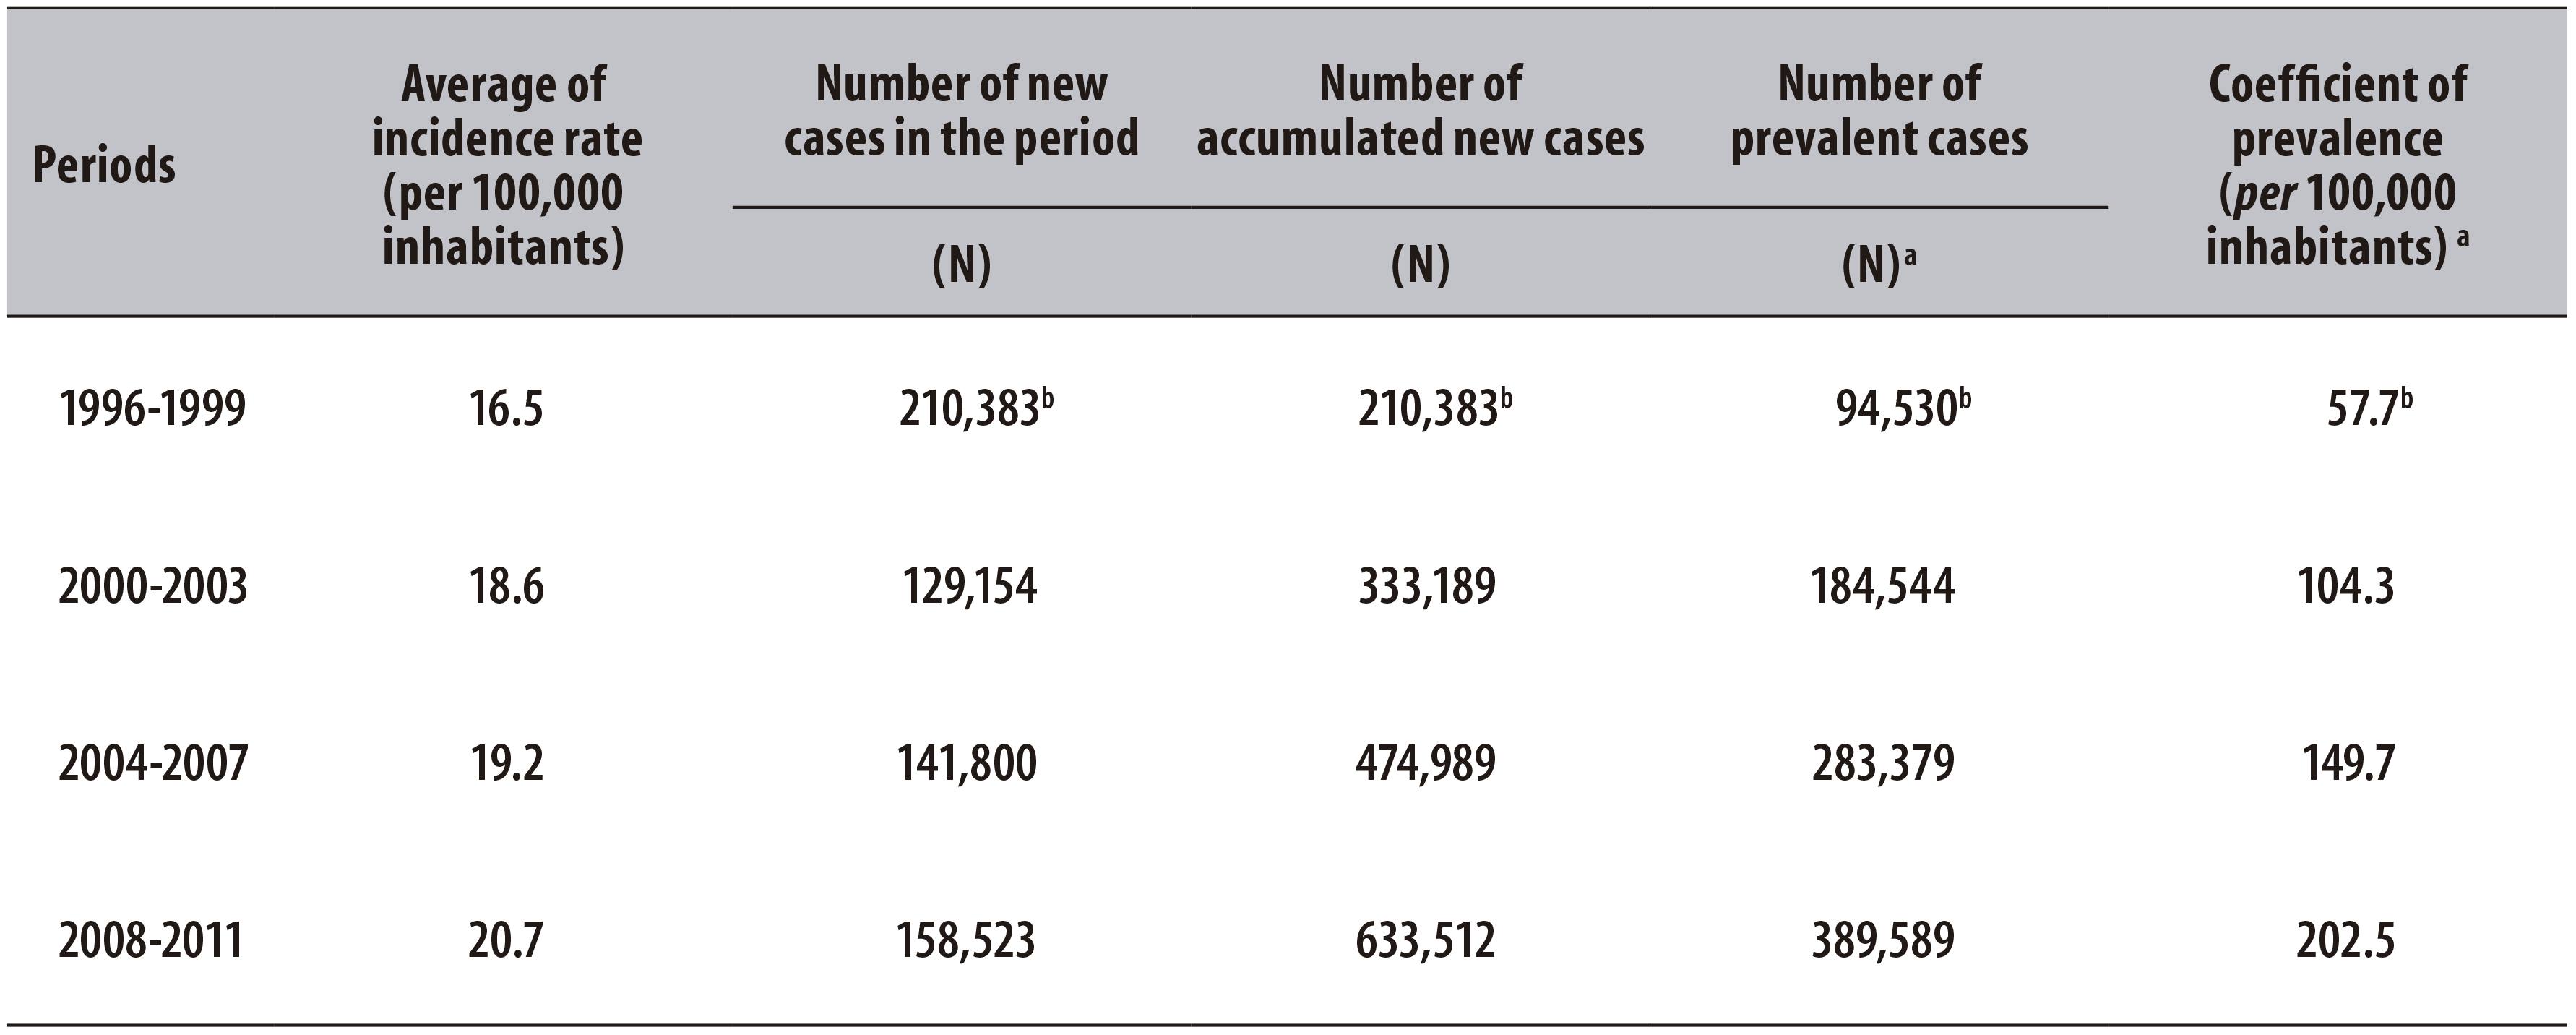
a) At the end of the period
b) Since 1980
In 1996-1999 and 2000-2003, the South and Southeast regions had the highest average incidence rates: 25.2 and 25.1 per 100,000 inhabitants in the Southeast region, and 19.9 and 29.7 per 100,000 inhabitants in the South (Figures 1A and 1B). In subsequent periods, particularly in 2008-2011, the states of the North and Midwest regions had similar levels of average incidence in comparison with those of the South and Southeast, reaching 21.0 per 100,000 inhabitants for the North and 16.9 per 100,000 inhabitants for the Midwest (2008-2011). There was an increase for average incidence rates in all geographical regions, with maintenance of high average rates in the Southeast and South: 21.4 per 100,000 inhabitants and 31.0 per 100,000 inhabitants, (2008-2011), respectively.
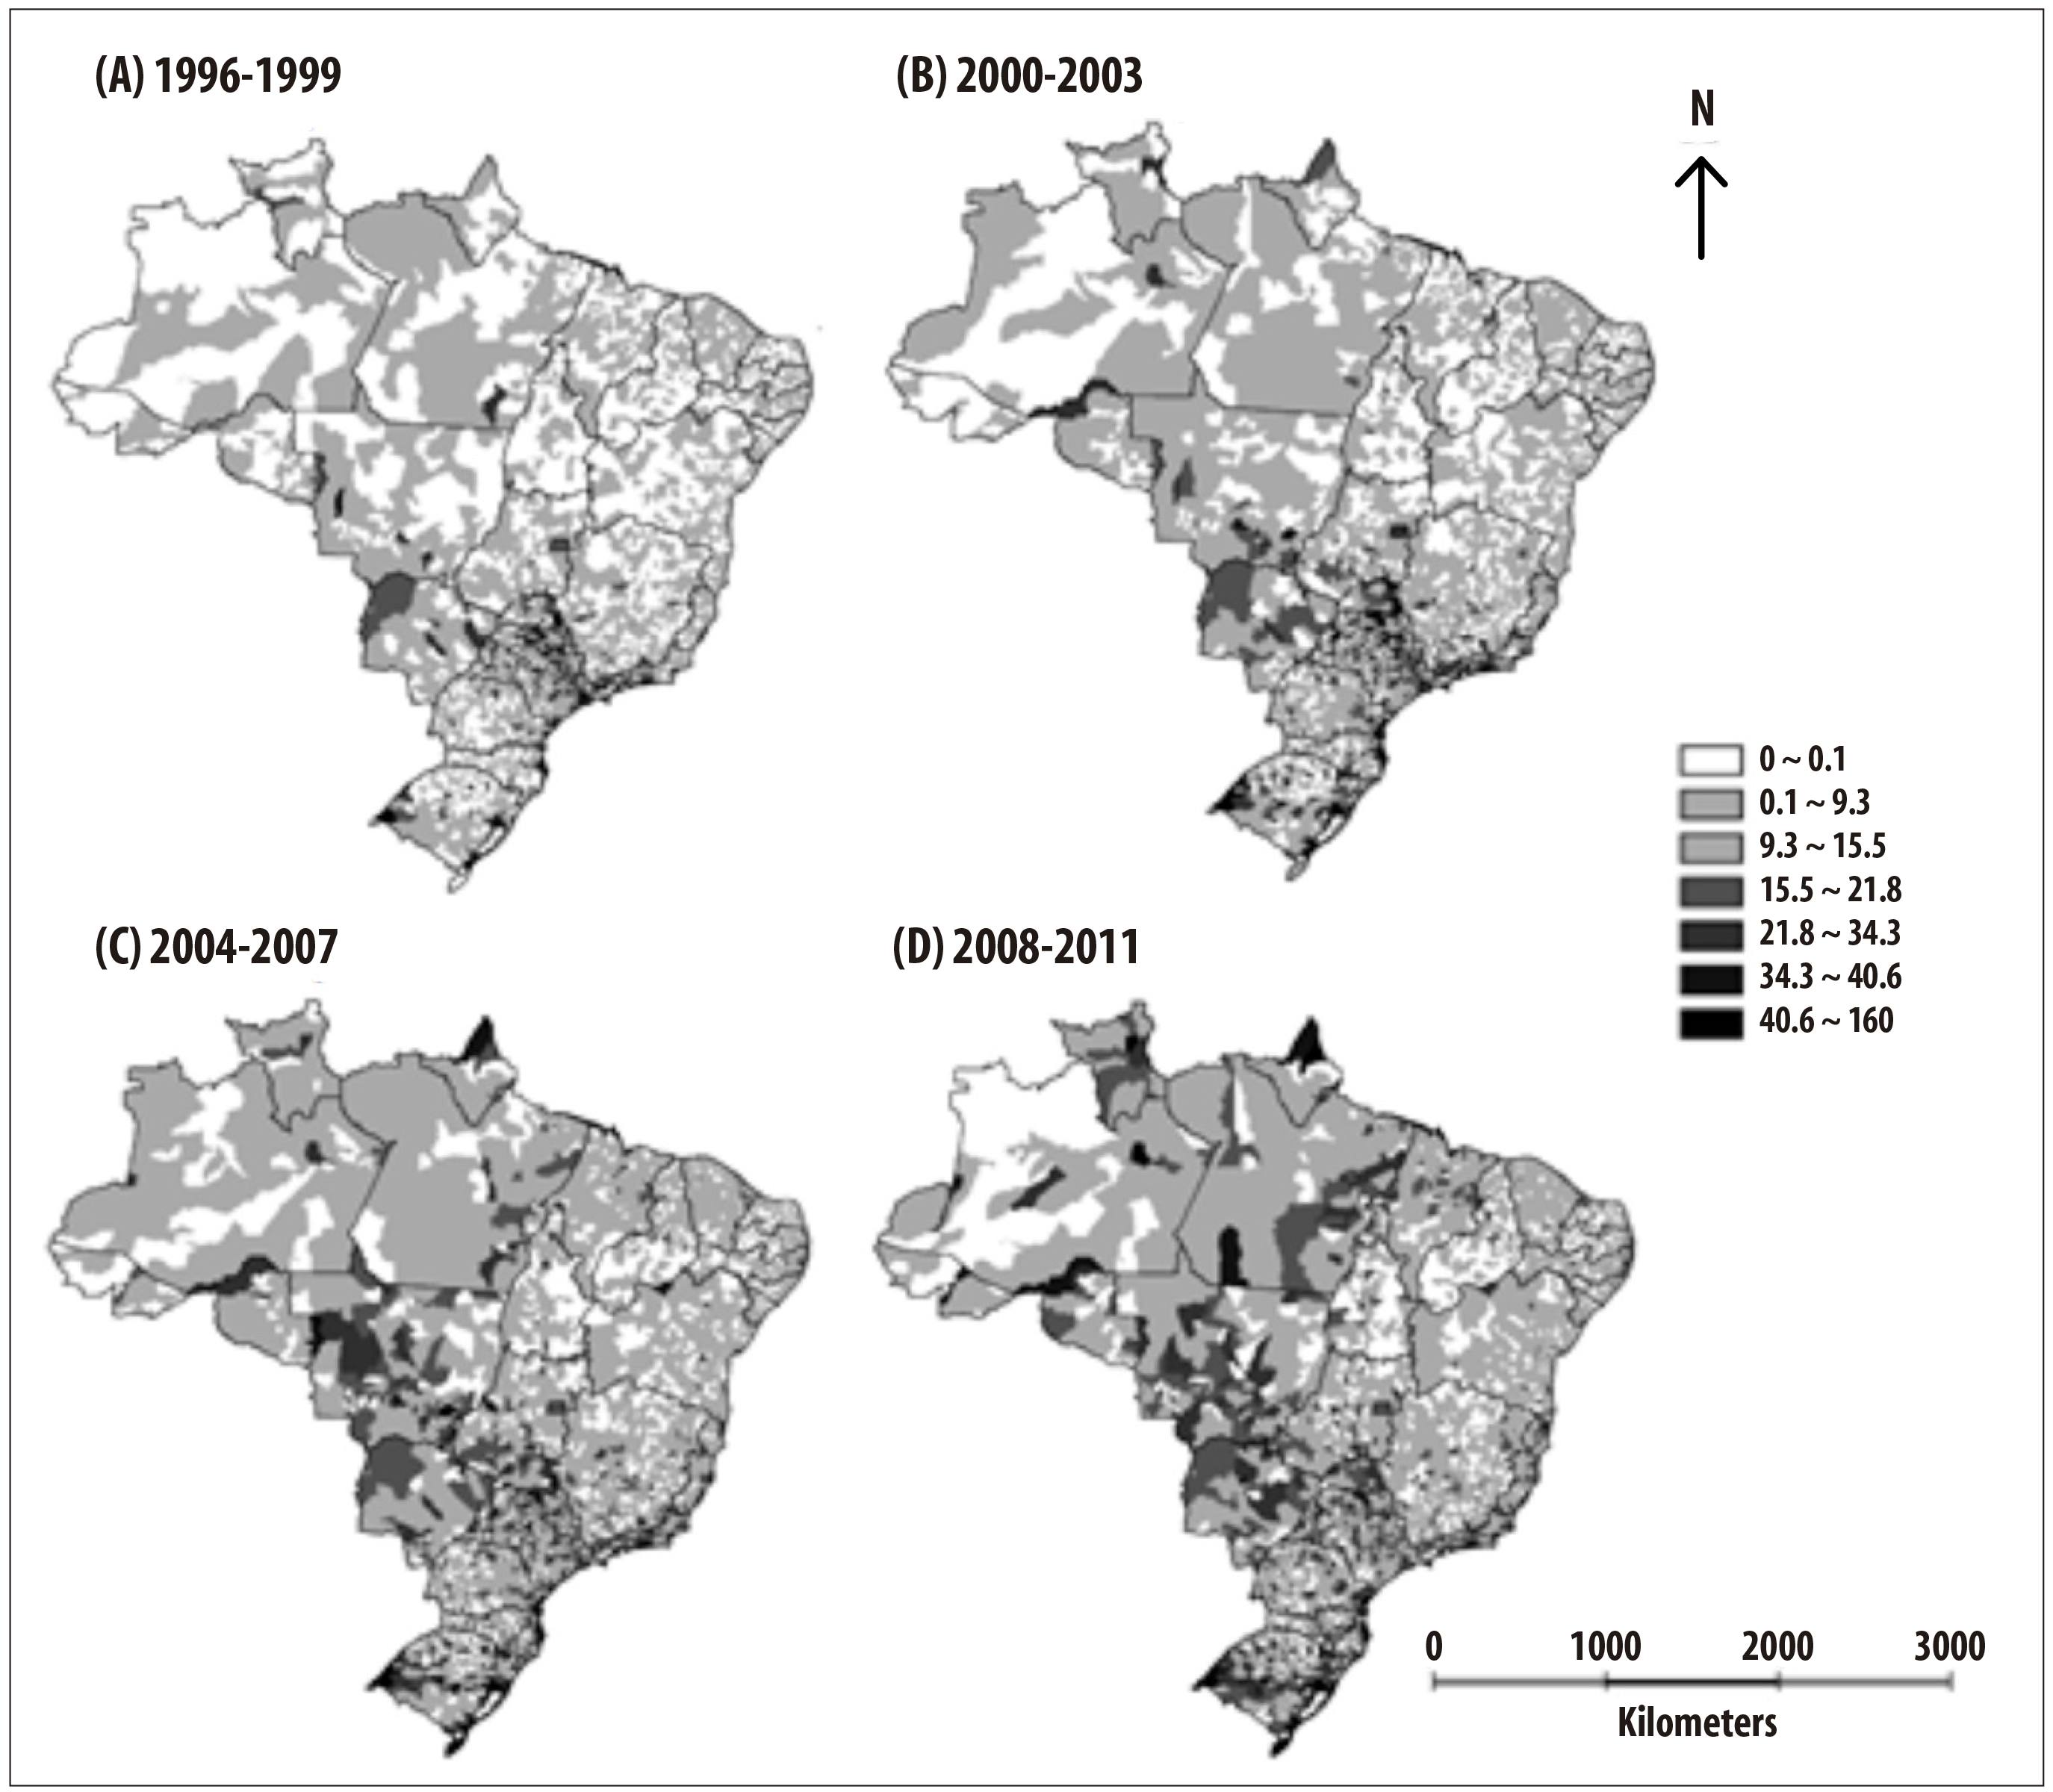
Figure 1 - Average AIDS incidence rate (per 100,000 inhabitants) according to municipality of residence, Brazil, 1996-2011
In the period 1996-1999, the highest average incidence rates per municipality (Figure 1) were found in the cities of São Paulo State (Figure 1A). From that period on, the increase in cases was observed throughout the country, with the highest incidence rates - besides São Paulo State - in cities of the states of Rio de Janeiro, Mato Grosso do Sul and Mato Grosso, and in the South region (Figure 1D).
With regard to Kernel estimator of average incidence rates for the years 2000-2003, it was found moderate density in the Southeast and South regions of the country (Figure 2). At the same period, in these regions, there was a higher density in the Curitiba-Vale do Itajaí-Florianópolis-Porto Alegre area, and in the areas of São Paulo, Campinas and Ribeirão Preto cities (Figure 2B). Also in the same period, it was possible to see other areas with increased risk and moderate density, such as the city of Belo Horizonte, Rio de Janeiro State and the area Recife-João Pessoa (Figure 2B).
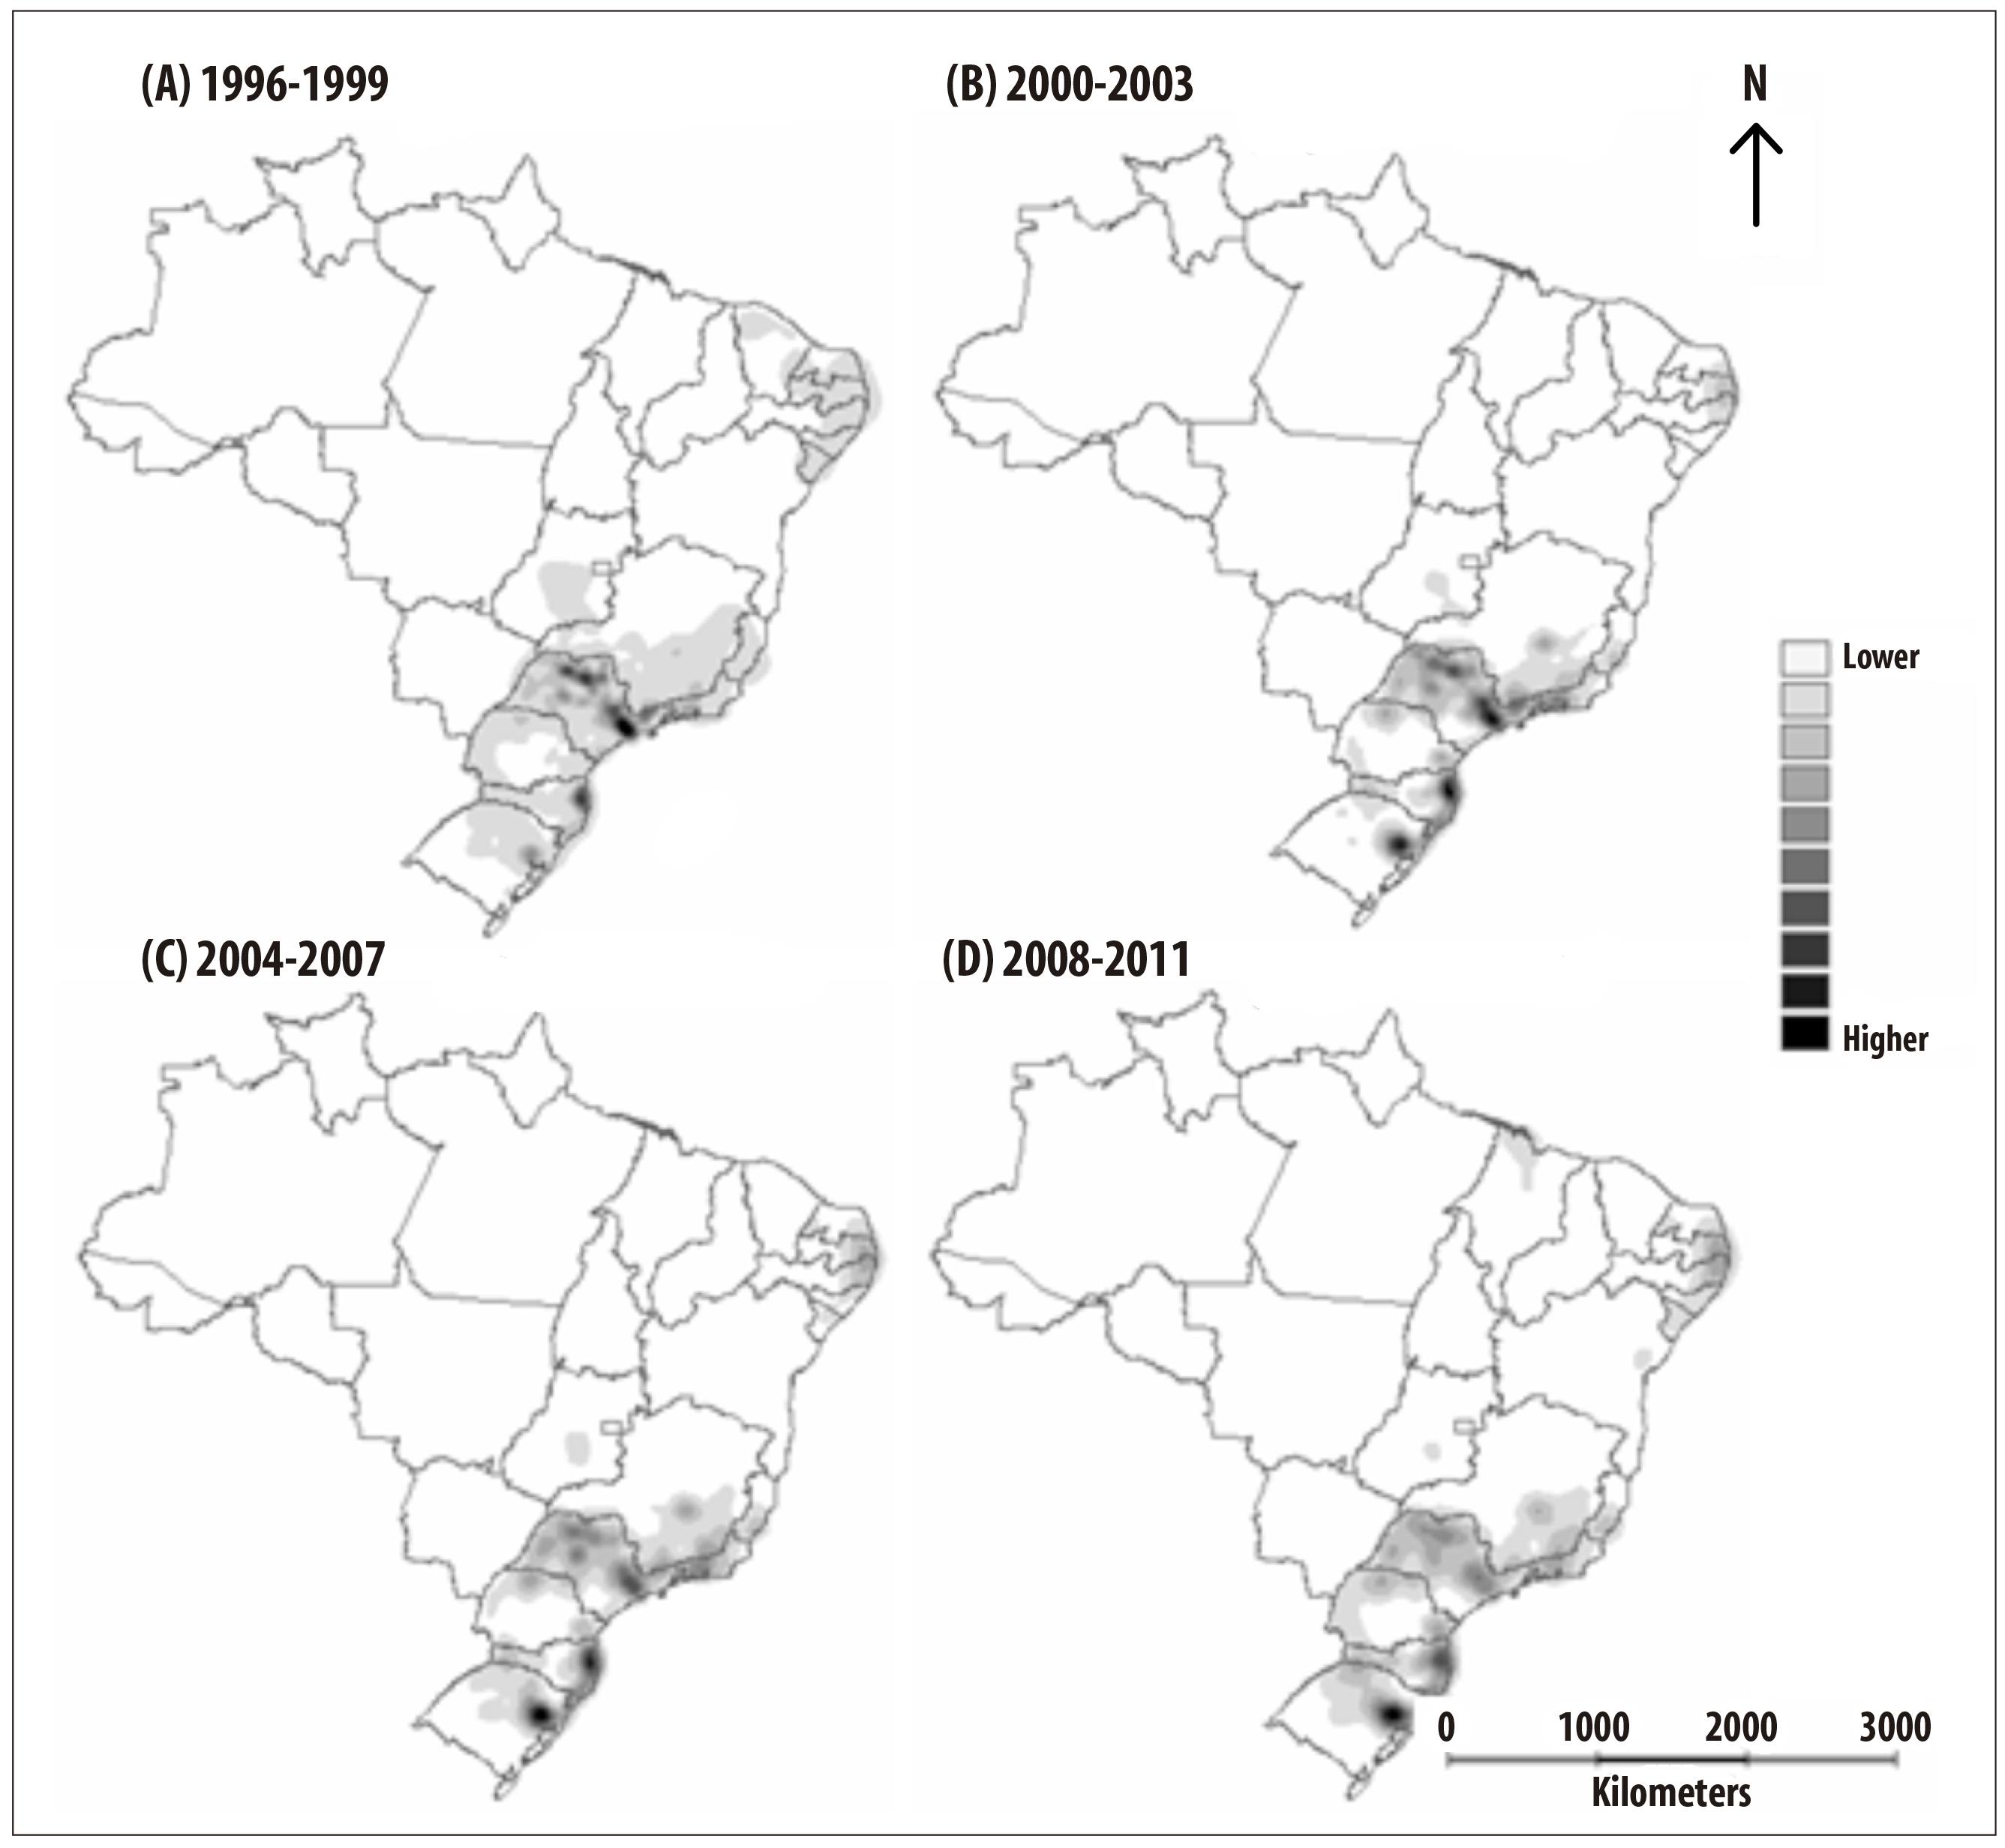
Figure 2 - Surface density of average AIDS incidence rate (per 100,000 inhabitants) by Kernel method, Brazil, 1996-2011
In the period 2004-2007, there was a reduction in the intensity and influence range of São Paulo, Campinas and Ribeirão Preto, and in their respective neighborhoods, compared with the period 2000-2003 (Figure 2). However, the emergence of regions with medium density was discovered in the Midwestern of São Paulo State and in Curitiba-Vale do Itajaí-Florianópolis area, since they showed high density in 2000-2003, and low intensity in 2004-2007. In the same period of 2004-2007, the regions of the cities of Porto Alegre and Rio de Janeiro kept the high level of intensity, with a small increase in the influence radius (Figure 2C).
In the period 2008-2011, a persistent trend of reduction in the intensity of risk was found in the cities of São Paulo, Campinas and Ribeirão Preto. At the same period, the emergence of areas with medium density was demonstrated in the regions of Belém, São Luís, Maceió, Aracaju and Salvador, and with increased intensity in the area Recife-João Pessoa. There was also a medium intensity emergence in the North of Paraná State and in the Mid-East of Santa Catarina (Figure 2D).
Taking into account the distribution of prevalence of AIDS cases per municipality over the years (Figure 3), the cases had a faster and more specific spreading when compared to the distribution of the average incidence rate. The highest concentration was observed in the Southeast, South and Midwest regions of the country (Figure 3D).
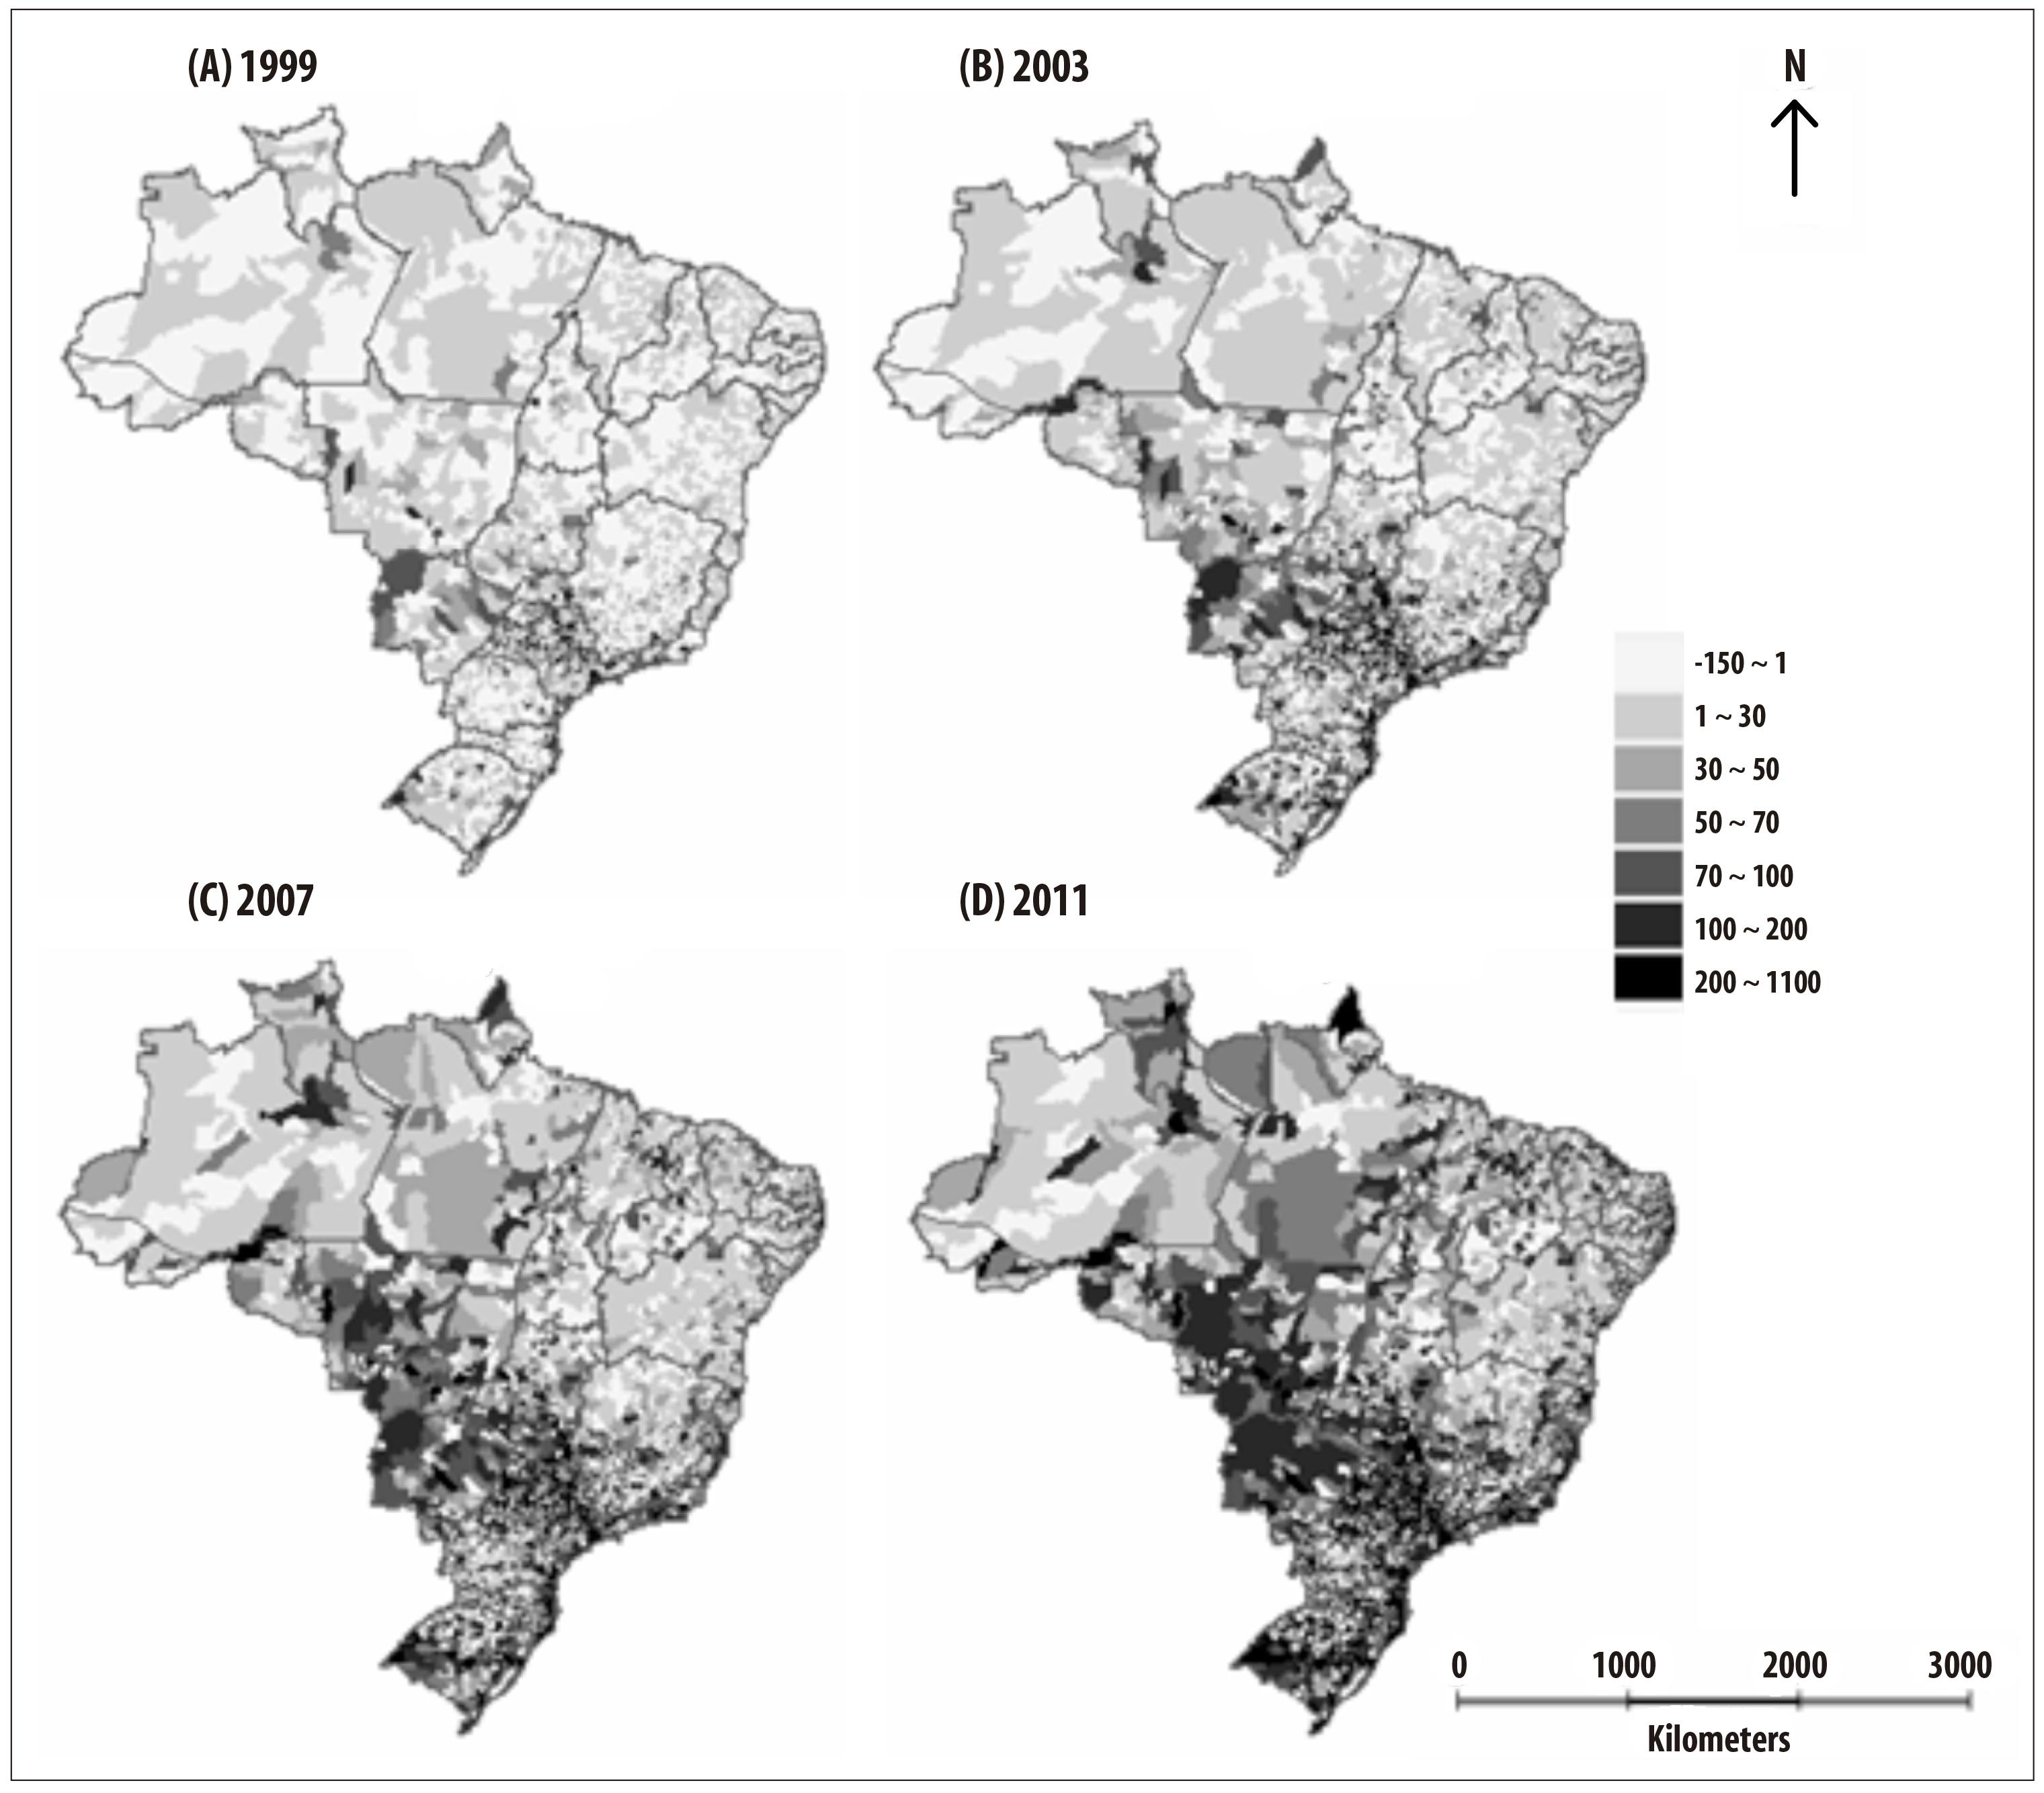
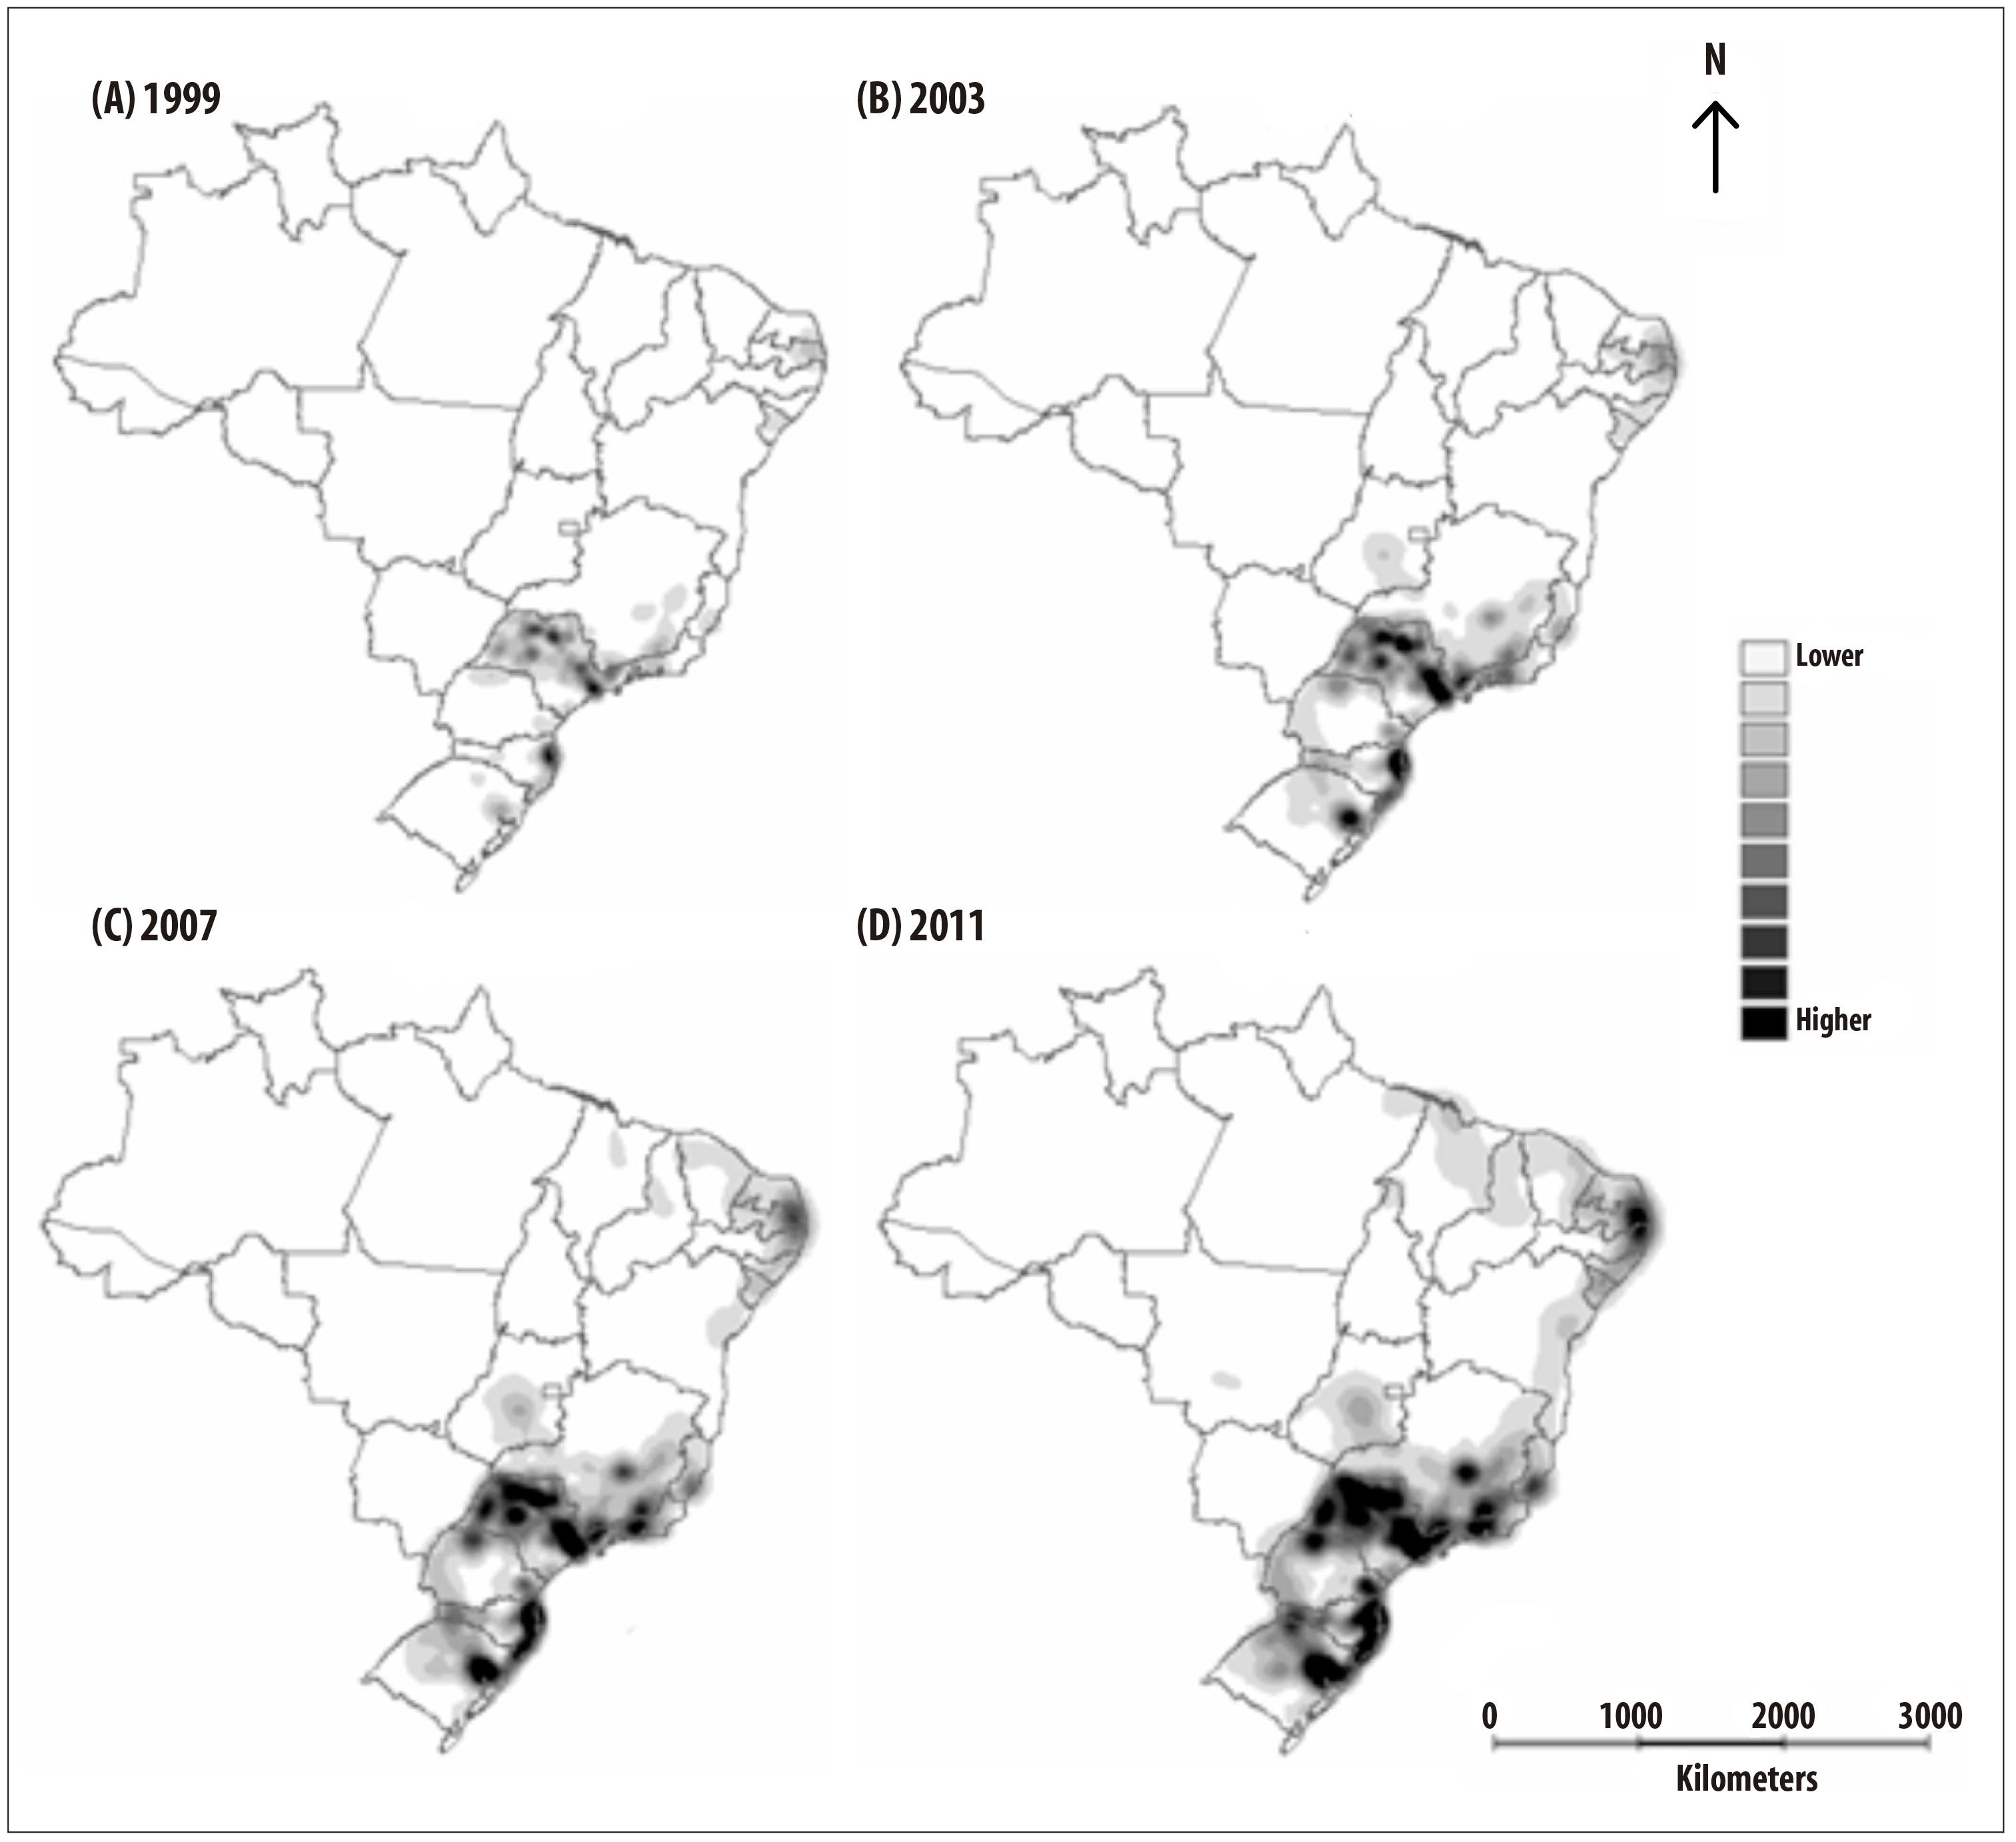
Figure 3 - AIDS prevalence (per 100,000 inhabitants) according to home municipality, Brazil, 1999, 2003, 2007 and 2011
The estimate of the areas with the highest prevalence of AIDS cases, based on the application of the Kernel method, showed the existence of spatial clusters (Figure 4). A rapid growth took place in 2011, showing high concentrations of the disease in the states of Rio de Janeiro and São Paulo, and in Curitiba-Porto Alegre area. At this period, there was also the development of areas with a medium density in all the Northeast coastal cities, and high density in the region of Recife (Figure 4D).
Discussion
The cumulative distribution of AIDS cases is not equally distributed throughout the Brazilian territory. The highest concentration of cases occur in large urban centers and cities with higher sociodemographic and socioeconomic flow, which is consistent with previous studies.10,11 In this study, the geographical differences found during those periods showed an accelerated increased risk in the states of Rio de Janeiro and São Paulo, and in the Curitiba-Porto Alegre area. Also the emergence of moderate density areas in all of the Northeast coastal cities was observed, with high density in the region of Recife, capital of Pernambuco State. The increased density in the cities of the Northeast is associated with the spread of AIDS in the North and Northeast, noticed in recent years.9 In these regions, the implementation of combined intervention strategies can be effective in preventing HIV.21 This study outcomes reveal the need to expand the integrated analysis of the surveillance information, geographic data, and health care, as recommended by Goswami et al. in 2012.22
The use of the Geographic Information System (GIS) to analyze AIDS incidence and prevalence was found to be appropriate in identifying areas under greatest risk and could be useful in monitoring the disease. However, this method is not very often explored in Brazil.23
During the first reporting period (1996-1999), there was an increase in AIDS incidence and, in other periods, there was certain stability, which could be explained by the HAART universal dispensation and by public policies to control the transmission of HIV.24 The evaluation of AIDS incidence points to a decline in the Southeast and South regions, between 2003 and 2006, and a new increase in the incidence in 2007.9 In addition, with the use of GIS, it was observed that in these regions the cases remained high.
AIDS prevalence showed a persistent increase during the study period, from 1996 to 2011. The analysis using GIS revealed the formation and establishment of new areas of continuous transmission throughout the country. The identification of these areas is of utmost importance for planning and implementing strategic actions to prevent the transmission of HIV, which may contribute to giving a better direction for the actions, especially when such actions depend on limited resources allocated to interventions of Public Health,25 for example, the strategy of increasing treatment coverage in order to lower the community viral load of HIV.26
The use of geoprocessing techniques to provide an overview on the social determinants of health-disease process is still incipient in the analysis of health indicators.23 In this study, it was possible to demonstrate that geoprocessing techniques using maps can be useful to identify the areas with greatest need on expanding programs, such as those directed to the treatment and expansion of health care.27 These techniques contribute to the identification of "hot spots", i.e., places with the highest density of AIDS cases (highlighted in darker colors in the maps), where the risk of HIV transmission is most intense because of prevalent cases. In these areas, the research and monitoring of risk factors for HIV infection should be a priority, in order to implement suitable programs of prevention and control.28 Furthermore, the geoprocessing of epidemiological information may be useful to an efficient allocation of Public Health Care resources.22
Taking into account the dynamic of AIDS transmission,29 which it is not limited to political-administrative boundaries, the risk evaluation using geographic tools may indicate areas with highest density of cases, through a continuum of different layers, beyond the geographical frontiers, borders and boundaries. Spatial distribution of occurrence of cases and distribution of analyzed prevalence by Kernel method show areas with greatest potential for transmission, while the amount of cases directly influences in the occurrence of new cases (person-to-person transmission).
The main limitation of this study is the use of surveillance databases from the Ministry of Health, which considered only advanced cases of disease for notification purposes and may subdivide the risk of HIV/AIDS.
This limitation tends to be overcome, because the Ministry of Health added HIV to the list of notifiable diseases in 2014, regardless of immunological or clinical phase, which will allow a more precise risk evaluation for HIV/AIDS in the near future. Another limitation was the comparison with the occurrence of events in the neighboring municipality, because it could explain better the dynamics of the disease in the municipality where the case was identified. Some authors suggest that the distance between the cities is an explanatory factor of the increase in AIDS cases.30 A third and final limitation is the fact that the Kernel estimator has a subjective analysis: there is no set of standard parameters to rate the intensity of the injury occurrence (areas with higher density versus areas with lower density), depending mainly on previous knowledge on the studied topic.28
The use of techniques to assist epidemiological surveillance, such as georeferencing of data, can bring an important gain in tools and indicators already used in epidemiological studies.12 This study showed that the identification of areas at higher risk - as they contain more cases of AIDS - can support the planning of prevention and control policies based on the risk of disease transmission.
REFERENCES
1. Sepkowitz KA. Aids: the first 20 years. N Engl J Med. 2001 Jun;344(23):1764-72 [ Links ]
2. Killian MS, Levy JA. HIV/AIDS: 30 years of progress and future challenges. Eur J Immunol. 2011 Dec;41(12):3401-11 [ Links ]
3. Souza Júnior PRB, Szwarcwald CL, Barbosa Júnior A, Carvalho MF, Castilho EA. Infecção pelo HIV durante a gestação: Estudo-Sentinela Parturiente, Brasil, 2002. Rev Saude Publica. 2004 dez;38(6):764-72. [ Links ]
4. Ministério da Saúde (BR). Secretaria de Vigilância em Saúde. Programa Nacional de DST e Aids. Pesquisa entre conscritos do exército brasileiro: retratos do comportamento de risco do jovem brasileiro à infecção pelo HIV, 1996-2002. Brasília: Ministério da Saúde; 2006. (Série Estudos Pesquisas e Avaliação;2) [ Links ]
5. Pascom ARP, Arruda MR, Simão MBG, organizadoras. Pesquisa de conhecimentos, atitudes e práticas na população brasileira de 15 a 64 anos 2008. v.1Brasília: Ministério da Saúde; 2011. [ Links ]
6. Programa Conjunto das Nações Unidas sobre HIV/AIDS. Estatísticas [Internet] Brasília: Programa Conjunto das Nações Unidas sobre HIV/AIDS; 2016 [citado 2016 mar 23]. Disponível em: Disponível em: http://unaids.org.br/estatisticas [ Links ]
7. Ministério da Saúde (BR). Secretaria de Vigilância em Saúde. Departamento de DST, Aids e Hepatites Virais. Bol Epidemiol HIV Aids.2013 dez;2(1):1-12. [ Links ]
8. Fleming PL, Wortley PM, Karon JM, DeCock KM, Janssen RS. Tracking the HIV epidemic: current issues, future challenges. Am J Public Health. 2000 Jul;90(7):1037-41. [ Links ]
9. Teixeira TRA, Gracie R, Malta MS, Bastos FI. Social geography of AIDS in Brazil: identifying patterns of regional inequalities. Cad Saude Publica. 2014 fev; 30(2):259-71 [ Links ]
10. Dias PRTP, Nobre FF. Análise dos padrões de difusão espacial dos casos de AIDS por estados brasileiros. Cad Saude Publica. 2001 set-out;17(5):1173-87. [ Links ]
11. Bastos FI, Nunn A, Hacker MA, Malta M, Szwarcwald CL. AIDS in Brazil: the challenge and the response. In: Celentano DD, Beyrer C, editors. Public health aspects of HIV/AIDS in low and middle income countries. New York: Springer Science; 2008. p. 629-54. [ Links ]
12. Stephan C, Henn CA, Donalisio MR. Expressão geográfica da epidemia de Aids em Campinas, São Paulo, de 1980 a 2005. Rev Saude Publica. 2010 out;44(5):812-9. [ Links ]
13. Ministério da Saúde (BR). Fundação Oswaldo Cruz. Abordagens espaciais na saúde pública.v.1. Brasília: Ministério da Saúde ; 2006. (Série B. Textos Básicos de Saúde); (Série: Capacitação e atualização em geoprocessamento em saúde;1) [ Links ]
14. Costa MCN, Teixeira MGLC. A concepção de "espaço" na investigação epidemiológica. Cad Saude Publica. 1999 abr-jun;15(2):271-9 [ Links ]
15. Bonfim C, Medeiros Z. Epidemiologia e geografia: dos primórdios ao geoprocessamento. Espac Saude. 2008 dez;10(1):53-62 [ Links ]
16. Medronho RA. Geoprocessamento e saúde: uma nova abordagem do espaço no processo saúde doença. Rio de Janeiro: Centro de Informação em Ciência e Tecnologia; 1995. (Política de Saúde; 15). [ Links ]
17. Ministério da Saúde (BR). Secretaria de Vigilância em Saúde. Programa Nacional de DST e Aids. Critérios de definição de casos de aids em adultos e crianças. Brasília: Ministério da Saúde; 2003.(Série Manuais; 60) [ Links ]
18. Instituto Brasileiro de Geografia e Estatística [Internet]. Censos demográficos e projeções intercensitárias. Rio de Janeiro: Instituto Brasileiro de Geografia e Estatística; 2016 [citado 2016 mar 23]. Disponível em: http://www.ibge.gov.br/home/ [ Links ]
19. Câmara G, Carvalho MS. Análise espacial de eventos. In: Druck S, Carvalho MS, Câmara G, Monteiro AMV, editores. Análise espacial de dados geográficos. Brasília: Embrapa; 2004. [ Links ]
20. Bailey TC, Gatrell AC. Interactive spatial data analysis. Essex: Longman; 1995. [ Links ]
21. Marshall BD, Paczkowski MM, Seemann L, Tempalski B, Pouget ER, Galea S, et al. A complex systems approach to evaluate HIV prevention in metropolitan areas: preliminary implications for combination intervention strategies. PLoS One. 2012 Sep;7(9):e44833. [ Links ]
22. Goswami ND, Hecker EJ, Vickery C, Ahearn MA, Cox GM, Holland DP, et al. Geographic information system-based screening for TB, HIV, and syphilis (GIS-THIS): a cross-sectional study. PLoS One. 2012 Oct;7(10): e46029. [ Links ]
23. Brunello MEF, Chiaravalloti Neto F, Arcêncio RA, Andrade RLP, Magnabosco GT, Villa TCS. Áreas de vulnerabilidade para co-infecção HIV-aids/TB em Ribeirão Preto, SP. Rev Saude Publica 2011 jun;45(3):556-63. [ Links ]
24. Ministério da Saúde (BR). Departamento de DST, Aids e Hepatites Virais [Internet]. Brasília: Ministério da Saúde; 2016 [citado 2016 mar 23]. Disponível em: Disponível em: http://www.aids.gov.br [ Links ]
25. Ngianga-Bakwin K, Campbell EK, Rakgoasi SD, Madi-Segwagwe BC, Fako TT. The geography of HIV/AIDS prevalence rates in Botswana. HIV AIDS (Auckl). 2012;4:95-102 [ Links ]
26. Szwarcwald CL, Souza Júnior PRB. Estimation of HIV Incidence in Brazil, 2004-2011. Sex Transm Infect. 2013;89 Suppl 1:A211 [ Links ]
27. Coburn BJ, Okano JT, Blower S. Current drivers and geographic patterns of HIV in Lesotho: implications for treatment and prevention in Sub-Saharan Africa. BMC Med. 2013 Oct;11:224. [ Links ]
28. Souza-Santos R, Carvalho MS. Análise da distribuição espacial de larvas de Aedes aegypti na Ilha do Governador, Rio de Janeiro, Brasil. Cad Saude Publica. 2000 jan-mar;16(1):31-42 [ Links ]
29. Pascom ARP, Ferraz DAS, Arruda MR, Brito I. Conhecimento e práticas sexuais de risco associados ao HIV na população brasileira de 15 a 64 anos, 2008. Tempus Actas de Saude Colet. 2010;4(2):101-12. [ Links ]
30. Zulu LC, Kalipeni E, Johannes E. Analyzing spatial clustering and the spatiotemporal nature and trends of HIV/AIDS prevalence using GIS: the case of Malawi, 1994-2010. BMC Infect Dis. 2014 May;14:285. [ Links ]
*Manuscript based on Artur Iuri Alves de Sousa's Master's thesis, defended at the Postgraduate Program in Tropical Medicine of Tropical Medicine Center of the University of Brasilia, on 2004. The main author had a scholarship of the Master Social Demand Program from the Coordination for the Improvement of Higher Education Personnel - the CAPES Foundation/Ministry of Education (code: 53001010015P0).
Received: September 15, 2015; Accepted: February 29, 2016
 Este é um artigo publicado em acesso aberto sob uma licença Creative Commons
