


Serviços Personalizados
Journal

Artigo
 texto em
  Inglês (pdf)
 Artigo em XML
 Referências do artigo
 Enviar este artigo por email
Indicadores
-
 Citado por SciELO
Links relacionados
-
 Similares em
SciELO
Similares em
SciELO
Compartilhar

 Permalink
Epidemiologia e Serviços de Saúde
versão impressa ISSN 1679-4974versão On-line ISSN 2337-9622
Epidemiol. Serv. Saúde v.25 n.4 Brasília out./dez. 2016
http://dx.doi.org/10.5123/S1679-49742016000400008
ORIGINAL ARTICLE
Classification of transmission risk of vaccine-preventable diseases based on vaccination indicators in Brazilian municipalities
1Ministério da Saúde, Secretaria de Vigilância em Saúde, Brasília-DF, Brasil
2Universidade de São Paulo, Instituto de Medicina Tropical de São Paulo, São Paulo-SP, Brasil
OBJECTIVE:
to describe the transmission risk classification of vaccine-preventable diseases in Brazilian municipalities.
METHODS:
this was a descriptive epidemiologic study using 2014 data of the Brazilian National Immunization Program Information System; the vaccine coverage indicators were used to classify the transmission risk of vaccine-preventable diseases in the municipalities.
RESULTS:
of the 5,570 Brazilian municipalities, 12.0% were classified as very low risk, 29.6% as low risk, 2.2% as medium risk, 54.3% as high risk and 1.8% as very high risk.
CONCLUSION:
the vaccination coverage surveillance allowed to identify most of the municipalities in high risk situation and the minority of children living in municipalities with appropriate coverage; the vaccination coverage surveillance using indicators of the Brazilian National Health System (SUS) is a new tool for identifying priority areas where the actions can be more successful for health managers and improve the quality and the success of the immunizations program.
Key words: Immunization Coverage; Surveillance; Monitoring; Risk Management; Epidemiology, Descriptive
Introduction
Vaccination has contributed to the achievement of positive results in Brazilian Public Health, such as the elimination of polio, the interruption of measles and rubella transmission, the intense reduction in the incidence of diphtheria, whooping cough (pertussis) and meningitis caused by Haemophilus influenzae type B,1 tetanus and tuberculosis in individuals under 15 years old; besides achieving a significant reduction in infant mortality.2 Furthermore, we should mention the elimination of yellow fever in urban areas and the eradication of smallpox.3 There was a decrease in hospitalization and mortality rates due to vaccine-preventable diseases4 in Brazil and other countries as well.5 The National Immunization Program (NIP) is considered to be the most successful public health intervention in Brazil.6
The Information System of the National Immunization Program (IS-NIP) enables the estimation of vaccine coverage and its homogeneity among the vaccines and among the municipalities of the country, with good acceptability and representativeness7. Despite the adequate coverage at the national and state levels, the coverage is heterogeneus at the municipal level, which present lower rates among higher and lower socioeconomic groups.8 Thus, vaccination does not reach the entire target population.9,10 Low coverage may be related to knowledge, attitude and practices on vaccination actions.11 This situation requires particular attention on a local level, since polio and measles, for example, continue to be health problems in countries from Asia, Central Africa and Middle East,12 countries which have commercial and tourist exchange with Brazil.
The World Health Organization (WHO) recommends a minimum of 95% immunization coverage to maintain the eradication, elimination or control of vaccine-preventable diseases, as well as indicators such as the proportion of municipalities with adequate vaccination coverage and the proportion of children living in municipalities with adequate vaccine coverage.13 Brazil also adopts the homogeneity of coverage, which is measured by the proportion of vaccines whose coverage target were achieved in each municipality.14 These indicators must be accompanied by a surveillance system of transmission risk of vaccine-preventable diseases in municipalities and in areas with the presence of susceptible population, a typical characteristic of situations that deserve timely intervention.15 The surveillance system should ensure (i) adequate coverage, averting unnecessary diseases and death,16 (ii) reminders to encourage attendance to scheduled vaccinations and (iii) calls for updating late vaccines.17
Efforts have been undertaken to obtain reliable information to monitor immunization programs.18 The administrative method provides cheaper and timely routine data, while household surveys are the only source to find real vaccine coverage estimates,19 although they are time consuming and costly. Both methods are used in Brazil, however, the systematic risk monitoring has not been fully implemented, although the indicators of coverage and homogeneity have been covenanted in the Brazilian National Health System (SUS).20,21
This study aimed to describe the classification of transmission risk of vaccine-preventable diseases in Brazilian municipalities.
Methods
This is a descriptive epidemiological study with secondary data on the vaccine coverage of ten vaccines administered in 2014 to infants under two years old residing in one of the 5,570 Brazilian municipalities. The vaccines studied are: (i) Bacille Calmette-Guerin (BCG); (ii) yellow fever (YF); (iii) hepatitis A (HepA); (iv) meningococcal C conjugate (Men-C); (v) diphtheria, tetanus, pertussis, hepatitis B, and haemophilus influenzae type B (pentavalent); (vi) 10-valent pneumococcal conjugate (PCV-10); (vii) inactivated poliovirus (IPV)/ attenuated oral poliovirus (OPV) (poliomyelitis); (viii) measles, mumps and rubella (MMR); (ix) attenuated measles, mumps, rubella and varicella (MMRV); and (x) human rotavirus (RV).
The vaccination status was verified using vaccination coverage indicators (VC) and homogeneity of vaccine coverage among the vaccines in the municipality (HVC), both covenanted on SUS through the Organizational Agreement of Public Health Action (COAP)20 and Qualification Program of Surveillance Actions in Health (PQAVS).21 We also assessed the dropout proportion (DP), the proportion of infants under two years old living in municipalities with adequate vaccination coverage (AVC) and transmission risk of vaccine-preventable diseases per municipality (TRVPD).
With regard to coverage indicators, the NIP set a target of 90% for BCG and RV vaccines, 95% for pentavalent, polio, PCV-10, Men-C, MMR, MMRV and HepA, and 100% for YF. The numerator to calculate vaccine coverage was the total doses to complete the schedule of each vaccine, and the denominator was the number of live births in the given municipality recorded on the Information System on Live Births (SINASC) for the year 2012 - used to estimate infants under one and two years old. The vaccination coverage was obtained from IS-NPI website: http://pni.datasus.gov.br.
Two stages of analyses were established: (I) categorization of VC, DP and HVC indicators and (II) classification of the transmission risk of vaccine-preventable diseases in the municipalities. The VC was classified as low (<target); adequate (≥target to ≤120%); and high (>120%). With regard to homogeneity, the COAP determined that a municipality must achieve the vaccine target of 75% or more, whilst in PQAVS, this proportion was set at 100%. The HVC was divided into three categories: low (<75%); suitable for COAP (≥75%); and suitable for PQAVS (=100%). In the 3,527 municipalities with yellow fever vaccine recommendation (recommended vaccination areas - RVA), ten vaccines were considered; in the other municipalities of the country, nine were considered. The dropout proportion - obtained from http://tabnet.datasus.gov.br - was calculated only for multi-dose vaccines (Men-C, Pentavalent, PCV-10, Polio, RV), considering the difference between the number of first dose given and of last dose divided by the number of doses, multiplying the result by 100. The result was divided into three categories: low (<5%); average (≥5% and ≤10%); and high (>10%). For the proportion of infants under two years old in municipalities with adequate vaccination coverage, the numerator was constituted by the population of infants (under two years) from municipalities with HVC according to COAP and PQAVS; and the denominator was the total number of infants in that age group in each municipality. The municipalities were classified according to their population size, adapted from PQAVS referential: small (≤20.000 inhabitants); medium (≥20.001 to ≤100.000 inhabitants); and large (≥100.001 inhabitants).
The risk of transmission of vaccine-preventable diseases in a municipality was constituted by immunization coverage indicators, homogeneity of vaccine coverage among vaccines in the municipality, dropout proportion and population size of the municipality, defined in five categories:
very low risk - municipality with HVC=100%;
low risk - municipality with HVC≥75% to <100% with adequate VC for polio, MMR and MMRV, which prevent diseases eliminated or in process of elimination (poliomyelitis, measles and rubella), and also the pentavalent vaccine due to its diphtheria-tetanus-pertussis (DPT) component - regarded as the vaccination service quality determiner because of its three injectable doses schedule in infants up to six months old;
average risk - municipality with HVC ≥75% to <100%, but with vaccination coverage below the target for one or more of these vaccines: polio, MMR, MMRV or pentavalent;
high risk - municipality with HVC <75%; and
very high risk - municipality with a large population, HVC <75% and high DP (≥10%) - municipalities without vaccination records, regardless of population size, are included in this group.
Epi Info 2000 version 3.5.1. program (Centers for Disease Control and Prevention, Atlanta, USA, 2008) was used for automated processing and data analysis. The study met the ethical considerations set out in the Resolution of the National Health Council (CNS) No. 466, dated December 12, 2012, not requiring prior approval by a committee of ethics in research, since it only used secondary data.
Results
In 2014, 54.2% of the Brazilian municipalities reached the VC target for BCG vaccine, 39.6% for YF, 66.8% for HepA, 62.2% for Men-C, 60.9% for pentavalent, 58.2% for PCV-10, 60.9% for polio, 32.4% for MMRV, 77.3% for MMR and 67.7% for RV. The BCG, yellow fever and MMRV vaccines had higher percentages of municipalities with low and very low coverage (Figure 1). There were 409 municipalities with vaccination coverage equal to zero. There was no data of vaccination coverage for five municipalities: Mojuí dos Campos (Pará State), Paraíso das Águas (Mato Grosso do Sul State), Pinto Bandeira (Rio Grande do Sul State), Balneário Rincão and Pescaria Brava (Santa Catarina State). Excluding the vaccination coverage equal to zero, the remaining coverage ranged from 0.1% for YF to 3,240.0% for hepA. In the states, coverage ranged from 19.6% for YF in São Paulo to 166.0% for hepA in Espiríto Santo. Nationwide, the lowest coverage was of 46.7% for YF, and the highest was of 120.3% for hepA; from the ten vaccines assessed six of them achieved adequate coverage.

Figure 1 - Distribution of municipalities (N and %) according to coverage classification of ten vaccines. Brazil, 2014
The homogeneity was adequate for PQAVS in 667 (12.0%) municipalities. In 1,775 (31.9%) municipalities, homogeneity met COAP requirements. In 2,801 (50.3%) municipalities it was low or very low, and in 327 (5.9%) it was equal to zero. The state of Mato Grosso do Sul reached 54.4% of municipalities with homogeneous coverage of vaccines, by the criterion of PQAVS, whilst the State of Rondônia had 61.5% of municipalities with coverage homogeneity according to COAP (Table 1).
Table 1 - Distribution of municipalities per state (N and %), according to the category of vaccine homogeneity of vaccine coverage, Brazil, 2014

a) COAP: Organizational Agreement of Public Health Action
b) PQAVS: Qualification Program of Surveillance Actions in Health
Of the 2,902,041 infants under two years old, 14.9% lived in small-sized municipalities (70.2% of all municipalities), 28.3% in medium-sized municipalities (24.6% of municipalities) and 56.8% lived in large-sized municipalities (5.2% of the municipalities). It was observed that 29.5% of the target population lived in municipalities with adequate homogeneity coverage according to COAP and 7.3% with adequate homogeneity coverage according to PQAVS (Table 2).
Table 2 - Distribution of the population of infants under two years living in municipalities with homogeneity of coverage - adequate or not - among vaccines in Brazilian states. Brazil, 2014.
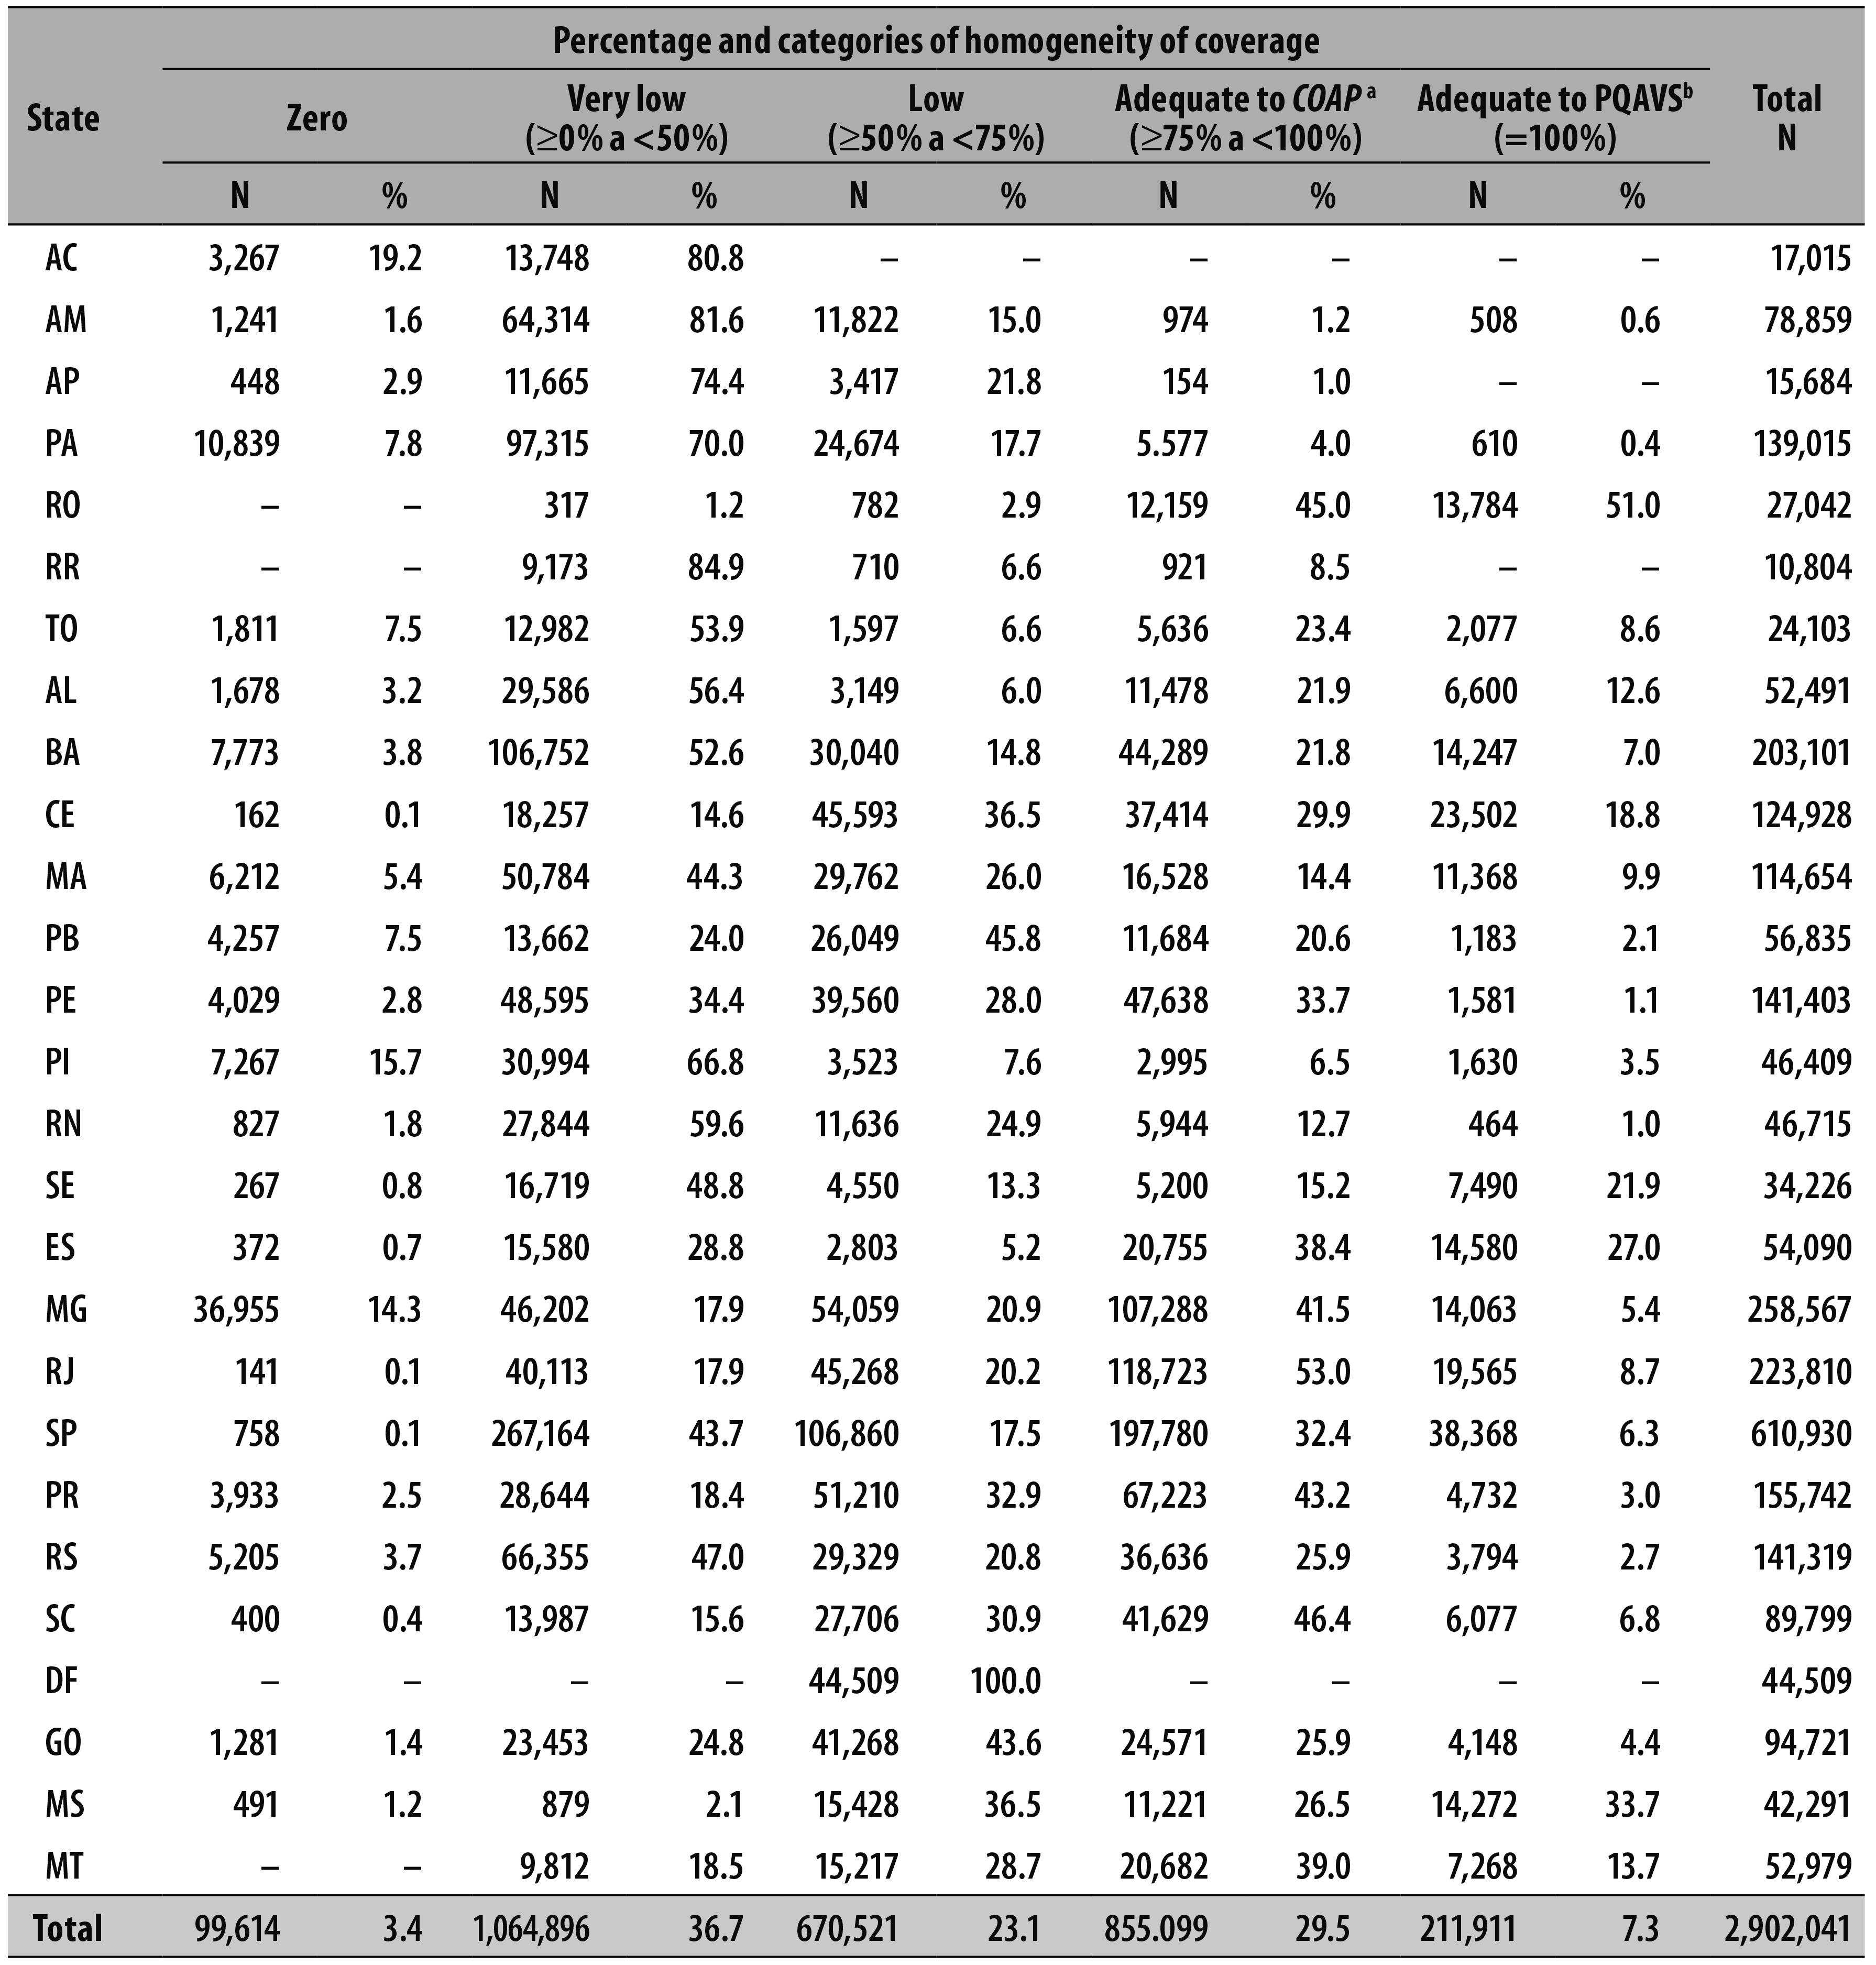
a) COAP: Organizational Agreement of Public Health Action
b) PQAVS: Qualification Program of Surveillance Actions in Health
The percentage of municipalities with low dropout proportion ranged from 41.7% for polio to 62.9% for men-C. Polio vaccine also had the highest percentage of municipalities with high dropout proportion (39.6%); the lowest dropout proportion (18.9%) was for men-C (Figure 2). The dropout proportion ranged from -543.4% (negative) for men-C to 100.0% (positive) for PCV-10.

Figure 2 - Municipalities' distribution according to classification of dropout proportion for five vaccines. Brazil, 2014
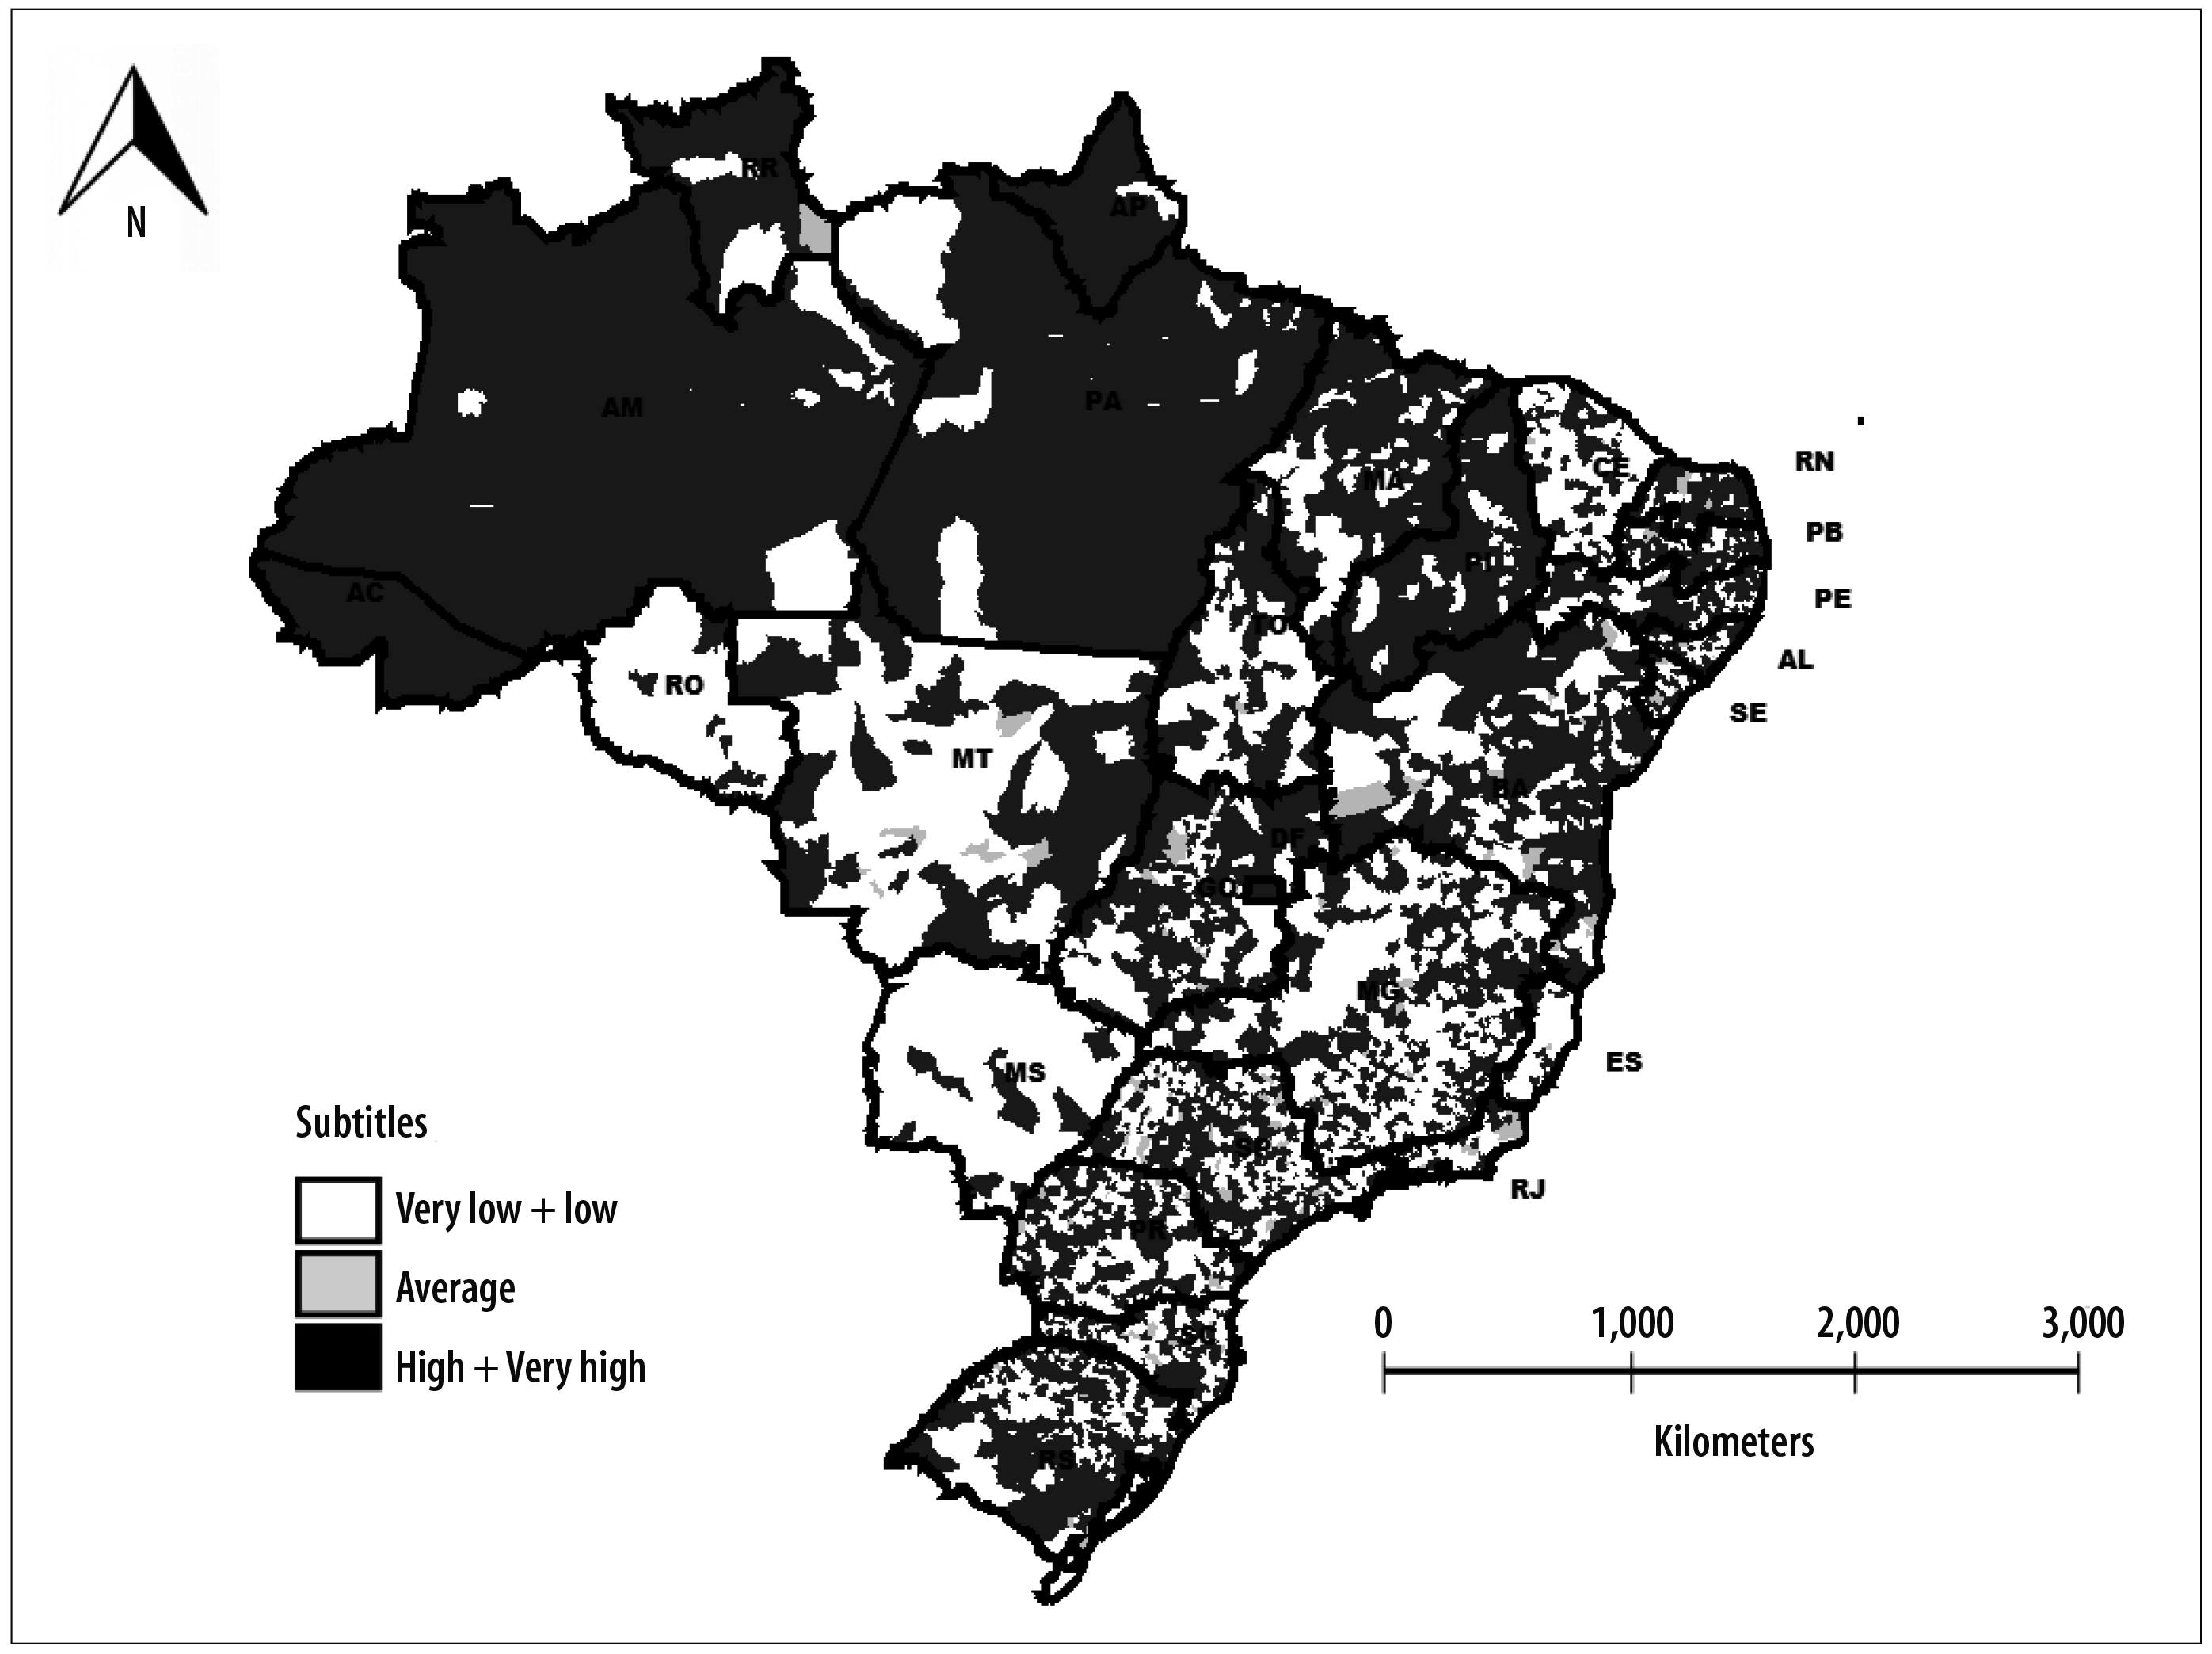
The indicator of transmission risk of vaccine-preventable diseases detected two main groups: the first group - low-risk - corresponded to 1,650 (29.6%) municipalities; the second group - high risk - corresponded to 3,027 (54.3%) municipalities. In the very low risk group, there were 667 (12.0%) municipalities. In the medium-risk group there were 125 (2.2%) municipalities, whilst in the very high-risk group there were 101 (1.8%) municipalities. Municipalities with small populations were predominant in low risk groups, ranging from 68.2% in the low risk group to 73.6% in the medium risk group. In the very high-risk group, municipalities with large population (95.0%) were predominant, as expected. Spatial analysis of the transmission risk of vaccine-preventable diseases identified that municipalities with very low risk and very high risk were distributed in all Brazilian states. However, there was a higher concentration of municipalities with high risk and very high risk in the states of Acre, Amazonas, Amapá, Pará, Piauí and Roraima (Figure 3).
Discussion
Achieving vaccination coverage target in the municipalities is probably NIP's biggest challenge. This study showed that many municipalities have not achieved adequate coverage, particularly for MMRV, YF and BCG vaccines. In some municipalities, BCG is administered in hospitals right after the child's birth, leading to a high coverage, unlike some which do not offer this vaccine in maternity wards. There was a large proportion of municipalities with high dropout for some vaccines, which corroborates with other studies.22 The classification of immunization coverage and dropout proportions were similar to those observed in a research about vaccination in Brazil.4 Homogeneity followed SUS's standards;20,21 however, these standards can change depending on the needs of health managers, requiring surveillance adaptation to new indicators whenever is necessary.
The joint analysis of immunization coverage, homogeneity and dropout proportion has enabled better understanding of the transmission risk of vaccine-preventable diseases in Brazilian municipalities, providing a new tool for the managers to address appropriate actions in places where the vaccination situation is weaker, as other authors have been defending,23 in response to threats of epidemics and emergence of vaccine-preventable diseases. The five risk categories will enable more options to prioritize actions, due to a large number of high-risk municipalities. Later, this categorization may be reduced to three levels - low, medium and high risk - according to a previous study, in which each priority has received several hierarchy levels:16 the difference between that and this present study is the absence of hierarchy priorities in this latter and the automated processing of indicators, which enabled a rapid development of a report to monitor the vaccination situation in the municipalities.
This present study identified: most municipalities with a high risk of vaccine-preventable diseases; atypical vaccination coverage (too low, or too high) in some municipalities possibly due to record duplication of doses given; underestimation of the population or lack of vaccinated individuals records according to place of residence; fluctuation in the negative dropout proportions due to a higher number of vaccinated individuals with the last dose compared to those vaccinated with the first dose of the schedule, and also complete abandonment of the proper vaccination schedule; municipalities with homogeneity equal to zero and several with very low homogeneity; a minority of children living in municipalities with adequate coverage of homogeneity; and lack of information on vaccination in some municipalities. This situation has highlighted two fundamental questions.
The first question refers to possible inconsistencies in data from IS-NIP due to record - in some municipalities - of aggregated data by place of occurrence (rather than the record of individual data according to the residence of the vaccinated individual). These data can distort the indicators of vaccination coverage and dropout proportions, interfering in the risk indicator. The consistency of the data information system may contribute to the improvement of the coverage, especially to monitor each child, improving the vaccination schedule.24 Invalid vaccination also interferes in the coverage but it can be minimized with a good information system. The deviation of the period for vaccination may lead to low protection against vaccine-preventable diseases or require dosage repetition, causing time, material and financial losses, all of which could be prevented.25 Approaches on the use of information to address actions at a local level have helped to improve vaccine coverage in many countries,26 being essential that municipalities keep vaccination records updated at IS-NIP.
The second question concerns the monitoring of the quality of immunization services. The community's trust in vaccines and immunization service offered must be checked.27 If vaccination seeks only to meet the schedule or to meet imposed situations, it will be disassociated from the care of families with fragile sustainability.28 The integration of the vaccination program actions with the Family Health Strategy can expand their reach in the community, positively impacting the vaccine-prevention actions.29 With increasing credibility, vaccination coverage improves, whilst dropout rates tend to decline.30 Access to services can also affect vaccination coverage, either in terms of areas characterized by violence, either by difficult geographic access as with indigenous areas or agricultural settlements.16 Other aspects to consider are the lack of time availability of the parents to take their children to get the doses and closed health care units.2 Therefore, it is recommended to offer alternative timetables for vaccination.
Coverage surveillance requires analyses and recommendations to managers for corrective actions, prioritizing the municipalities according to the classification of risk situation. Attention should be given to local and national data update on IS-NIP, with vaccination coverage and atypical dropout proportions correction and rapid surveillance coverage, since the risk classification based solely on administrative data may not reflect the actual coverage situation of each vaccine. It is important to include actions and immunization target in the Annual Health Agenda and in the Plurianual Plan (PPA) of states and municipalities to enhance governance on improving coverage. The distribution, storage and qualified administration of vaccine doses may also contribute to the maintenance of adequate vaccination coverage, even in situations where the product is scarce. Finally, it is necessary to know the locals and their problems that demand timely actions.
The risk monitoring of vaccination coverage provides an additional tool for identifying priority areas where action may have greater chances of success by the managers, improving quality and contributing to the success of the National Immunization Program in the municipalities, states, and therefore, in nationwide.
Referências
1. Pinto EF, Matta NE, Da-Cruz AM. Vacinas: progressos e novos desafios para o controle de doenças imunopreveníveis. Acta Biol Colomb. 2011 jul;16(3):197-212. [ Links ]
2. Teixeira AMS, Domingues CMAS. Monitoramento rápido de coberturas vacinais pós-campanhas de vacinação no Brasil: 2008, 2011 e 2012. Epidemiol Serv Saude. 2013 out-dez;22(4):565-78. [ Links ]
3. Ministério da Saúde (BR). Secretaria de Vigilância em Saúde. Departamento de Vigilância das Doenças Transmissíveis. Programa Nacional de Imunizações (PNI): 40 anos. Brasília, Brasil: Ministério da Saúde; 2013. [ Links ]
4. Domingues CMAS, Teixeira AMS. Coberturas vacinais e doenças imunopreveníveis no Brasil no período 1982-2012: avanços e desafios do Programa Nacional de Imunizações. Epidemiol Serv Saude. 2013 jan-mar;22(1):9-27. [ Links ]
5. Whitney CG, Zhou F, Singleton J, Schuchat A. Benefits from immunization during the vaccines for children Program Era - United States, 1994-2013. MMWR. 2014 Apr;63(16):352-5. [ Links ]
6. Reid M, Fleck F. The immunization programme that saved millions of lives. Bull World Health Organ. 2014 May;92(5):314-5. [ Links ]
7. Nóbrega AA, Teixeira AMS, Lanzieri TM. Avaliação do sistema de informação do Programa de Imunizações (SI-API). Cad Saude Coletiva. 2010;18(1):145-53. [ Links ]
8. Barreto ML, Teixeira MG, Bastos FI, Ximenes RAA, Barata RB, Rodrigues LC. Successes and failures in the control of infectious diseases in Brazil: social and environmental context, policies, interventions, and research needs. Lancet. 2011 May;377(9780):1877-89. [ Links ]
9. Andrade MV, Chein F, Souza LR, Puig-Junoy J. Income transfer policies and the impacts on the immunization of children: the Bolsa Família Program. Cad Saude Publica. 2012 Jul;28(7):1347-58. [ Links ]
10. Centro de Estudos Augusto Leopoldo Ayrosa Galvão. Inquérito de cobertura vacinal nas áreas urbanas das capitais, Brasil: cobertura vacinal 2007. São Paulo, Brasil: Centro de Estudos Augusto Leopoldo Ayrosa Galvão; 2007. [ Links ]
11. Rukmanee N, Yimsamran S, Rukmanee P, Thanyavanich N, Maneeboonyang W, Puangsa-art S, et al. Knowledge, attitudes and practices (KAP) regarding influenza A (H1N1) among a population living along Thai-Myanmar border, Ratchaburi province, Thailand. Southeast Asian J Trop Med Public Health. 2014 Jul;45(4):825-33. [ Links ]
12. Gordillo MAM, Cano NB. El camino hacia la erradicación de la poliomielitis a través de la Organización Panamericana de la Salu. Ver Panam Salud Publica. 2014 Sep;36(3):185-92. [ Links ]
13. Dietz V, Venczel L, Izurieta H, Stroh G, Zell ER, Monterroso E, et al. Assessing and monitoring vaccination coverage levels: lessons from the Americas. Rev Panam Salud Publica. 2004 Dec;16(6):432-42. [ Links ]
14. Domingues CMAS, Teixeira AMS, Carvalho SMD. National Immunization Program: vaccination, compliance and pharmacovigilance. Rev Inst Med Trop Sao Paulo. 2012 Oct;54 Suppl 18: S22-7. [ Links ]
15. Zell ER, Ezzati-Rice TM, Battaglia MP, Wright RA. National immunization survey: the methodology of a vaccination surveillance system. Public Health Rep. 2000 Jan-Feb;115(1):65-77. [ Links ]
16. Teixeira AMS, Rocha CMV. Vigilância das coberturas de vacinação: uma metodologia para detecção e intervenção em situações de risco. Epidemiol Serv Saude. 2010 jul-set;19(3):217-26. [ Links ]
17. Luhm KR, Waldman EA. Sistemas informatizados de registro de imunização: uma revisão com enfoque na saúde infantil. Epidemiol Serv Saude.2009 jan-mar;18(1):65-78. [ Links ]
18. Murray CJ, Shengelia B, Gupta N, Moussavi S, Tandon A, Thieren M. Validity of reported vaccination coverage in 45 countries. Lancet.2003 Sep;362(9389):1022-7 [ Links ]
19. World Health Organization. WHO vaccine-preventable diseases: monitoring system: 2010 global summary [Internet]. Genebra: World Health Organization; 2010 [cited 2016 Jun 1]. Avaliable from: Avaliable from: http://whqlibdoc.who.int/hq/2010/WHO_IVB_2010_eng.pdf . [ Links ]
20. Ministério da Saúde (BR). Secretaria de Gestão Estratégica e Participativa. Departamento de Articulação Interfederativa. Cadernos de diretrizes, objetivos, metas e indicadores 2013-2015. 2. ed. Brasília: Ministério da Saúde; 2013. (Série Articulação Interfederativa; v.1). [ Links ]
21. Brasil. Ministério da Saúde. Gabinete do Ministro. Portaria nº 1708, de 16 de março de 2013. Regulamenta o Programa de Qualificação das Ações de Vigilância em Saúde (PQAVS), com a definição de suas diretrizes, financiamento, metodologia de adesão e critérios de avaliação dos Estados, Distrito Federal e Municípios. Diário Oficial da República Federativa do Brasil, Brasília (DF), 2013 ago 19; Seção 1:44. [ Links ]
22. Luhm KR, Cardoso MRA, Waldman EA. Cobertura vicinal em menores de dois anos a partir de registro informatizado de imunização em Curitiba, PR. Rev Saude Publica. 2011 fev;45(1):90-8. [ Links ]
23. Dabbagh A, Eggers R, Cochi S, Dietz V, Strebel P, Cherian T. A new global framework for immunization monitoring and surveillance. Bull World Health Org. 2007 Dec;85(12):901-80. [ Links ]
24. Danovaro-Holliday MC, Ortiz C, Cochi S, Ruiz-Matus C. Electronic immunization registries in Latin America: progress and lessons learned. Rev Panam Salud Publica. 2014 May-Jun;35(5-6):453-7. [ Links ]
25. Akmatov MK, Kimani-Murage E, Pessler F, Guzman CA, Krause G, Kreienbrock L, et al. Evaluation of invalid vaccine doses in 31 countries of the WHO African Region. Vaccine. 2015;33(7):892-901. [ Links ]
26. Vandelaer J, Bilous J, Nshimirimana D. Reaching Every District (RED) approach: a way to improve immunization performance. Bull World Health Org. 2008 Mar;86(3):161-240. [ Links ]
27. World Health Organization. Monitoring the immunization system: Training for mid-level managers (MLM) [Internet]. Geneva: World Health Organization; 2008 [cited 2016 Jun 1]. Available from: Available from: http://www.who.int/immunization/documents/mlm/en/ [ Links ]
28. Figueiredo GLA, Pina JC, Tonete VLP, Lima RAG, Mello DF. Experiências de famílias na imunização de crianças brasileiras menores de dois anos. Rev Latino-Am Enfermagem. 2011 mai-jun;19(3):1-8. [ Links ]
29. Guimarães TMR, Alves JGB, Tavares MMF. Impacto das ações de imunização pelo Programa Saúde da Família na mortalidade infantil por doenças evitáveis em Olinda, Pernambuco, Brasil. Cad Saude Pública. 2009 abr;25(4):868-876. [ Links ]
30. LaFond A, Kanagat N, Steinglass R, Fields R, Sequeira J, Mookherji S. Drivers of routine immunization coverage improvement in Africa: findings from district-level case studies. Health Policy Plan. 2014 Mar;1-11. [ Links ]
Received: March 10, 2016; Accepted: May 17, 2016
 Este é um artigo publicado em acesso aberto sob uma licença Creative Commons
