


Serviços Personalizados
Journal

Artigo
 texto em
  Inglês (pdf)
 Artigo em XML
 Referências do artigo
 Enviar este artigo por email
Indicadores
-
 Citado por SciELO
Links relacionados
-
 Similares em
SciELO
Similares em
SciELO
Compartilhar

 Permalink
Epidemiologia e Serviços de Saúde
versão impressa ISSN 1679-4974versão On-line ISSN 2337-9622
Epidemiol. Serv. Saúde vol.26 no.4 Brasília dez. 2017
http://dx.doi.org/10.5123/s1679-49742017000400005
ORIGINAL ARTICLE
Use of health services among adults living in Manaus Metropolitan Region, Brazil: population-based survey, 2015
1Universidade Federal do Amazonas, Faculdade de Medicina, Manaus-AM, Brasil
2Universidade Estadual de Campinas, Faculdade de Ciências Farmacêuticas, Campinas-SP, Brasil
OBJECTIVE:
to describe the use of health services in adults living in Manaus Metropolitan Region, Amazonas, Brazil.
METHODS:
a population-based cross-sectional study was carried out with adults (≥18 years) living in Manaus Metropolitan Region in 2015; probabilistic sampling with three-stage clusters was used; data were collected at the participants’ households.
RESULTS:
4,001 adults participated, 52.8% were women, 49.7% aged 18-34 years; 80% rated their health status as good/regular; in the fortnight previous to the survey, 20.9% (95%CI 19.7;22.2%) had used a health service, 44.4% of those visited a primary health care unit; 2.9% (95%CI 2.4;3.4%) never used a health service; among those who already visited a doctor (n=3,886), most gave positive feedback about the last visit.
CONCLUSION:
health situation and last medical visit were positively assessed; one fifth of the population had used a health service in the two weeks prior to the interview, primary health care units were the main services used.
Keywords: Health Services; Diagnosis of Health Situation; Population; Surveys and Questionnaires; Epidemiology, Descriptive
Introduction
The use of health services can indirectly measure access and equity of the health system. The Brazilian National Health System (SUS) establishes national regulations for its decentralized, comprehensive and universal services. However, regional characteristics generate special features on the system’s operation and access. In geographical and economically peripheral regions, such distortions impact the system’s performance and the population’s health.
The use of health services can be assessed on the whole - use of any health service - or specifically - use of the most common services. In Brazil, a systematic review of population-based studies, conducted between 1998 and 2013 observed an increase in medical and dental visits and a decrease in hospitalizations.1 In the North region of Brazil, however, medical and dental visits decreased in the same period, and the decrease in hospitalizations was even higher than in the other regions of the country.1 The Brazilian National Health Survey (PNS), held in 2013, presented a prevalence of 17.5% in the use of any health service in the two weeks prior to the interview in Brazil.2
Low supply and use of health services and low level of self-awareness on chronic diseases can impact on a lower expectancy of life and of healthy life of the population.3 The local burden of diseases also pushes the demand for health services, especially those related to non-communicable diseases,4 which require continued health care for control and secondary prevention. Environment and social context also affect the burden of diseases and associated costs,5-7 whose effects fall upon the health system. Thus, the organization of these services impacts on a population’s health status, by inducing the use of such services.
Therefore, investigating health situation and use of health services is essential, in order to highlight aspects which demand attention to improve the region’s situation. In areas where the situational diagnosis of health services and population’s health status is less known, such as Amazonas, this type of research is even more necessary. The objective of this study was to describe the use of health services among adults in Manaus Metropolitan Region, Amazonas State, Brazil.
Methods
Study design
This is a population-based cross-sectional study, held with adults living in Manaus Metropolitan Region.
Setting
Manaus Metropolitan Region, also known as Greater Manaus, was created by the Complementary State Law No. 52, dated May 30th, 2007. It comprises eight municipalities: Manaus, Careiro da Várzea, Iranduba, Itacoatiara, Manacapuru, Novo Airão, Presidente Figueiredo and Rio Preto da Eva (Supplementary Figure 1).8 According to official estimates, the population of this region represented more than 60% of the 3,483,985 inhabitants of Amazonas State, in 2010.9 It is the highest concentrated population of the Brazilian North Region and the 10th largest population of the country. This area hosts Manaus Free Trade Zone’s, an important national economic center which supports research and innovation in technology, which makes Manaus the 6th largest gross domestic product among Brazilian municipalities, in 2013.10
As in other Brazilian regions, economic development did not promote equitable distribution of per capita income. Among Brazilian metropolitan regions, in 2013, Greater Manaus occupied the penultimate place in the Human Development Index (HDI). Three quarters of the 62 municipalities of Amazonas have low HDI.11 The region presents the lowest density of health professionals in Brazil, with one doctor per 1,000 inhabitants in 2013, which is lower than the national average of approximately 2:1,000, which is also low.3
The capital, Manaus, suffers with its poor urban planning and jumbled sprawl, which leads to paradoxes such as poor afforestation, traffic jams and geographically uneven development, favoring the wealthiest.12 Despite being a metropolis, access to Manaus is difficult. There is no terrestrial integration with other states or capitals, so the transportation of people and goods depends on air or river. This geographical isolation reflects on the low quality of the municipality’s services, such as access to internet and products, including health inputs. There is a lack of hospital beds in the municipality,13 and the available ones are concentrated in areas of urgency and emergency, whilst access to specialized and elective care is limited.
Participants
Adults aged 18 or over were eligible for the study. Those with cognitive impairment were not eligible since data collection was made directly with the individual (no proxy-respondents).
Participants were selected through three-stage probabilistic sampling, stratified in quotas by sex and age, based on the 2010 Demographic Census, conducted by the Brazilian Institute of Geography and Statistics (IBGE).9 In the first stage, 400 primary and 20 secondary tracts were randomly selected among the 2,647 urban census tracts of Manaus Metropolitan Region.9 In the second stage, households were selected through systematic sampling: a number between 1 and 20 was drawn to determine the first household to be visited; thus, one in every 20 households was visited until there were 10 interviews per census tract. In cases of empty households or refusals, the first residence to the right was invited to participate, and if this residence was unavailable, the same process was performed to the left. In the third stage, one resident was randomly selected. All individuals in the household who were ≥ 18 years old were registered in the electronic device used in the interview, and, according to the quotas predefined for the sector, one individual was drawn to be interviewed.
The planned age and sex quotas, performed interviews and the weighting of each census tract are available in the Supplementary Table 1.
Variables
The variables used in the survey were defined based on previously validated tools and/or questions used in Brazilian official surveys (Supplementary Table 2). The variables comprised lifestyle, use of health services and inputs, and the individual’s health status.
The primary outcome of this study was the self-reported use of health services. For sample description, the following variables were included:
- sex (male, female);
- age (collected in years and subsequently categorized in: 18-24, 25-34, 35-44, 45-59, ≥60);
- ethnicity/skin color (white, black, Asian, brown, indigenous);
- marital status (married, separated, divorced, widowed, single);
- education level (less than complete elementary school, complete elementary school, complete high school, higher education degree or above);
- economic class (A, B1, B2, C1, C2 and D/E, according to the 2015 Brazilian Economic Classification Criteria14); and
- self-reported health status (very good, good, regular, bad, very bad).
Data source and measurement
The use of health services in the two weeks prior to the interview was assessed through the following question: ‘In the last 15 days (two weeks), did you search for any health service or professional for assistance related to your health?’. Possible answers were “yes” or “no”.
Those who sought for any health service within the previous 15 days were also surveyed about:
- reason for seeking the health service (accident or injury, disease, dental problem, rehabilitation or therapy, prenatal care, pediatric visit, childbirth, diagnosis complementary exam, vaccination, another preventive care, health certificate request, other);
- type of service (medical visit, dental visit, visit to another health professional, health assistance by community health agent, health assistance in pharmacy, vaccination, injection, bandage or blood pressure measurement, chemotherapy, radiotherapy, hemodialysis, laboratory or imaging exams or complementary diagnosis exams, minor ambulatory surgery, hospitalization, appointment for medical visit, complementary practices, other);
- assistance at the first attempt (yes, no); and
- place of assistance (pharmacy, primary health care unit, specialty center, public outpatient clinic or medical center, emergency care unit [UPA], another type of public emergency service, urgency or emergency room of public hospital, public hospital/ambulatory, private practice, ambulatory or office of company or union, urgency or emergency department of private hospital, household health care with professional from Family Health teams, household health care with private practitioner, other).
The occurrence of the last medical visit was assessed through the following question: ‘When was the last time you went to the doctor?’. Possible answers were ‘in the last 12 months’, ‘from 1 year to less than 2 years ago’, ‘from 2 to less than 3 years ago’, ‘3 or more years ago’ or ‘never went to the doctor’. To assess the last medical visit, we asked about equipment availability, room for consultation, travel time, waiting time, attendants, cleanliness, physician’s skills and transparency, privacy and availability for questions. Possible answers were ‘very good’, ‘good’, ‘regular’, ‘bad’ or ‘very bad’. Some variables were grouped to improve description and interpretation of results.
A company specialized in population surveys was hired. Fieldwork was performed by 14 experienced and trained researchers, who collected the data using tablets (Tab3 SM-T110 Samsung® Galaxy). Interviews were held in participants’ households, from May to August 2015. The questionnaire was set up in the software SurveyToGo (Dooblo Ltd, Israel), which transmitted the data to a database via internet.
Quality control
To ensure internal validity, a pre-test of the questionnaire was performed with 150 interviewees, who composed the final sample. To assure the reliability of interviews, 20% of them were audited through telephone contact by the hired company. Excerpts of the interviews were recorded and all of them were georeferenced.
To minimize possible differences between those who responded and those who declined participation in the study, daily goals, based on predefined age and sex quotas, were set for the interviews (Supplementary Table 1). Upon invitation to participate in the research, individuals were informed that the Federal University of Amazonas was the institution responsible for the study. Considering that the University is a centenary institution for science and education with a long-standing reputation among the population, we believe that this fact contributed for individuals’ participation.
Interviewers were trained for data collection, and the questionnaire was based in previously validated instruments. The multiple choices questions were randomly ordered at each interview to bring more reliability to answers.15 The similarity between options could bias the answers, especially the last ones. Randomization was the solution to balance this tendency.15 Such strategies aimed at reducing the assessment bias.
Study size
Based on a conservative estimate of 50% frequency in the use of health services, the sample size was calculated considering a 95% confidence interval, absolute precision of 2% and design effect of 1.5. Considering the official estimate of 2,106,322 residents ≥18 years old in the region,9 the minimum size calculated for the sample was 3,598. To compensate eventual losses, approximately 10% was added to this number, totalizing 4,000 individuals to be interviewed.
Statistical methods
In this descriptive study, the frequencies and 95% confidence intervals (95%CI) were estimated considering the complex sample survey design.16 The statistical package Stata 14.2 (StataCorp, College Station, TX) was used, applying the command survey (svy).
Ethical aspects
The Ethics Research Committee of the Federal University of Amazonas approved the project, under the report No. 974,428 dated March 3rd 2015 (Certificate of Presentation for Ethical Appreciation at Brazil Platform [CAAE] 42203615.4.0000.5020). All participants signed a Free Informed Term of Consent.
Results
A total of 8,587 households were visited, from which 3,177 (36.9%) were closed or the resident did not suit the predefined quotas by sex and age. A total of 5,410 individuals were invited to participate in the study, of whom 1,314 refused (24.3%) and 95 (1.8%) were ineligible due to cognitive impairment. In the end, 4,001 adults were included in the study (Figure 1).
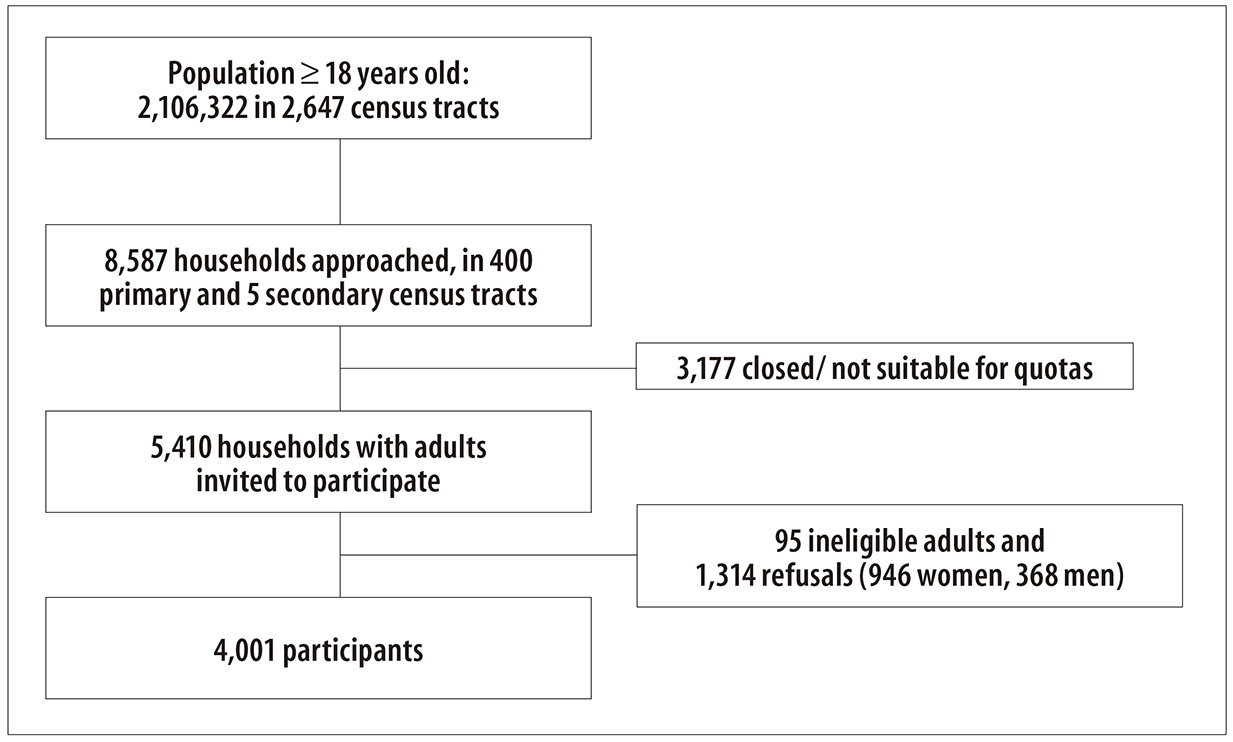
Figure 1 - Recruitment procedure for the population-based survey in Manaus Metropolitan Region, 2015
The participants’ characteristics are presented in Table 1. There was equivalence of sex representation, with slightly more women (52.8%) than men. Half of the participants were 18-34 years old, most were brown-skinned (72.2%) and 1% self-declared indigenous. More than half of the participants (54.3%) were single. Participants with at least high school represented 47.5%; 62.7% belonged to economic classes C2/D/E, and 86.7% lived in Manaus. About 80% of the participants rated their health status as good or regular.
Table 1 - Characteristics of the participants of the survey (n=4,001) in Manaus Metropolitan Region, 2015
| Participants’ characteristics | n | % | Adjusted% a | 95%CI b |
|---|---|---|---|---|
| Sex | ||||
| Male | 1,888 | 47.2 | 47.2 | 45.7-48.8 |
| Female | 2,113 | 52.8 | 52.8 | 51.2-54.3 |
| Age (in years) | ||||
| 18-24 | 838 | 20.9 | 20.9 | 19.6-22.1 |
| 25-34 | 1,152 | 28.8 | 28.8 | 27.4-30.2 |
| 35-44 | 843 | 21.1 | 21.1 | 19.9-22.4 |
| 45-59 | 772 | 19.3 | 19.3 | 18.1-20.6 |
| ≥60 | 396 | 9.9 | 9.9 | 9.0;10.9 |
| Ethnicity/skin color | ||||
| White | 636 | 15.9 | 15.9 | 14.8-17.1 |
| Black | 300 | 7.5 | 7.5 | 6.7-8.3 |
| Asian | 138 | 3.5 | 3.5 | 2.9-4.1 |
| Brown | 2,886 | 72.1 | 72.2 | 70.7-73.5 |
| Indigenous | 41 | 1.0 | 1.0 | 0.8-1.4 |
| Marital status | ||||
| Married | 1,409 | 35.2 | 35.2 | 33.8-36.7 |
| Separated | 157 | 3.9 | 3.9 | 3.4-4.6 |
| Divorced | 103 | 2.6 | 2.6 | 2.1-3.1 |
| Widowed | 159 | 4.0 | 4.0 | 3.4-4.6 |
| Single | 2,173 | 54.3 | 54.3 | 52.7-55.8 |
| Education level | ||||
| Higher education degree or above | 158 | 4.0 | 4.0 | 3.4-4.6 |
| High school | 1,903 | 47.6 | 47.5 | 46.0-49.1 |
| Complete Elementary school | 649 | 16.2 | 16.2 | 15.1-17.4 |
| Incomplete Elementary school or less | 1,291 | 32.3 | 32.3 | 30.8-33.7 |
| Municipality | ||||
| Manaus | 3,479 | 87.0 | 86.7 | 85.8-87.9 |
| Careiro da Várzea | 41 | 1.0 | 1.1 | 0.7-1.5 |
| Iranduba | 70 | 1.8 | 1.7 | 1.4-2.1 |
| Itacoatiara | 154 | 3.9 | 3.8 | 3.2-4.4 |
| Manacapuru | 140 | 3.5 | 3.5 | 3.0-4.1 |
| Novo Airão | 20 | 0.5 | 0.6 | 0.4-1.0 |
| Presidente Figueiredo | 57 | 1.4 | 1.3 | 1.0-1.7 |
| Rio Preto da Eva | 40 | 1.0 | 1.2 | 0.8-1.6 |
| Economic class | ||||
| A | 34 | 0.9 | 0.9 | 0.6-1.2 |
| B1 | 90 | 2.3 | 2.2 | 1.8-2.8 |
| B2 | 505 | 12.6 | 12.6 | 11.6-13.7 |
| C1 | 862 | 21.5 | 21.5 | 20.3-22.8 |
| C2 | 1,423 | 35.6 | 35.6 | 34.1-37.1 |
| D/E | 1,087 | 27.2 | 27.1 | 25.8-28.5 |
| Health status | ||||
| Very good | 471 | 11.8 | 11.9 | 10.9-12.9 |
| Good | 2,175 | 54.7 | 54.3 | 52.7-55.8 |
| Regular | 1,108 | 27.7 | 27.7 | 26.3-29.1 |
| Bad | 193 | 4.8 | 4.9 | 4.2-5.6 |
| Very bad | 54 | 1.4 | 1.4 | 1.0-1.8 |
a) Weighted by complex survey design.
b) 95%CI: 95% confidence interval.
Table 2 shows the results for the participants who had used a health service in the previous two weeks (n=838; 20.9% - 95%CI 19.7; 22.2%). The main reason for using a service was health problem (64.5%) and diagnosis or prevention of diseases (22.0%). Most individuals got assistance at the first attempt (84.4%); 22.7% searched for assistance in two or more health services; 44.4% were assisted in primary health care units; and 41.1% were assisted in urgency or emergency services.
Table 2 - Use of health services in the previous 15 days (n=838) in Manaus Metropolitan Region, 2015
| Variables | n | % | Adjusted% a | 95%CI b |
|---|---|---|---|---|
| Main reason | ||||
| Health problem | 541 | 64.6 | 64.5 | 61.2-67.7 |
| Diagnosis/prevention | 184 | 22.0 | 22.0 | 19.3-25.0 |
| Prenatal/childbirth | 37 | 4.4 | 4.4 | 3.2-6.0 |
| Other | 76 | 9.1 | 9.1 | 7.3-11.2 |
| Type of service | ||||
| Medical visit | 642 | 76.6 | 76.5 | 73.5-79.3 |
| Dental visit | 72 | 8.6 | 8.6 | 6.9-10.7 |
| Therapeutic/diagnostic procedure | 85 | 10.1 | 10.2 | 8.3-12.5 |
| Other | 39 | 4.7 | 4.7 | 3.4-6.3 |
| Assistance at first attempt | ||||
| Yes | 707 | 84.4 | 84.4 | 81.7-86.7 |
| No | 131 | 15.6 | 15.6 | 13.2-18.3 |
| Number of attempts for health service | ||||
| 1 | 648 | 77.3 | 77.3 | 74.3-80.0 |
| 2 or more | 190 | 22.7 | 22.7 | 20.0-25.7 |
| Place of assistance c | ||||
| Primary health care unit | 372 | 44.4 | 44.4 | 41.1-47.8 |
| Outpatient clinic | 238 | 28.4 | 28.4 | 25.4-31.5 |
| Urgency/emergency | 344 | 41.1 | 41.1 | 37.8-44.4 |
| Other | 20 | 2.4 | 2.4 | 1.5-3.7 |
a) Weighted by complex survey design.
b) 95%CI: 95% confidence interval.
c) More than one place could be informed by the participant.
Most of the participants who had not used a health service in the two weeks prior to the interview (n=3,163) reported that they did not need it (89.3%). Among the reasons for not getting health care, individuals reported limitations of the service (available timetables, waiting time, distance, specialist availability: 6.9%), and personal limitations (constraints regarding money, transportation or hospital companion: 3.2%).
Medical visit was the most frequently used service in the previous 15 days (76.5%), whereas 2.9% reported they had never visited a doctor (95%CI 2.4;3.4) and 20.6% last visited a doctor over one year before the survey (Table 3).
Table 3 - Characteristics of last medical visit (n=4,001) in Manaus Metropolitan Region, 2015
| Variables | n | % | Adjusted% a | 95%CI b |
|---|---|---|---|---|
| Last medical visit | ||||
| In the last 12 months | 3,066 | 76.6 | 76.6 | 75.2-77.8 |
| From 1 to less than 2 years ago | 531 | 13.3 | 13.3 | 12.3-14.4 |
| 2 or more years ago | 489 | 12.2 | 12.2 | 6.5-8.1 |
| Never went to the doctor | 115 | 2.9 | 2.9 | 2.4-3.4 |
| Type of doctor | ||||
| Family doctor or general practitioner | 2,995 | 74.9 | 74.9 | 73.5-76.2 |
| Gynecologist | 402 | 10.1 | 10.0 | 9.1-11.0 |
| Other specialist | 489 | 12.2 | 12.2 | 11.2-13.3 |
| Never went to the doctor | 115 | 2.9 | 2.9 | 2.4-3.4 |
a) Weighted by complex survey design.
b) 95%CI: 95% confidence interval.
Most of the 3,886 individuals that had visited a doctor reported the last medical visit as ‘good’/‘very good’ regarding the following aspects: equipment (61.8%); room for consultation (61.1%); attendants (60.9%); cleanliness (55.9%); and assessment of physician’s skills (64.3%), respect (66.0%), transparency (63.3%), privacy (68.0%) and availability for questions (65.4%). The waiting time was considered ‘bad’ or ‘very bad’ by 27.3% of the participants and 25.7% gave negative feedback regarding the freedom to choose a physician. Other negative aspects included travel time (18.9%) and physician’s availability for patients’ questions (12.3%; Table 4).
Table 4 - Participant’s assessment of the last medical visit (n=3,886) in Manaus Metropolitan Region
| Assessment | Good % a | Regular % a | Bad % a |
|---|---|---|---|
| Equipment availability | 61.8 | 26.2 | 12.0 |
| Room for consultation | 61.1 | 27.5 | 11.4 |
| Travel time | 51.8 | 29.2 | 18.9 |
| Waiting time | 44.4 | 28.3 | 27.3 |
| Attendants | 60.9 | 25.5 | 13.6 |
| Cleanliness | 55.9 | 28.0 | 16.1 |
| Physician’s skills | 64.3 | 23.6 | 12.1 |
| Physician’s respect | 66.0 | 22.9 | 11.0 |
| Physician’s transparency | 63.6 | 23.9 | 12.5 |
| Privacy with the physician | 68.0 | 21.5 | 10.4 |
| Availability for questions | 65.4 | 22.2 | 12.3 |
| Freedom in choosing a physician | 45.8 | 28.6 | 25.7 |
a) Weighted by complex survey design.
Discussion
A fifth of the population of Manaus Metropolitan Region used a health service in the fortnight previous to the survey and almost 10% searched for a service, but did not use it due to personal or system’s constraints. Among those who used the service, the primary health care unit was the main place of assistance, whereas medical visit was the most used service. On the overall, the last visit was positively assessed. Waiting time, opportunity to choose the physician and communication with the professional are points that would benefit from improvements.
Adults of Greater Manaus used a health service in the last fortnight with higher frequency than that observed nationwide by the National Health Survey (17.5%; 95%CI 17.0; 18.1%).2 However, the proportion of individuals in Greater Manaus who had never visited a doctor was three times higher than the national estimate, highlighting the existing inequalities in Brazil.17
The positive feedback about the last medical visit was similar to that observed nationwide by the National Health Survey, which also reported less satisfaction regarding waiting time and freedom to choose a physician.18
It was not possible to estimate the impact of losses caused by refusals and closed households in this study. Inclusion of individuals was random and based on the predefined quotas by sex and age, from official estimates, in order to obtain demographic representativeness of the population as a whole. Another effort that could have been employed to increase the sample’s representativeness would be the random selection of residents and appointment of an interview with those who were not present at the moment of the household visit. The proportion of refusals in epidemiologic studies has been increasing over the last decades, however the refusals’ proportion does not necessarily indicate a selection bias.19 Thus, it is important to assess possible differences between the characteristics of the participants and of those who declined participating in the study.19
The participants’ characteristics support the representativeness of the sample. The proportions of women and young adults are similar to those of the last official census.9 Most of the individuals live in Manaus, a proportion similar to the official estimates for this metropolitan area, and self-reported brown-skinned, an ethnical mix of indigenous, white and black individuals, which is typical in that region.
Other characteristics emphasize the differences of this area in comparison with Brazil as a whole. Almost 90% of the population belongs to C, D and E economic classes. In Brazil, this stratum represents 75% of the population.14
Besides the limitations inherent to the applied cross-sectional design, there is a possibility of selection bias. Individuals with more severe diseases - and consequently more demand for health care - might not have been included in the survey because they were under treatment, thus, not in the household. This would lead to an underestimation in the prevalences of health services use.20
A third of the sample assessed their health status as regular, bad or very bad, which shows the need for healthcare assistance in the region. Considering the low economic power of the population of Manaus Metropolitan Region, their need for public health assistance, which depends exclusively on SUS, is even higher.21 The strengthening and widening of SUS is essential to the region’s social development.
A second stage of the project was approved by the Ethics Research Committee (Report No. 1,541,710 dated May 10th 2016; CAAE 53215816.6.0000.5020) and began in June 2016. In this second phase, participants are contacted by telephone to ascertain their interest in performing laboratory tests, such as blood count. Once the individual accepts, a new term of consent is presented and, after signed, the collection of biological material is scheduled to be performed in the household or work place, wherever is more convenient for the participant. This stage depends on reaching the participants by phone, which is a concern for researchers: in Brazil, it is very common for people to change cell phone numbers due to changes in their plans and promotions from other telephone companies. Other factors that may affect adherence are the lack of interest, fear of needles/syringes and misreporting of telephone numbers during the interviews performed in 2015.
The results of this survey point to differences in the use of health services in Manaus Metropolitan Region compared to the national profile. The investigation of associated factors, in future analyses, may help elucidate the health status and use of health services in Manaus Metropolitan Region, drawing attention to the problem and to health policies aimed at its resolution.
Acknowledgement
To Maria Elizete Almeida Araújo, doctoral student of the Postgraduate Program in Health Sciences of the University of Brasília, for preparing Supplementary Figure 1
REFERENCES
1. Araújo MEA, Silva MT, Andrade KRC, Galvão TF, Pereira MG. Prevalência de utilização de serviços de saúde no Brasil: revisão sistemática e meta-análise. Epidemiol Serv Saude. 2017 jul-set;25(3):20. [ Links ]
2. Instituto Brasileiro de Geografia e Estatística. Pesquisa nacional de saúde 2013 [Internet]. Brasília: Instituto Brasileiro de Geografia e Estatística; 2015 [citado 2015 jun 15]. Disponível em: Disponível em: http://www.ibge.gov.br/home/estatistica/populacao/pns/2013/ [ Links ]
3. Szwarcwald CL, Souza Júnior PRB, Marques AP, Almeida WS, Montilla DER. Inequalities in healthy life expectancy by Brazilian geographic regions: findings from the National Health Survey, 2013 Nov. Int J Equity Health. 2016;15:141. [ Links ]
4. Leite IC, Valente JG, Schramm JMA, Daumas RP, Rodrigues RN, Santos MF, et al. Carga de doença no Brasil e suas regiões, 2008. Cad Saúde Pública. 2015 jul;31(7):1551-64. [ Links ]
5. Imbiriba ENB, Silva Neto AL, Souza WV, Pedrosa V, Cunha MG, Garnelo L. Desigualdade social, crescimento urbano e hanseníase em Manaus: abordagem espacial. Rev Saúde Pública. 2009 ago;43(4):656-65. [ Links ]
6. Medeiros MS, Sacramento DS, Hurtado-Guerrero JC, Ortiz RA, Fenner ALD. Cost of illness attributable to environmental factors in the city of Manaus, state of Amazonas, Brazil. Ciênc Saúde Coletiva. 2014 Feb;19(2):599-608. [ Links ]
7. Campos MR, von Doellinger VR, Mendes LV, Costa MF, Pimentel TG, Schramm JM. Morbidity and mortality associated with injuries: results of the Global Burden of Disease study in Brazil, 2008. Cad Saúde Pública. 2015 Jan;31(1):121-36. [ Links ]
8. Brasil. Amazonas. Lei Complementar Estadual nº 52 de 30 de maio de 2007. Institui a Região Metropolitana de Manaus e dá outras providências. Diário Oficial do Estado do Amazonas, Manaus (AM), 2007 maio 30;(31.112). [ Links ]
9. Instituto Brasileiro de Geografia e Estatística. Censo demográfico de 2010: Amazonas. [Internet] - 2010. Disponível em: http://www.censo2010.ibge.gov.br/sinopse/index.php?uf=13&dados=4 [ Links ]
10. Instituto Brasileiro de Geografia e Estatística. Coordenação de Contas Nacionais. Produto interno bruto dos municípios: 2010-2013 [Internet]. Rio de Janeiro: Instituto Brasileiro de Geografia e Estatística; 2015 [citado 2017 maio 31]. 68 p. Disponível em: Disponível em: http://biblioteca.ibge.gov.br/visualizacao/livros/liv95014.pdf [ Links ]
11. Programa das Nações Unidas para o Desenvolvimento. Instituto de Pesquisa Econômica Aplicada. Fundação João Pinheiro. Atlas do desenvolvimento humano no Brasil: ranking - todo Brasil (2010) [Internet]. 2013 - [citado 2017 maio 31]. Disponível em: Disponível em: http://atlasbrasil.org.br/2013/ranking [ Links ]
12. Kanai JM. Capital of the Amazon rainforest: constructing a global city-region for entrepreneurial Manaus. Urban Stud. 2014 Jul;51(11):2387-405. [ Links ]
13. Barbosa MA. Desigualdades Regionais e Sistema de Saúde no Amazonas: o caso de Manaus [dissertação]. Rio de Janeiro (RJ): Fundação Oswaldo Cruz; 2004. [ Links ]
14. Associação Brasileira de Empresas de Pesquisa (BR). Critério de classificação econômica Brasil [Internet]. São Paulo; 2015[citado 2017 maio 31]. Disponível em: Disponível em: http://www.abep.org/criterio-brasil [ Links ]
15. Warner SL. Randomized response: a survey technique for eliminating evasive answer bias. J Am Stat Assoc. 1965 Mar;60(309):63-9. [ Links ]
16. Heeringa SG, Berglund PA, West BT, Mellipilán ER, Portier K. Attributable fraction estimation from complex sample survey data. Ann Epidemiol. 2015 Mar;25(3):174-8. [ Links ]
17. Boccolini CS, de Souza Junior PR. Inequities in healthcare utilization: results of the Brazilian National Health Survey, 2013. Int J Equity Health. 2016 Nov;15(1):150. [ Links ]
18. Szwarcwald CL, Damacena GN, Souza Júnior PRB, Almeida WS, Malta DC. Percepção da população brasileira sobre a assistência prestada pelo médico. Brasil, 2013. Ciênc Saúde Coletiva. 2016 fev;21(2):339-49. [ Links ]
19. Galea S, Tracy M. Participation rates in epidemiologic studies. Ann Epidemiol. 2007 Sep;17(9):643-53. [ Links ]
20. Delgado-Rodríguez M, Llorca J. Bias. J Epidemiol Community Health. 2004 Aug;58(8):635-41. [ Links ]
21. Malta DC, Stopa SR, Pereira CA, Szwarcwald CL, Oliveira M, Reis AC. Cobertura de planos de saúde na população brasileira, segundo a Pesquisa Nacional de Saúde, 2013. Ciênc Saúde Coletiva. 2017 jan;22(1):179-90. [ Links ]
22. Santos M, Cintra MA, Monteiro AL, Santos B, Gusmão-Filho F, Andrade MV, et al. Brazilian valuation of EQ-5D-3L health states: results from a saturation study. Med Decis Making. 2016 Feb;36(2):253-63. [ Links ]
23. Lowe B, Decker O, Muller S, Brahler E, Schellberg D, Herzog W, et al. Validation and standardization of the Generalized Anxiety Disorder Screener (GAD-7) in the general population. Med Care. 2008 Mar;46(3):266-74. [ Links ]
24. de Lima Osório F, Vilela Mendes A, Crippa JA, Loureiro SR. Study of the discriminative validity of the PHQ-9 and PHQ-2 in a sample of Brazilian women in the context of primary health care. Perspect Psychiatr Care. 2009 Jul;45(3):216-27. [ Links ]
25. Henrique IFS, De Micheli D, Lacerda RB, Lacerda LA, Formigoni MLOS. Validation of the Brazilian version of alcohol, smoking and substance involvement screening test (ASSIST). Rev Assoc Med Bras. 2004 Apr-Jan;50(2):199-206. [ Links ]
26. Andrade EO. Validação do questionário de triagem de asma do inquérito de saúde respiratória da Comunidade Européia (ECRHS) na cidade de Manaus-AM [tese]. Porto Alegre (RS): Universidade Federal do Rio Grande do Sul; 2007. [ Links ]
Received: January 24, 2017; Accepted: April 04, 2017
 Este é um artigo publicado em acesso aberto sob uma licença Creative Commons
