


Serviços Personalizados
Journal

Artigo
 texto em
  Inglês (pdf)
 Artigo em XML
 Referências do artigo
 Curriculum ScienTI
 Enviar este artigo por email
Indicadores
-
 Citado por SciELO
Links relacionados
-
 Similares em
SciELO
Similares em
SciELO
Compartilhar

 Permalink
Epidemiologia e Serviços de Saúde
versão impressa ISSN 1679-4974versão On-line ISSN 2337-9622
Epidemiol. Serv. Saúde vol.26 no.4 Brasília dez. 2017
http://dx.doi.org/10.5123/s1679-49742017000400010
Original article
Tuberculosis in the Brazilian imprisoned population, 2007-2013*
1Fundação Instituto Oswaldo Cruz, Escola Nacional de Saúde Pública Sergio Arouca, Rio de Janeiro-RJ, Brasil
2Universidade Federal do Espírito Santo, Departamento de Enfermagem, Vitória-ES, Brasil
OBJECTIVE:
to describe socio-demographic and clinical characteristics and indicators of tuberculosis (TB) in Brazilian imprisoned population, from 2007 to 2013.
RESULTS:
from 2007 to 2013, 38,083 TB cases were reported in the imprisoned population, equivalent to a TB prevalence of 1,236 cases/100,000 individuals; this prevalence was higher among women (1,693/100,000), indigenous people (2,874/100,000), and in the age group >60 years (4,093/100,000); there were mainly reports of cases of pulmonary TB (91.5%) and new cases (78.1%); the TB incidence rate in 2013 (904.9/100,000) was higher than 2007 (627.6/100,000), whilst the mortality rate in 2013 (16.0/100,000) was lower than 2007 (18.0/100,000).
CONCLUSION:
TB in the imprisoned population presents some specific characteristics and higher occurrence than in the general population; the highest prevalence in women and the highest incidence at the end of the study period stood out.
Keywords: Tuberculosis; Prisons; Epidemiology, Descriptive
Introduction
Tuberculosis (TB) in an important Public Health problem due to its magnitude, transcendence and vulnerability.1 In 2015, the World Health Organization (WHO) estimated an occurrence of 10.4 million new cases of tuberculosis and 1.4 million deaths due to this disease, worldwide.2 In that same year, in Brazil, the incidence rate of tuberculosis was of 30.9 cases per 100 thousand inhabitants and mortality, 2.2 deaths per 100 thousand inhabitants.3
The occurrence and transmission of TB are associated to the living conditions of the population: they are higher in places with high population density, poor sanitation and housing infrastructure, food insecurity, drug abuse and difficulties to access health services. Because of that, the National Program for Tuberculosis Control (NPTC) selected the following populations as those who are more vulnerable to this disease: homeless individuals, imprisoned population, indigenous and individuals living with HIV (human immunodeficiency virus), causative agent of the acquired immunodeficiency syndrome (AIDS).4
A survey conducted in 2014 showed the magnitude of imprisoned population in Brazil. In that year, Brazil had the 4th biggest imprisoned population in the world, with 622,202 prisoners. This number is higher than the amount of vacancies available in Brazilian detention facilities, and reveals a deficit of 231,062 vacancies, besides an average occupancy higher than the availability (161%), showing the fragility of the National Prison System.5
The prison system is an environment with potential TB transmission. The incidence of the disease among the imprisoned population is higher than in the general population. In 2014, the imprisoned population represented approximately 0.3% of the Brazilian population and contributed with 7.8% of new TB cases notified in the country. In this group, the resistant forms of the disease are still more frequent, which is related to inadequate treatment and late diagnosis.6
In face of TB issue, in 2003, the Brazilian Ministry of Health defined tuberculosis as priority and designed programmatic actions for its control, including the production and analysis of indicators based on data from states and municipalities, with the objective of identifying the main challenges and establish targets for the disease control and prevention.7 The incidence and mortality rates and the cure proportion (treatment success) are the main indicators employed to monitor TB behavior;7 its calculation and critical analysis are highly important, not only for the general population but also for specific ones, such as the imprisoned population.
With regard to imprisoned population, there are few researches that provide information with wide geographical scope and allow an assessment of trend between periods; most of them are restricted to local aspects (in the scope of municipalities or single detention facilities) and are specific, hindering a situational diagnosis.
In this context, this study aimed at describing socio-demographic and clinical characteristics and tuberculosis monitoring and assessment indicators in Brazilian imprisoned population, from 2007 to 2013.
Methods
This is a descriptive study with data from the Information System for Notifiable Diseases (Sinan) about TB cases among the imprisoned population.
Sinan is a national information system which aims at supporting data collection and processing on diseases and conditions and Public Health events, including TB. The information generated by it assists in the planning, prevention, assessment and control of diseases, acting as an important tool for epidemiological surveillance.8
The size of the imprisoned population in Brazilian detention facilities in 2014 was superior to 622 thousand, which corresponded to a rate of more than 300 inmates/100 thousand inhabitants. The National Survey on Prison Information, conducted in 2014 shows that this population is mostly composed of youngsters (55.07% up to 29 years old), black-skinned (61.67%) and individuals with poor access to education: 9.5% concluded high school. Moreover, from 2005 to 2014, there was a fast growth in female’s prisons (10.7% per year).5
In the present study, all the confirmed cases of TB among the imprisoned population were included, selected per year of diagnosis, from 2007 to 2013. In 2007, the field ‘institutionalized’ was included on Sinan-TB files,9 that is why 2007 was chosen as the first year of the study period. Individuals with closure ‘change in diagnosis’ and those younger than 18 years old were excluded.
Following the recommendations by the Ministry of Health, we calculated indicators of monitoring and assessment of TB control actions in the imprisoned population:1
- tuberculosis incidence rate (number of cases reported in the year/total population of that year x 100 thousand);
- tuberculosis mortality rate (number of cases closed as death due to TB in the year/total population of that year x 100 thousand);
- proportion of TB-HIV coinfection (number of new TB cases notified, positive for HIV in the year/number of new TB cases notified in that year x 100);
- proportion of TB cases tested for HIV (number of TB cases notified with test for HIV performed in the year/number of TB cases notified in that year x 100);
- proportion of TB cases which underwent direct observed treatment (DOT) (number of TB cases that underwent DOT in the year/number of new TB cases notified in that year x 100);
- proportion of TB retreatment cases (number of TB retreatment cases in the year/number of new TB cases notified in that year x 100);
- proportion of cured TB cases (number of TB cured cases in the year/number of TB cases notified in that year x 100);
- proportion of dropout TB cases (number of TB cases closed for dropout in the year/number of TB cases notified in that year x 100);
- proportion of TB deaths (number of TB cases closed due to death in the year/number of TB cases notified in that year x 100); and
- proportion of TB cases with informed closure (number of TB cases with informed closure in the year/number of new TB cases notified in that year x 100).
We also calculated the TB prevalence from the number of TB cases, divided by the number of imprisoned population of x 100 thousand for the total imprisoned population and according to sociodemographic characteristics.
To calculate the indicator ‘mortality rate’, the Ministry of Health recommends the use of the number of deaths recorded into the Mortality Information System (SIM). As SIM does not present any information on ‘institutionalization’, we adapted the recommendation, and the imprisoned population mortality rate was calculated from the number of TB cases which presented the outcome death at Sinan.
The indicators were calculated for the period from 2007 to 2013, per year of diagnosis. The imprisoned population data used to calculate the incidence and mortality rates were extracted from reports of the National Prison Department10 and from the National Survey on Prison Information of the National Prison Department.5
The variables used to characterize the population and calculate indicators were:
- sex (male, female);
- ethnicity/skin color (white; black, brown, Asian; indigenous, unknown/blank);
- education level (in years of schooling: illiterate, 1 to 4, 5 to 8, more than 8, unknown/blank);
- age group (in years: 18 to 35, 36 to 59, 60 or more, unknown/blank);
- TB form (pulmonary, extrapulmonary, pulmonary + extrapulmonary);
- type of entry (new case, recurrence, return after dropout, unknown, referral);
- closure (cure, dropout, death due to TB, death due to other causes, referral, multidrug-resistant TB, unknown/blank);
- conduction of direct observed treatment (DOT); and
- test for HIV.
The free statistical analysis software R version 3.2.2 was used.
The research data were provided by the Ministry of Health through the Citizen Information Service (CIS), supported by Law No. 12,527, dated November 18th 2011.11 Only public domain data, with no individuals’ identification, were used. The research project was approved by the Ethics Research Committee of the National School of Public Health Sergio Arouca (ENSP), of the Oswaldo Cruz Foundation (Fiocruz), under the Report No. 1,866,469, dated December 14th 2016.
Results
From 2007 to 2013, 39,083 TB cases in the imprisoned population were notified. After applying the exclusion criteria, there were 38,083 confirmed cases of TB among the imprisoned population for the period (Table 1).
Table 1 - Selection of tuberculosis cases (TB) in a study on the population deprived of liberty, Brazil, 2007-2013
| Cases selection | 2007 | 2008 | 2009 | 2010 | 2011 | 2012 | 2013 | Total |
|---|---|---|---|---|---|---|---|---|
| Total TB cases in Brazil | 87,919 | 90,059 | 88,135 | 88,107 | 90,254 | 85,428 | 88,368 | 619,270 |
| Total TB cases among inmates | 3,551 | 4,426 | 5,556 | 5,800 | 6,237 | 6,410 | 7,103 | 39,083 |
| Cases excluded due to diagnosis change | 38 | 43 | 50 | 49 | 51 | 70 | 75 | 376 |
| TB cases confirmed among inmates | 3,513 | 4,383 | 5,506 | 5,751 | 6,186 | 6,340 | 7,028 | 38,707 |
| Cases excluded due to age (<18 years) | 70 | 87 | 92 | 94 | 78 | 83 | 120 | 624 |
| Cases included into the study | 3,443 | 4,296 | 5,414 | 5,657 | 6,108 | 6,257 | 6,908 | 38,083 |
For all the years studied, the TB prevalence was higher among women than in men: 1,693/100 thousand and 1,180/100 thousand, respectively. This prevalence was also high among indigenous people (2,874/100 thousand). The higher TB prevalence among the ethnicity/skin color Asian (1,649/100 thousand), when comparing to white (1,164/100 thousand), brown (1,154/100 thousand) and black (993/100 thousand) also stood out. In the category education level, individuals who had 1 to 4 years of schooling presented the highest TB prevalence (1,858/100 thousand), however there was an expressive number of reports in which this information was unknown/blank. For the whole period, the TB prevalence in inmates aged over 60 years old (4,093/100 thousand) was higher than the other age groups (Table 2).
Table 2 - Tuberculosis prevalence coefficients (per 100 thousand inmates) according to sociodemographic characteristics, Brazil, 2007-2013
| Characteristics | 2007 | 2008 | 2009 | 2010 | 2011 | 2012 | 2013 | Total | ||||||||
|---|---|---|---|---|---|---|---|---|---|---|---|---|---|---|---|---|
| N | Prevalence | N | Prevalence | N | Prevalence | N | Prevalence | N | Prevalence | N | Prevalence | N | Prevalence | N | Prevalence | |
| Sex | ||||||||||||||||
| Female | 372 | 1,954 | 413 | 1,912 | 434 | 1,787 | 463 | 1,643 | 480 | 1,636 | 485 | 1,533 | 515 | 1,577 | 3,162 | 1,693 |
| Male | 3,071 | 884 | 3,883 | 1,044 | 4,980 | 1,268 | 5,194 | 1,244 | 5,628 | 1,274 | 5,772 | 1,197 | 6,393 | 1,266 | 34,921 | 1,180 |
| Ethnicity/skin color | ||||||||||||||||
| White | 1,117 | 813 | 1,461 | 991 | 1,997 | 1,279 | 1,957 | 1,250 | 2,078 | 1,249 | 2,098 | 1,209 | 2,258 | 1,282 | 12,966 | 1,164 |
| Black | 504 | 850 | 617 | 927 | 774 | 1,113 | 780 | 1,107 | 732 | 965 | 765 | 926 | 898 | 1,040 | 5,070 | 993 |
| Asian | 17 | 761 | 39 | 1,427 | 73 | 3,603 | 43 | 2,144 | 45 | 2,064 | 28 | 1,210 | 23 | 835 | 268 | 1,649 |
| Brown | 1,139 | 810 | 1,412 | 937 | 1,802 | 1,055 | 2,127 | 1,166 | 2,481 | 1,252 | 2,702 | 1,272 | 3,071 | 1,387 | 14,734 | 1,154 |
| Indigenous | 19 | 3,525 | 10 | 1,957 | 21 | 4,031 | 27 | 3,610 | 18 | 2,341 | 21 | 2,479 | 19 | 2,490 | 135 | 2,874 |
| Unknown/blank | 647 | - | 757 | - | 747 | - | 723 | - | 754 | - | 643 | - | 639 | - | 4,910 | - |
| Education level (in years of schooling) | ||||||||||||||||
| Illiterate | 105 | 353 | 125 | 440 | 156 | 598 | 146 | 577 | 157 | 594 | 174 | 626 | 176 | 641 | 1,039 | 543 |
| 1-4 | 894 | 1,708 | 947 | 2,015 | 1,005 | 2,029 | 1,004 | 1,800 | 1,168 | 2,001 | 1,151 | 1,796 | 1,127 | 1,719 | 7,296 | 1,858 |
| 5-8 | 975 | 471 | 1,071 | 482 | 1,296 | 527 | 322 | 126 | 2,195 | 796 | 2,673 | 1,027 | 2,414 | 801 | 10,946 | 619 |
| >8 | 244 | 381 | 363 | 477 | 364 | 456 | 478 | 561 | 968 | 1,020 | 560 | 550 | 1,185 | 1,108 | 4,162 | 683 |
| Unknown/blank | 1,225 | - | 1,790 | - | 2,593 | - | 2,707 | - | 1,620 | - | 1,699 | - | 2,006 | - | 13,640 | - |
| Age group (in years) | ||||||||||||||||
| 18-35 | 2,437 | 927 | 3,102 | 1,077 | 4,008 | 1,288 | 4,149 | 1,321 | 4,479 | 1,330 | 4,625 | 1,287 | 5,110 | 1,384 | 27,910 | 1,245 |
| 36-59 | 841 | 1,118 | 1,022 | 1,268 | 1,243 | 1,429 | 1,335 | 1,401 | 1,433 | 1,361 | 1,447 | 1,249 | 1,612 | 1,348 | 8,933 | 1,316 |
| ≥60 | 165 | 4,934 | 172 | 5,168 | 163 | 3,999 | 173 | 3,983 | 196 | 4,042 | 185 | 3,667 | 187 | 3,506 | 1,241 | 4,093 |
| Total | 13,772 | 968 | 17,184 | 1105 | 21,656 | 1,314 | 21,628 | 1,247 | 24,432 | 1,317 | 25,028 | 1,275 | 27,633 | 1,341 | 151,333 | 1,236 |
The most prevalent TB form and the type of entry for the studied period were, respectively, pulmonary (91.5%) and ‘new case’ (78.1%). Recurrence cases corresponded to 10.1% of the total. We also observed an expressive number of returns after dropout (7.7%), whilst the proportion of cases in which the type of entry was unknown (does not know) was of 0.2%. Referrals corresponded to 3.8% of the total cases. Most cases obtained cure after treatment (68.6%). Dropouts corresponded to 10.7% of the total cases. Summing up deaths due to TB and other causes, they corresponded to 3.9% and closure as multidrug-resistant TB represented 0.3% of cases (Table 3).
Table 3 - Distribution of clinical characteristics of tuberculosis cases population deprived of liberty, Brazil, 2007-2013
| Characteristics | 2007 | 2008 | 2009 | 2010 | 2011 | 2012 | 2013 | Total | ||||||||
|---|---|---|---|---|---|---|---|---|---|---|---|---|---|---|---|---|
| N | % | N | % | N | % | N | % | N | % | N | % | N | % | N | % | |
| Tuberculosis type | ||||||||||||||||
| Pulmonary | 3,095 | 89.9 | 3,842 | 89.5 | 4,943 | 91.3 | 5,167 | 91.3 | 5,610 | 91.8 | 5,749 | 91.9 | 6,426 | 93.0 | 34,833 | 91.5 |
| Estrapulmonary | 250 | 7.3 | 328 | 7.6 | 351 | 6.5 | 358 | 6.4 | 372 | 6.1 | 374 | 6.0 | 370 | 5.4 | 2,403 | 6.3 |
| Pulmonary + extrapulmonary | 98 | 2.8 | 126 | 2.9 | 120 | 2.3 | 131 | 2.3 | 126 | 2.1 | 134 | 2.1 | 112 | 1.6 | 847 | 2.2 |
| Type of entry | ||||||||||||||||
| New case | 2,652 | 77.0 | 3,338 | 77.7 | 4,294 | 79.3 | 4,492 | 79.4 | 4,765 | 78.0 | 4,941 | 79.0 | 5,262 | 76.2 | 29,744 | 78.1 |
| Recurrence | 326 | 9.5 | 401 | 9.3 | 477 | 8.8 | 524 | 9.3 | 666 | 10.9 | 683 | 10.9 | 779 | 11.3 | 3,856 | 10.1 |
| Return after dropout | 249 | 7.2 | 317 | 7.4 | 415 | 7.7 | 418 | 7.4 | 421 | 6.9 | 446 | 7.1 | 658 | 9.5 | 2,924 | 7.7 |
| Unknown | 11 | 0.3 | 09 | 0.2 | 11 | 0.2 | 12 | 0.2 | 10 | 0.2 | 15 | 0.2 | 26 | 0.4 | 94 | 0.2 |
| Referral | 205 | 6.0 | 231 | 5.4 | 217 | 4.0 | 211 | 3.7 | 246 | 4.0 | 172 | 2.8 | 183 | 2.6 | 1,465 | 3.8 |
| Closure | 105 | 353 | 125 | 440 | 156 | 598 | 146 | 577 | 157 | 594 | 174 | 626 | 176 | 641 | 1,039 | 543 |
| Cure | 1,983 | 57.6 | 2,565 | 59.7 | 3,816 | 70.5 | 4,017 | 71.0 | 4,474 | 73.2 | 4,470 | 71.3 | 4,799 | 69.5 | 26,124 | 68.6 |
| Dropout | 364 | 10.6 | 475 | 11.1 | 663 | 12.3 | 630 | 11.1 | 638 | 10.4 | 655 | 10.5 | 659 | 9.5 | 4,084 | 10.7 |
| Death due to tuberculosis | 76 | 2.2 | 69 | 1.6 | 79 | 1.5 | 77 | 1.4 | 79 | 1.3 | 73 | 1.3 | 93 | 1.3 | 546 | 1.4 |
| Death due to other causes | 97 | 2.8 | 104 | 2.4 | 146 | 2.7 | 158 | 2.8 | 152 | 2.5 | 134 | 2.1 | 143 | 2.1 | 934 | 2.5 |
| Referral | 350 | 10.2 | 375 | 8.7 | 489 | 9.0 | 466 | 8.2 | 567 | 9.3 | 513 | 8.2 | 581 | 8.4 | 3,341 | 8.8 |
| Multidrug-resistant tuberculosis | 7 | 0.2 | 7 | 0.2 | 24 | 0.4 | 16 | 0.3 | 29 | 0.5 | 20 | 0.3 | 24 | 0.4 | 127 | 0.3 |
| Unknown/blank | 566 | 16.4 | 701 | 16.3 | 197 | 3.6 | 293 | 0.3 | 169 | 2.8 | 392 | 6.3 | 609 | 8.8 | 2,927 | 7.7 |
TB incidence rate in the imprisoned population was of 627.6 and 904.9 cases per 100 thousand inhabitants in 2007 and 2013, respectively. For the whole period, this rate was of 852.8 per 100 thousand. Mortality rate (deaths/100 thousand inmates) was higher in 2007 (18.0), when compared to 2013 (16.0), and corresponded to 15.7 for the whole period analyzed (Figure 1).
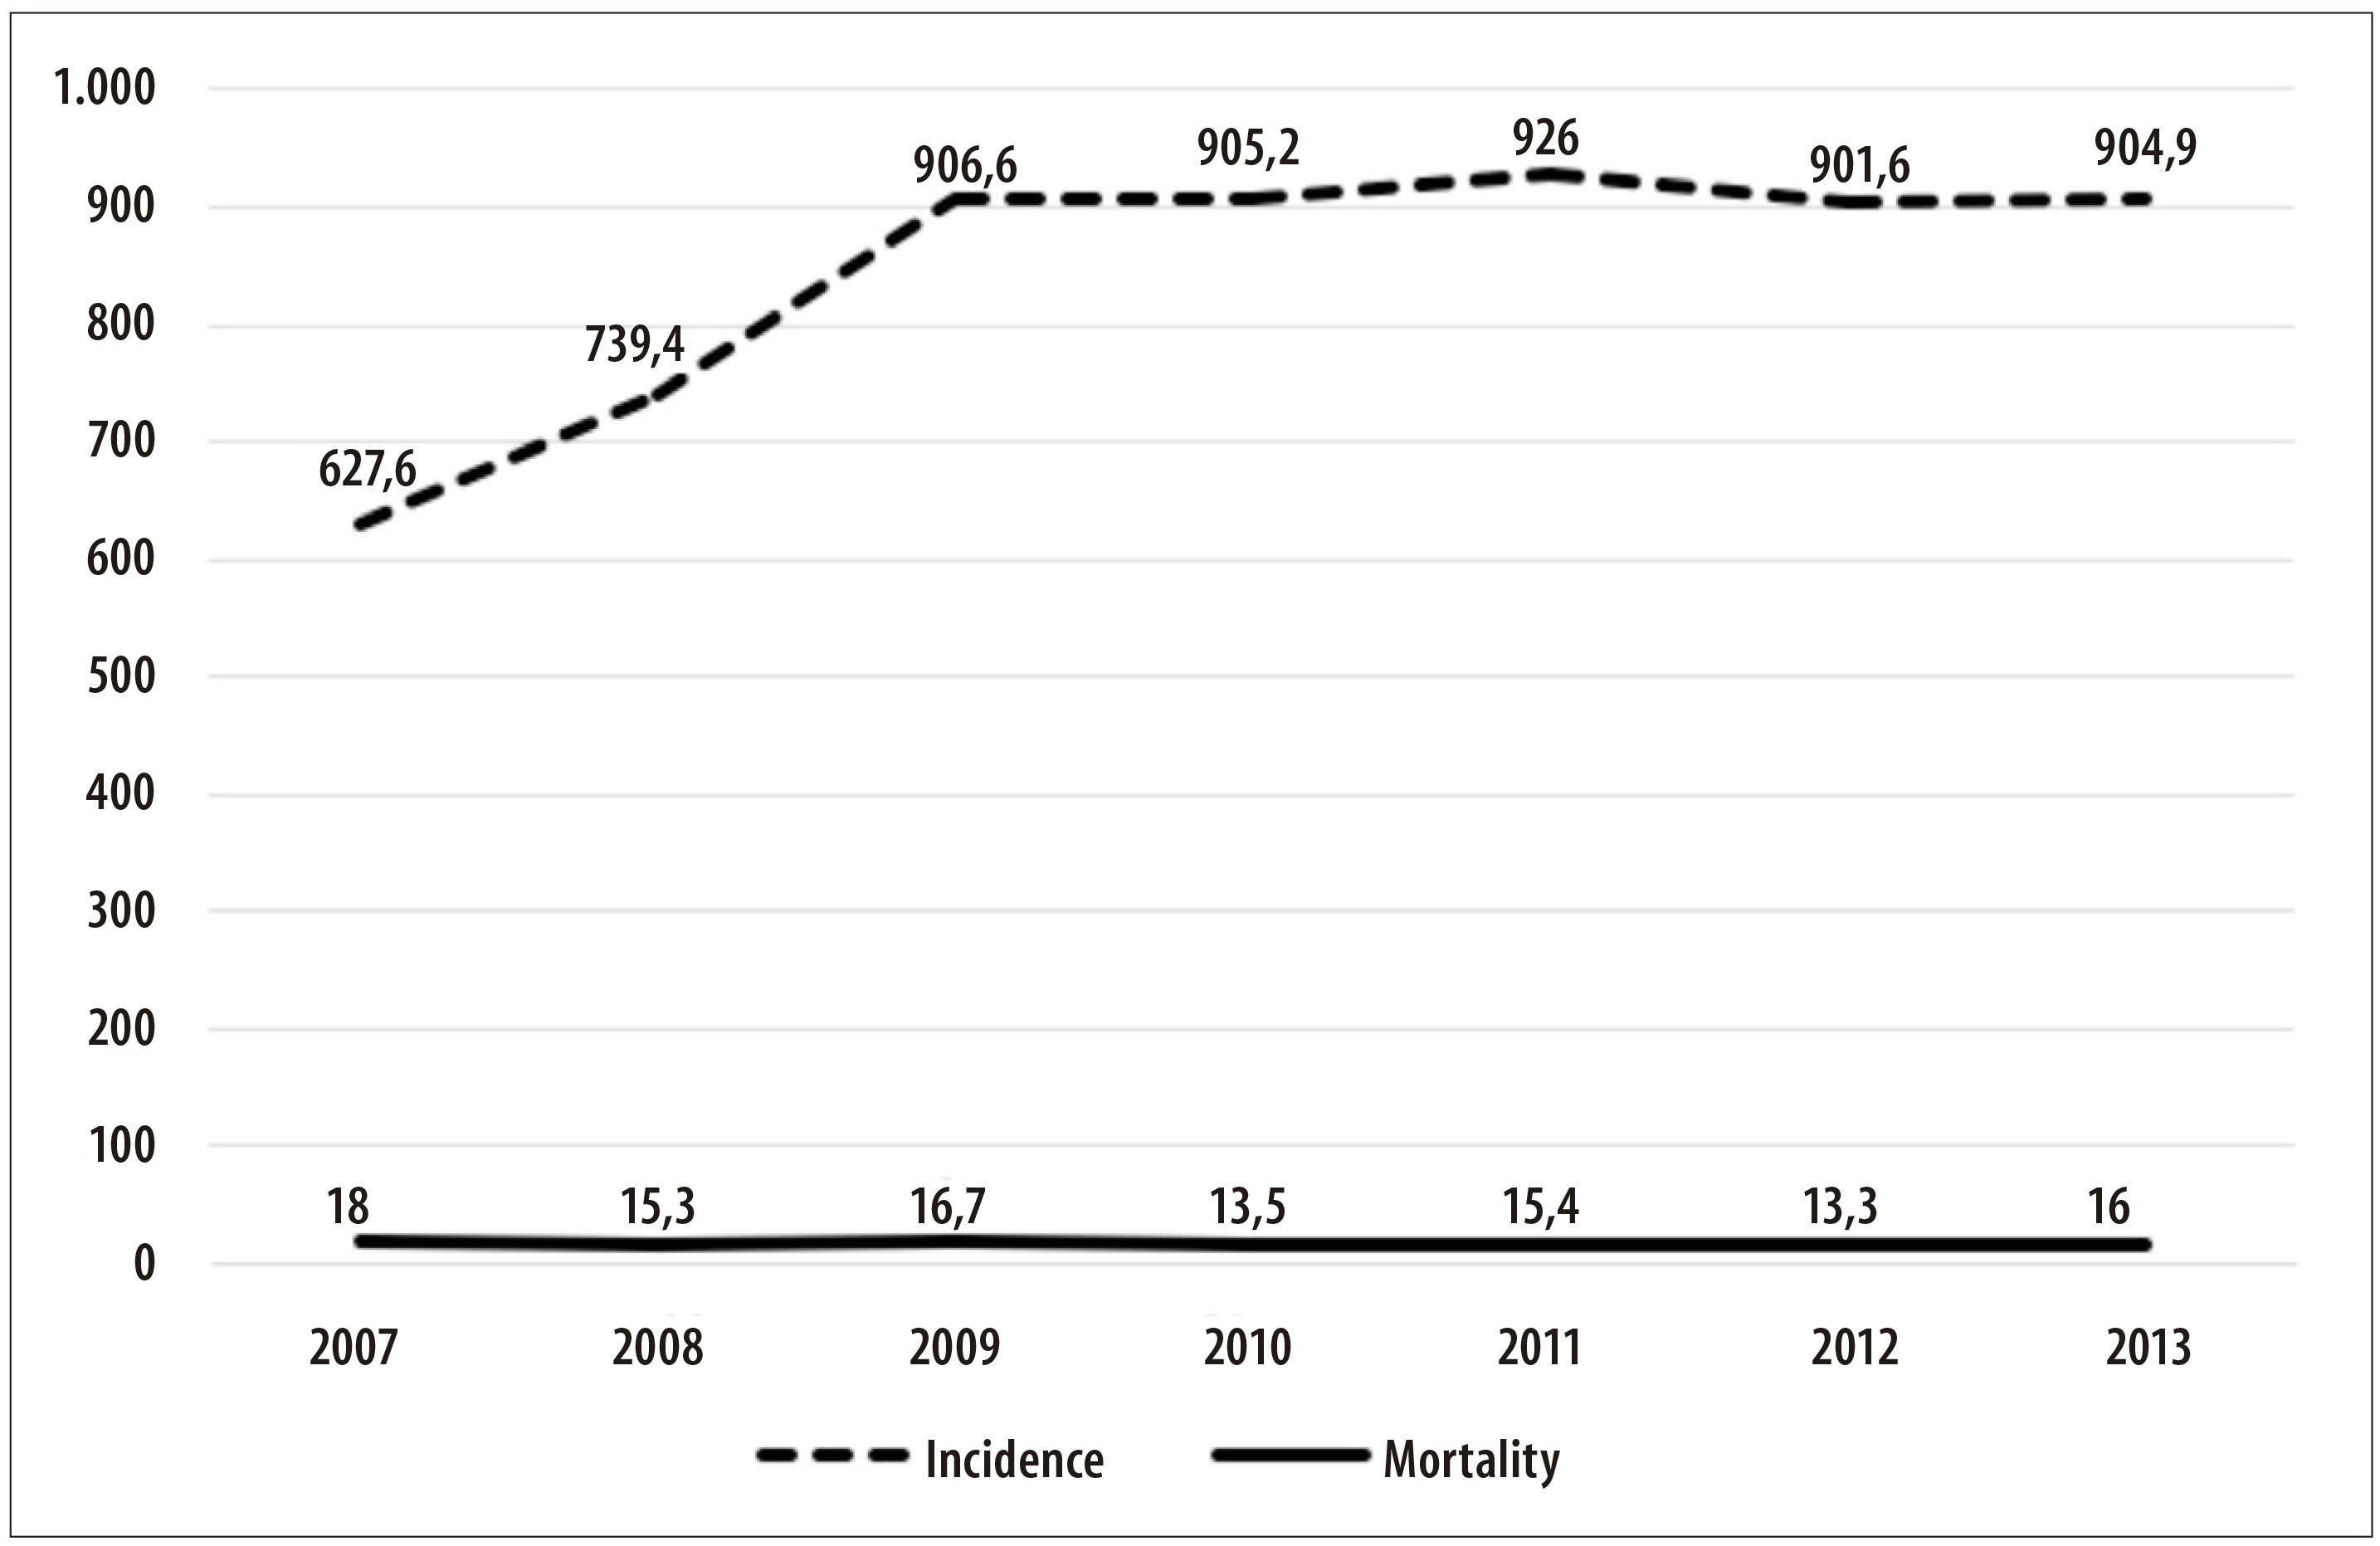
Figure 1 - Incidence and mortality rates due to tuberculosis in the population deprived of liberty (per 100 thousand individuals), Brazil, 2007-2013
The proportion of TB cases tested for HIV was of 61.1% for the period and increased throughout the years, from 40.9% in 2007 to 71.5% in 2013, whilst the proportion of TB-HIV coinfection was of 9.3% in the same period. The proportion of TB cases that underwent DOT was of 61.0%. The proportion of TB retreatment was of 22.8% (Table 4).
Table 4 - Indicators of monitoring and assessment of tuberculosis control in the population deprived of liberty, Brazil, 2007-2013
| Indicators | 2007 | 2008 | 2009 | 2010 | 2011 | 2012 | 2013 | Total | |||||||||
|---|---|---|---|---|---|---|---|---|---|---|---|---|---|---|---|---|---|
| N a D b | % | N a D b | % | N a D b | % | N a D b | % | N a D b | % | N a D b | % | N a D b | % | N a D b | % | ||
| Proportion of TB casesc tested for HIVd | 1,408/3,443 | 40.9 | 2,011/4,296 | 46.8 | 3,182/5,414 | 58.8 | 3,578/5,657 | 63.2 | 3,972/6,108 | 65.0 | 4,179/6,257 | 66.8 | 4,942/6,908 | 71.5 | 23,272/38,083 | 61.1 | |
| Proportion of TBc-HIVdcoinfection | 266/2,652 | 10.0 | 338/3,338 | 10.1 | 411/4,294 | 9.6 | 444/4,492 | 9.9 | 449/4,765 | 9.4 | 409/4,941 | 8.3 | 436/5,262 | 8.3 | 2,753/29,744 | 9.3 | |
| Proportion of TB casesc who underwent DOTe | 1,576/2,652 | 59.4 | 1,585/3,338 | 47.5 | 2,427/4,294 | 56.5 | 2,977/4,492 | 66.3 | 3,241/4,765 | 68.0 | 3,589/4,941 | 72.6 | 2,746/5,262 | 52.2 | 18,141/29,744 | 61.0 | |
| Proportion of TBc retreatment cases | 575/2,652 | 21.7 | 718/3,338 | 21.5 | 892/4,294 | 20.8 | 942/4,492 | 21.0 | 1,097/4,765 | 22.8 | 1,129/4,941 | 22.8 | 1,437/5,262 | 27.3 | 6,780/29,744 | 22.8 | |
| Proportion of TBc cured cases | 1,983/3,443 | 57.6 | 2,565/4,296 | 59.7 | 3,816/5,414 | 70.5 | 4,017/5,657 | 71.0 | 4,474/6,108 | 73.2 | 4,470/6,257 | 71.4 | 4,799/6,908 | 69.5 | 26,124/38,083 | 68.6 | |
| Proportion of TBc dropout cases | 364/3,443 | 10.6 | 475/4,296 | 11.1 | 663/5,414 | 12.2 | 630/5,657 | 11.1 | 638/6,108 | 10.4 | 655/6,257 | 10.5 | 659/6,908 | 9.5 | 4,084/38,083 | 10.7 | |
| Proportion of TBc cases closed due to death | 173/3,443 | 5.0 | 173/4,296 | 4.0 | 225/5,414 | 4.1 | 235/5,657 | 4.1 | 231/6,108 | 3.8 | 207/6,257 | 3.3 | 236/6,908 | 3.4 | 1,480/38,083 | 3.9 | |
| Proportion of TBc cases with informed closure | 2,251/2,652 | 84.9 | 2,831/3,338 | 84.8 | 4,152/4,294 | 96.7 | 4,283/4,492 | 95.3 | 4,635/4,765 | 97.2 | 4,639/4,941 | 93.9 | 4,859/5,262 | 92.3 | 27,650/29,744 | 92.9 | |
a) N: absolute number
b) D: denominator
c) TB: tuberculosis
d) HIV: human immunodeficiency virus
e) DOT: direct observed treatment
With regard to closure, the proportion of TB cases cured was of 68.6% for the period, being higher in 2011 (73.2%) when compared to 2007 (57.6%) and 2013 (69.5%). The proportion of dropouts was of 10.7%, without important variation throughout the period. The proportion of closure due to deaths (per TB and other causes) was 3.9% in the period and presented a reduction from 5.0% (2007) to 3.4% (2013). The proportion of TB cases with informed closure was 92.9%, although it presented oscillation, with a peak in 2011 (97.2%) (Table 4).
Discussion
From 2007 to 2013, 619,270 cases of TB were notified in the Brazilian population; of those, 39,083 (6.3%) were notified in the imprisoned population, representing an expressive magnitude in this vulnerable population.12
Data of the Brazilian population has shown higher TB incidence among males;13 however, this present study showed a TB prevalence higher among women inmate. Studies suggest that women are more susceptible to progression of latent infection into active disease, being pertinent to consider the prison environment as a potential onset of tuberculosis among women inmates.14,15
Although the number of inmates of ethnicity/skin color indigenous and Asian represent a minority among Brazilian the imprisoned population, the prevalence among those groups stood out, which is also observed in free individuals;16 as well as low education level individuals, since there is direct association between TB and this characteristic.17 The higher prevalence among older individuals (over 60 years old) was also observed in other studies, due to the lower immunity of this age group.18
Corroborating with previous studies,19 we observed among the imprisoned population a higher number of new cases, followed by recurrences, in the whole period, similar to the general population. Referral proportions were similar between inmate and the general population in the first years, however there was a decrease among the imprisoned population over the period.20
In general, the TB closure situations oscillated throughout the years for both the inmate and general population. The percentage of cure did not exceed 75% and dropouts accounted for about 10% in both populations, meaning it did not reach the targets set by the Ministry of Health of over 85% for cure and less than 5% of dropouts.1 Cases closed as multidrug-resistant tuberculosis (MDR-TB) in the general population did not exceed 0.2%,20 whereas among the imprisoned population the percentages were a little higher, with a 0.5% peak in 2011. Currently, MDR-TB represents a challenge for TB control, due to the high number of deaths and dropouts among those patients, which confirms the complexity of clinical management of those cases.21
The incidence rate of TB among the imprisoned population increased throughout the studied period. The number of new cases of the disease duplicated from 2007 to 2013, which differs from what has been observed for the general population for the same period, which accounted 37.99 cases per 100 thousand inhabitants in 2007 and 35.35 cases per 100 thousand inhabitants in 2013.22 The incidence rate recorded for the imprisoned population was, approximately, 16 times higher than the general population in 2007 and 25 times higher than in 2013.
Previous studies showed that between 2007 and 2012, there was an increase of 85.3% new TB cases in the imprisoned population, which can be possibly attributed to the reinforcement in the search for respiratory symptomatic individuals and to disease surveillance in prisons. Moreover, centers of clinical and laboratory diagnosis have been created in prisons of Rio Grande do Sul, Pernambuco, Rio de Janeiro, Maranhão, Ceará and Amazonas States, assisting cases diagnosis,9 not to mention the presence of health care units in several Brazilian prisons. Since there is a high risk of tuberculosis contamination in prisons, which has been previously proved,23 it is essential to identify possible symptoms still in the gateways of prisons, as well as to conduct active searches periodically in all the unit’s population.1
With regard to mortality rate, we observed a similar situation between the imprisoned population and the general population: mortality rate due to TB in Brazil, in 2007, was of 2.49 deaths per 100 thousand inhabitants, and in 2013, of 2.27 deaths per 100 thousand inhabitants.22 Just as the incidence rate, the mortality rate in the imprisoned population is still higher than what is found among the general population. Among the infectious and parasitic diseases, TB ranked third for causes of death in the period from 2001 to 2013,22 which emphasizes the importance of prevention and control of the disease.
Considering that active TB is the condition with the highest impact in mortality due to Aids,24 it is essential to asses this indicator of proportion in TB cases tested for HIV. The Ministry of Health recommends that 100% of cases should be tested; however, we still observe a high number of examination results ‘in progress’ at Sinan.1 Approximately 60% of the new cases of TB notified in Brazil in 2011, received the result of the anti-HIV test.24 The proportion of cases tested for HIV has increased over the years, for both the imprisoned population and general population.20 Some factors may have contributed to this increase, such as the introduction of rapid tests, which minimized the waiting time for the result.20
The indicator of proportion of TB-HIV coinfection enables the dimensioning and planning of joint activities with the Department of Surveillance, Prevention and Control of Sexually Transmitted Infections, HIV/AIDS and Viral Hepatitis; however it is restricted when there is high proportion of exams in progress, not conducted, or without information.1 According to WHO’s Global Report on Tuberculosis Control, people living with HIV/AIDS are 21 to 34 times more susceptible to develop active TB when compared to the general population.23 Among the interventions to control coinfection, we could highlight the timely testing in all TB cases, early TB diagnosis, treatment of active and latent TB, and timely start of antiretroviral therapy.25 In 2010, among the new TB cases notified in the general population, about 10% presented coinfection TB-HIV.12 In that same year, this proportion among imprisoned population was of 9.9%, which shows data equivalence. A study conducted in 2013, in prisons located in Mato Grosso do Sul State, showed that 1.6% of the male inmates and 1.9% of female inmates were HIV positive.26
The proportion of new TB cases who underwent DOT in the general population increased from 33.4% in 2007 to 42.2% in 2010, representing an annual increment of cases under DOT of 8.2%, on average. With regard to imprisoned population, no growth was observed. Still, we can notice, in general, the higher proportion of cases under DOT in imprisoned population than in the rest of the population.
The proportion of TB retreatment in the general population in 2009 was of 11.7%, whilst in 2013, it was of 13.8%, remaining constant throughout the period.25 Among imprisoned population it was higher, accounting 20.8% of cases in 2009 and 27.3% in 2013. A high proportion of TB retreatment cases shows bad quality of treatment, possibly due to the lack of adherence, mistakes in the medicines prescription or inadequate follow-up of cases.1
The indicators of TB cured cases, dropouts and deaths reflect the treatment effectiveness, allowing a situational diagnosis of the disease closure. Moreover, the lack of information on the closure of cases hampers the achievement of the cure targets established.1 SUS Pact for Life27 (Pacto pela Vida) establishes that the TB cases must be timely closed at Sinan. The target established for 2010 and 2011 was of, respectively, 90% and 95% of new cases of TB with informed closure.28 In 2010, the proportion of imprisoned population cases with informed closure was of 94.8%, and in 2011, of 97.2%, reaching the established targets.
Since this is a secondary data study, it is important to mention some potential limitations, such as possible duplicities, low completeness or underreporting. The data used in this research were submitted to qualification processes (records linkage and duplicity analysis), by qualified professionals from the municipal, state and national levels. Therefore, we know that underreporting of cases at Sinan can mask the magnitude of TB indicators. Although it can be complex to estimate the variation between the number of real TB cases and those notified at Sinan, the NPTC usually performs data collection from other sources, aiming at minimizing the occurrence of this problem.29 Understanding data quality is essential in order to effectively contribute for TB surveillance in all populations.29 Some tools can help reduce notification errors and underreporting. A study which conducted linkage between Sinan and SIM databases revealed an increase in the percentage of deaths due to TB, ranging around 15%.29
Another limitation of the present study refers to the calculation of the mortality rate for TB among the imprisoned population - which was adapted - from the outcome death for TB at Sinan. This strategy, possibly, resulted in an underestimation of the rate. Future studies should use linkage techniques between SIM and Sinan, in order to have a more accurate number of deaths among the imprisoned population.
Furthermore, due to the complexity of the topic TB among the imprisoned population and the lack of studies in this area, it is important to highlight that this research, by using a secondary database, is an appropriate alternative, mainly when the proposal is to identify the limitations of the information systems and encourage their improvement. It is worth considering that, when well handled, the use of secondary data presents important advantages, such as wide population coverage, low cost and time for research.
In 2014, the World Health Assembly approved the Post-2015 Global Strategy Against Tuberculosis, establishing targets to reduce incidence and mortality rates up to 2035 and proposing pillars in order to fulfill them.30 Pillar 1, specifically, refers to prevention and integrated care with the patient, through diagnosis and active search in vulnerable populations, among other actions,30 being necessary to bring together partners from Social Protection, Labor, Immigration and Justice areas.
Knowing the vulnerable populations, such as the imprisoned population, and ensuring its visibility constitutes a first step to plan and implement intervention measures for this group, in order to positively impact the general indicators of the disease in the country and worldwide.
REFERENCES
1. Ministério da Saúde (BR). Secretaria de Vigilância em Saúde. Programa Nacional de Controle da tuberculose. Manual de recomendações para o controle da tuberculose no Brasil [Internet]. Brasília: Ministério da Saúde; 2011 [citado 2017 ago 17]. 284 p. Disponível em: Disponível em: http://bvsms.saude.gov.br/bvs/publicacoes/manual_recomendacoes_controle_tuberculose_brasil.pdf [ Links ]
2. World Heatlh Organization. Global tuberculosis report 2016 [Internet]. Geneva: World Heatlh Organization; 2016 [cited 2017 Aug 17]. 214 p. Available in: Available in: http://apps.who.int/iris/bitstream/10665/250441/1/9789241565394-eng.pdf?ua=1 [ Links ]
3. Ministério da Saúde (BR). Secretaria de Vigilância em Saúde. Perspectivas brasileiras para o fim da tuberculose como problema de saúde pública. Bol Epidemiológico [Internet]. 2016[citado 2017 mai 26];47(13):1-15. Disponível em: Disponível em: http://portalarquivos.saude.gov.br/images/pdf/2016/marco/24/2016-009-Tuberculose-001.pdf [ Links ]
4. Ministério da Saúde (BR). Secretaria de Vigilância em Saúde. Departamento de Análise de Situação em Saúde. Saúde Brasil 2013: uma análise da situação de saúde e das doenças transmissíveis relacionadas à pobreza [Internet]. Brasília: Ministério da Saúde; 2014 [citado 2017 ago 17]. 384 p. Disponível em: Disponível em: http://bvsms.saude.gov.br/bvs/publicacoes/saude_brasil_2013_analise_situacao_saude.pdf [ Links ]
5. Ministério da Justiça (BR). Departamento Penitenciário Nacional. Levantamento nacional de informações penitenciárias Infopen: junho de 2014 [Internet]. Brasília: Ministério da Justiça; 2015 [citado 2017 ago 17]. 148 p. Disponível em: Disponível em: http://www.justica.gov.br/noticias/mj-divulgara-novo-relatorio-do-infopen-nesta-terca-feira/relatorio-depen-versao-web.pdf [ Links ]
6. Ministério da Saúde (BR). Secretaria de Vigilância em Saúde. Tuberculose: populações vulneráveis [Internet]. 2015 [citado 2016 fev 26]. Disponível em: Disponível em: http://portalsaude.saude.gov.br/index.php/o-ministerio/principal/leia-mais-o-ministerio/743-secretaria-svs/vigilancia-de-a-a-z/tuberculose/l2-tuberculose/11941-viajantes-tuberculose [ Links ]
7. Ministério da Saúde (BR). Secretaria de Vigilância em Saúde. Departamento de Vigilância das Doenças Transmissíveis. Avaliação da gestão do programa nacional de controle da tuberculose [Internet]. Brasília: Ministério da Saúde; 2015 [citado 2017 ago 17]. 36 p. Disponível em: Disponível em: http://bvsms.saude.gov.br/bvs/publicacoes/avaliacao_gestao_programa_nacional_controle_tuberculose.pdf [ Links ]
8. Malhão TA, Oliveira GP, Codennoti SB, Moherdaui F. Evaluation of data completeness in the tuberculosis notification information system, Brazil, 2001-2006. Epidemiol Serv Saúde. 2010 jul-set;19(3):245-56. [ Links ]
9. Ministério da Saúde (BR). Secretaria de Vigilância em Saúde. Tuberculose: alinhada com o social, afinada com a tecnologia. Bol Epidemiológico [Internet]. 2013[citado 2016 fev 27];44(2):1-6. Disponível em: Disponível em: http://portalarquivos.saude.gov.br/images/pdf/2014/maio/06/boletim2-2013-tb-web.pdf [ Links ]
10. Ministério da Justiça (BR). Relatórios estatísticos - analíticos do sistema prisional brasileiro [Internet]. 2016 [citado 2016 out 20]. Disponível em: Disponível em: http://www.justica.gov.br/seus-direitos/politica-penal/transparencia-institucional/estatisticas-prisional/relatorios-estatisticos-analiticos [ Links ]
11. Ministério da Saúde (BR). Serviço de informação ao cidadão [Internet]. 2016 [citado 2016 fev 28]. Disponível em: Disponível em: http://portalsaude.saude.gov.br/index.php/acesso-a-informacao [ Links ]
12. Ministério da Saúde (BR). Secretaria de Vigilância em Saúde. Especial tuberculose. Bol Epidemiológico [Internet]. 2012 mar[citado 2016 fev 28];43:1-12. Disponível em: Disponível em: http://portalarquivos.saude.gov.br/images/pdf/2014/julho/23/BE-2012-43-Mar--o---Especial-Tuberculose.pdf [ Links ]
13. Ministério da Saúde (BR). Secretaria de Vigilância em Saúde. Departamento de Vigilância das Doenças Transmissíveis. Panorama da tuberculose no Brasil: indicadores epidemiológicos e operacionais [Internet]. Brasília: Ministério da Saúde; 2014 [citado 2017 ago 17]. 92 p. Disponível em: Disponível em: http://bvsms.saude.gov.br/bvs/publicacoes/panorama%20tuberculose%20brasil_2014.pdf [ Links ]
14. Holmes CB, Hausler H, Nunn P. A review of sex differences in the epidemiology of tuberculosis. Int J Tuberc Lung Dis. 1998 Feb;2(2):96-104. [ Links ]
15. Belo MTCT, Luiz RR, Hanson C, Selig L, Teixeira EG, Chalfoun T, et al. Tuberculose e gênero em um município prioritário no estado do Rio de Janeiro. J. Bras Pneumol. 2010 set-out;36(5):621-5. [ Links ]
16. Basta PC, Marques M, Oliveira RL, Cunha EAT, Resendes APC, Souza-Santos R. Desigualdades sociais e tuberculose: análise segundo raça/cor, Mato Grosso do Sul. Rev Saúde Pública. 2013 out;47(5):854-64. [ Links ]
17. San Pedro A, Oliveira RM. Tuberculose e indicadores socioeconômicos: revisão sistemática da literatura. Rev Panam Salud Publica. 2013 abr;33(4):294-301. [ Links ]
18. Oliveira AAV, Sá LD, Nogueira JA, Andrade SLE, Palha PF, Villa TCS. Diagnóstico da tuberculose em pessoas idosas: barreiras de acesso relacionadas aos serviços de saúde. Rev Esc Enferm USP. 2013 fev;47(1):145-51. [ Links ]
19. Macedo LR, Reis-Santos B, Riley LW, Maciel EL. Treatment outcomes of tuberculosis patients in Brazilian prisons: a polytomous regression analysis. Int J Tuberc Lung Dis. 2013 Nov;17(11):1427-34. [ Links ]
20. Oliveira GP, Torrens AW, Bartholomay P, Barreira D. Tuberculosis in Brazil: last ten years analysis - 2001-2010. Braz J Infect Dis. 2013 Mar-Apr;17(2):218-33 [ Links ]
21. Ministério da Saúde (BR). Secretaria de Vigilância em Saúde. Detectar, tratar e curar: desafios e estratégias brasileiras frente à tuberculose. Bol Epidemiológico [Internet]. 2015 [citado 2016 fev 25];46(9):1-19. Disponível em: Disponível em: http://portalarquivos.saude.gov.br/images/pdf/2015/marco/27/2015-007---BE-Tuberculose---para-substitui----o-no-site.pdf [ Links ]
22. Ministério da Saúde (BR). Sala de Apoio a Gestão Estratégica (SAGE). Indicadores de morbidade. Tuberculose [Internet]. 2016 [citado 2016 abr 11]. Disponível em: Disponível em: http://189.28.128.178/sage/ [ Links ]
23. Sacchi FPC, Praça RM, Tatara MB, Somonsen V, Ferrazoli L, Croda MG, et al. Prisons as reservoir for community transmission of tuberculosis, Brazil. Emerg Infect Dis. 2015 Mar;21(3):452-5. [ Links ]
24. Ministério da Saúde (BR). Secretaria-Executiva. Recomendações para o manejo da coinfecção TB-HIV em serviços de atenção especializada a pessoas vivendo com HIV/AIDS [Internet]. Brasília: Ministério da Saúde; 2013 [citado 2017 ago 17]. 28 p. Disponível em: Disponível em: http://bvsms.saude.gov.br/bvs/publicacoes/recomendacoes_manejo_coinfeccao_tb_hiv.pdf [ Links ]
25. Ministério da Saúde (BR). Gabinete do Ministro. Secretaria de Vigilância em Saúde. Situação epidemiológica da tuberculose nos estados partes e associados do Mercosul 2009 a 2013 = Situación Epidemiológica de la Tuberculosis en los Estados Partes y Asociados del Mercosur 2009 a 2013 [Internet]. Brasília: Ministério da Saúde; 2015 [citado 2017 ago 17]. 56 p. Disponível em: Disponível em: http://www.riocomsaude.rj.gov.br/Publico/MostrarArquivo.aspx?C=Qlc8jVAKFFQ%3D [ Links ]
26. Carbone Ada S, Paião DS, Sgarbi RV, Lemos EF, Cazanti RF, Ota MM, et al. Active and latent tuberculosis in Brazilian correctional facilities: a cross-sectional study. BMC Infect Dis. 2015 Jan;15:24. [ Links ]
27. Ministério da Saúde (BR). Secretaria-Executiva. Coordenação de Apoio à Gestão Descentralizada. Diretrizes operacionais para os pactos pela vida, em defesa do SUS e de gestão [Internet]. Brasília: Ministério da Saúde; 2006 [citado 2017 ago 17]. 72 p. Disponível em: Disponível em: http://bvsms.saude.gov.br/bvs/publicacoes/PactosPelaVida_Vol1DiretOperDefesaSUSeGestao.pdf [ Links ]
28. Ministério da Saúde (BR). Secretaria de Vigilância em Saúde. Instrutivo para preenchimento da programação das ações de vigilância em saúde nas unidades federadas - 2010-2011: tuberculose [Internet]. Brasília: Ministério da Saúde; 2011 [citado 2017 ago 17]. 16 p. Disponível em: Disponível em: http://telelab.aids.gov.br/index.php/biblioteca-telelab/item/download/29_e02427f1da61b3269b38f05d22fb7b18 . [ Links ]
29. Pinheiro RS, Oliveira GP, Oliveira PB, Coeli CM. Melhoria da qualidade do sistema de informação para a tuberculose: uma revisão da literatura sobre o uso do linkage entre bases de dados. In: Ministério da Saúde (BR). Saúde Brasil 2010: uma análise da situação de saúde e de evidências selecionadas de impacto de ações de vigilância em saúde [Internet]. Brasília: Ministério da Saúde; 2010 [citado 2017 ago 17]. p. 175-184. Disponível em: Disponível em: http://bvsms.saude.gov.br/bvs/publicacoes/saude_brasil_2010.pdf [ Links ]
30. World Heatlh Organization. The end TB strategy [Internet]. Geneva: World Heatlh Organization; 2015 [cited 2017 Ago 17]. 20 p. Available in: Available in: http://www.who.int/tb/End_TB_brochure.pdf [ Links ]
*Article based on the PhD thesis by Laylla Ribeiro Macedo, entitled ‘Tuberculosis in vulnerable populations: factors associated to illness and treatment outcome’, to be defended at the Post-graduation Program in Epidemiology and Public Health, of the National School of Public Health Sergio Arouca, of Oswaldo Cruz Institute, in 2018.
Received: February 22, 2017; Accepted: July 18, 2017
 Este é um artigo publicado em acesso aberto sob uma licença Creative Commons
