


Serviços Personalizados
Journal

Artigo
 texto em
  Inglês (pdf)
 Artigo em XML
 Referências do artigo
 Curriculum ScienTI
 Enviar este artigo por email
Indicadores
-
 Citado por SciELO
Links relacionados
-
 Similares em
SciELO
Similares em
SciELO
Compartilhar

 Permalink
Epidemiologia e Serviços de Saúde
versão impressa ISSN 1679-4974versão On-line ISSN 2237-9622
Epidemiol. Serv. Saúde vol.28 no.1 Brasília mar. 2019 Epub 21-Mar-2019
http://dx.doi.org/10.5123/s1679-49742019000100008
ORIGINAL ARTICLE
Frailty prevalence and associated factors in the elderly in Southern Brazil, 2014*
1Universidade Federal de Pelotas, Programa de Pós-Graduação em Epidemiologia, Pelotas, RS, Brasil
Objective:
to analyze frailty prevalence and associated factors in the elderly in the city of Pelotas, RS, Brazil, in 2014.
Methods:
this was a cross-sectional, population-based study of a sample of individuals aged 60 years old or older; a modified version of the Edmonton Frail Scale was used to assess frailty; prevalence ratios (PR) and their 95% confidence intervals (95%CI) were estimated using Poisson regression.
Results:
frailty prevalence was 13.8% and was higher among individuals aged 75 years or older (PR 4.33 - 95%CI 2.94;6.39), those of the female gender (PR 1.46 - 95%CI 1.06;2.03) and those living without a partner (PR 1.54 - 95%CI 1.16;2.04); epilepsy (PR 3.58 - 95%CI 2.19;5.85), ischemia (PR 2.56 - 95%CI 2.00;3.28), and heart failure (PR 2.48 - 95%CI 1.92;3.19) were the morbidities most highly associated with frailty.
Conclusion:
frailty was associated with older individuals, the female gender, those living without a partner and those affected by multiple morbidities.
Keywords: Aged; Cross-Sectional Studies; Frailty; Frail Elderly; Epidemiology; Health of the Elderly
Introduction
Population aging, a phenomenon found in high-income countries, is increasing rapidly in middle- and low-income countries’. In Brazil the number of individuals aged 60 or over increased from 15.5 million (9.0%) in 2001 to 23.5 million (12.1%) in 2011.1 Aging is associated with frailty, although they cannot be considered to be synonymous. Frailty is a multidimensional syndrome involving biological, physical, psychological, cognitive, social, economic and environmental factors. It makes the elderly vulnerable to adverse events, increasing their disability and risk of functional dependence.2,3 Reduction in the autonomy of elderly people is related to reduction in quality of life and increased risk of dependency, institutionalization and premature death.4
In Brazil frailty prevalence among the elderly varied between 8.7 and 47.2%2,5-10 in the period from 2009 to 2017. National and international studies indicate that higher levels of frailty are found among older individuals,5,9,11-13 who are female,9-12,14,15 widowed or without a partner,11-13 of non-White race/skin color12 and who have less schooling.9 Moreover, the greater the number of morbidities, the greater the susceptibility of the elderly to frailty.11,13
Epidemiological studies conducted in Brazil6-8,15 have used Fried’s Frailty Phenotype to assess frailty in the elderly. This phenotype is considered to be a biological syndrome involving decline in reserves and decline in resistance to stressors.16 Notwithstanding, the broader concept of frailty involves psychological, social and environmental elements, in addition to the physical component. The Edmonton Frail Scale2,17 can be used in order to perform an assessment that includes all these aspects for clinical detection of frailty in the elderly. This scale was developed by researchers of the Canadian Initiative on Frailty and Aging (CIF-A). The Edmonton Scale is low-cost and easy to administer and is an alternative for screening for frailty in health care services.2,17
Despite the importance of frailty among the elderly population, there are few studies on the subject in low-income countries. With the aim of providing guidance for planning and implementing health policies for the elderly, including preventive and rehabilitation actions for frail individuals, the objective of this study was to analyze frailty prevalence and associated factors among elderly people living in the municipality of Pelotas, Rio Grande do Sul, Brazil.
Methods
The data used were provided by the COMO VAI? (How are you?) study - this being an acronym for the Master’s Degree Consortium Geared to Valuing Care of the Elderly (Consórcio de Mestrado Orientado para a Valorização da Atenção ao Idoso). It was a cross-sectional population-based study conducted in Pelotas, RS, between January and August 2014. Its target population was comprised of non-institutionalized individuals aged 60 years or over living in that city.
According to the Brazilian Institute of Geography and Statistics (IBGE),18 in 2010 Pelotas had 328,275 inhabitants, 46,099 of whom were elderly. Sampling was performed in two stages in order to select the individuals to be studied. In the first stage, 133 of the 488 census tracts of the city of Pelotas were selected systematically and classified according to head of household’s average income. This strategy ensured the inclusion of neighborhoods of differing economic status. We then counted the number of occupied households in the selected census tracts and estimated a ratio of approximately one elderly person per three households. Thirty-one households per census tract were then systematically selected, totaling 4,123 households. In each selected household, all dwellers aged 60 or over were eligible for the study. The exclusion criteria were: being institutionalized; or having cognitive impairment and no carer.
The final sample size for estimating frailty prevalence was 857 elderly people. This was based on an expected prevalence outcome of 30%2 with a 4% margin of error, a 95% confidence interval and a 1.5 design effect (DEFF), plus 10% for losses and refusals. Our analysis of association used a 5% significance level and 80% statistical power, plus 10% for losses and refusals and a further 10% for controlling confounding factors. We considered that 1,323 elderly people would be the largest sample needed to estimate (i) association between morbidity score taking a non-exposed / exposed ratio of 1:4, and (ii) frailty taking a prevalence ratio greater than 1.5.
The households were visited by a group of 23 interviewers with complete high school education. They received 40 hours of training in administering the questionnaire. The questionnaire was tested beforehand by means of a pilot study with elderly people from the same population. Initially the interviewers identified household dwellers (name, age, sex) and checked whether there was an eligible dweller. Following this, standardized electronic questionnaires were administered using notebook computers. If there was no one at home, at least three further attempts were made in order to carry out the interviews at each household.
The dependent variable was frailty, which was assessed by means of items based on the Portuguese version of the Edmonton Frail Scale (EFS).2,17 The nine EFS domains were assessed: cognition, general health status, functional independence, social support, medication use, nutrition, mood, continence and functional performance of the elderly. EFS assesses the ‘cognition’ domain using the so-called “clock test”; however, this test may classify individuals with low schooling as having cognitive problems and for this reason we opted to assess this item according to self-reported ability of the elderly person to answer the questionnaire unassisted, with the help of a carer, or the questionnaire being answered only by the carer if the elderly person was unable to answer on their own. These options received a score of zero, 1 or 2 respectively. All the remaining domains were assessed according to the EFS model: the scale uses one to two questions for each domain and generates a 17-point score. Based on the score obtained, the individuals were classified according to degree of frailty: not frail (0-4 points), vulnerable (5-6 points), mild frailty (7-8 points), moderate frailty (9-10 points) or severe frailty (11-17 points). The following dichotomous variable was used for the dependent variable (frailty): not frail (0-6 points) or frail (7-17 points).
The independent variables observed were:
a) Demographic characteristics
- sex (male; female);
- age (in full years: 60-64; 65-69; 70-74; 75 or over);
- race/skin color, as observed by the interviewer (White; other [Black, brown, yellow or indigenous]); and
- marital status (has a partner; does not have a partner).
b) Socio-economic characteristics
- family income (in minimum wages: up to R$724.00 [≤1]; R$724.00-R$2172.00 [1,1-3]; R$2,172.01-R$3,620.00 [3,1-5]; R$3,620.01-R$7,240.00 [5,1-10]; R$7,241.01 or over [>10]);
- economic status, according to the classification used by the Brazilian Association of Survey Companies (Associação Brasileira de Empresas de Pesquisa - ABEP)19 for the year 2010 (divided into three categories: A/B; C; D/E); and
- schooling (in completed years of study: none; 1-3; 4-7; 8-11; and 12 or over);
c) Self-reported morbidities
In reply to the question “Has a doctor or a health worker ever told you that you have...”, the following morbidities were self-reported: systemic arterial hypertension, diabetes mellitus, heart problems, heart failure, emphysema, ischemia or stroke, arthritis or rheumatism, Parkinson’s disease, kidney failure, epilepsy or convulsions, osteoporosis, glaucoma and cancer. A score was given for the number of morbidities affecting the interviewee: none; 1-3; 4 or more.
d) Behavioral characteristics
- tobacco smoking (no; yes; former smoker);
- CAGE20 (Cut down, Annoyed by criticism, Guilty and Eye-opener), used in relation to the person’s perception of their dependence on alcoholic drink: negative: up to 1 positive reply; positive: two or more positive replies); and
- physical activity during leisure time, as assessed by the International Physical Activity Questionnaire (IPAQ)21 and dichotomized into insufficiently active (up to 150 minutes a week) or active (more than 150 minutes a week).
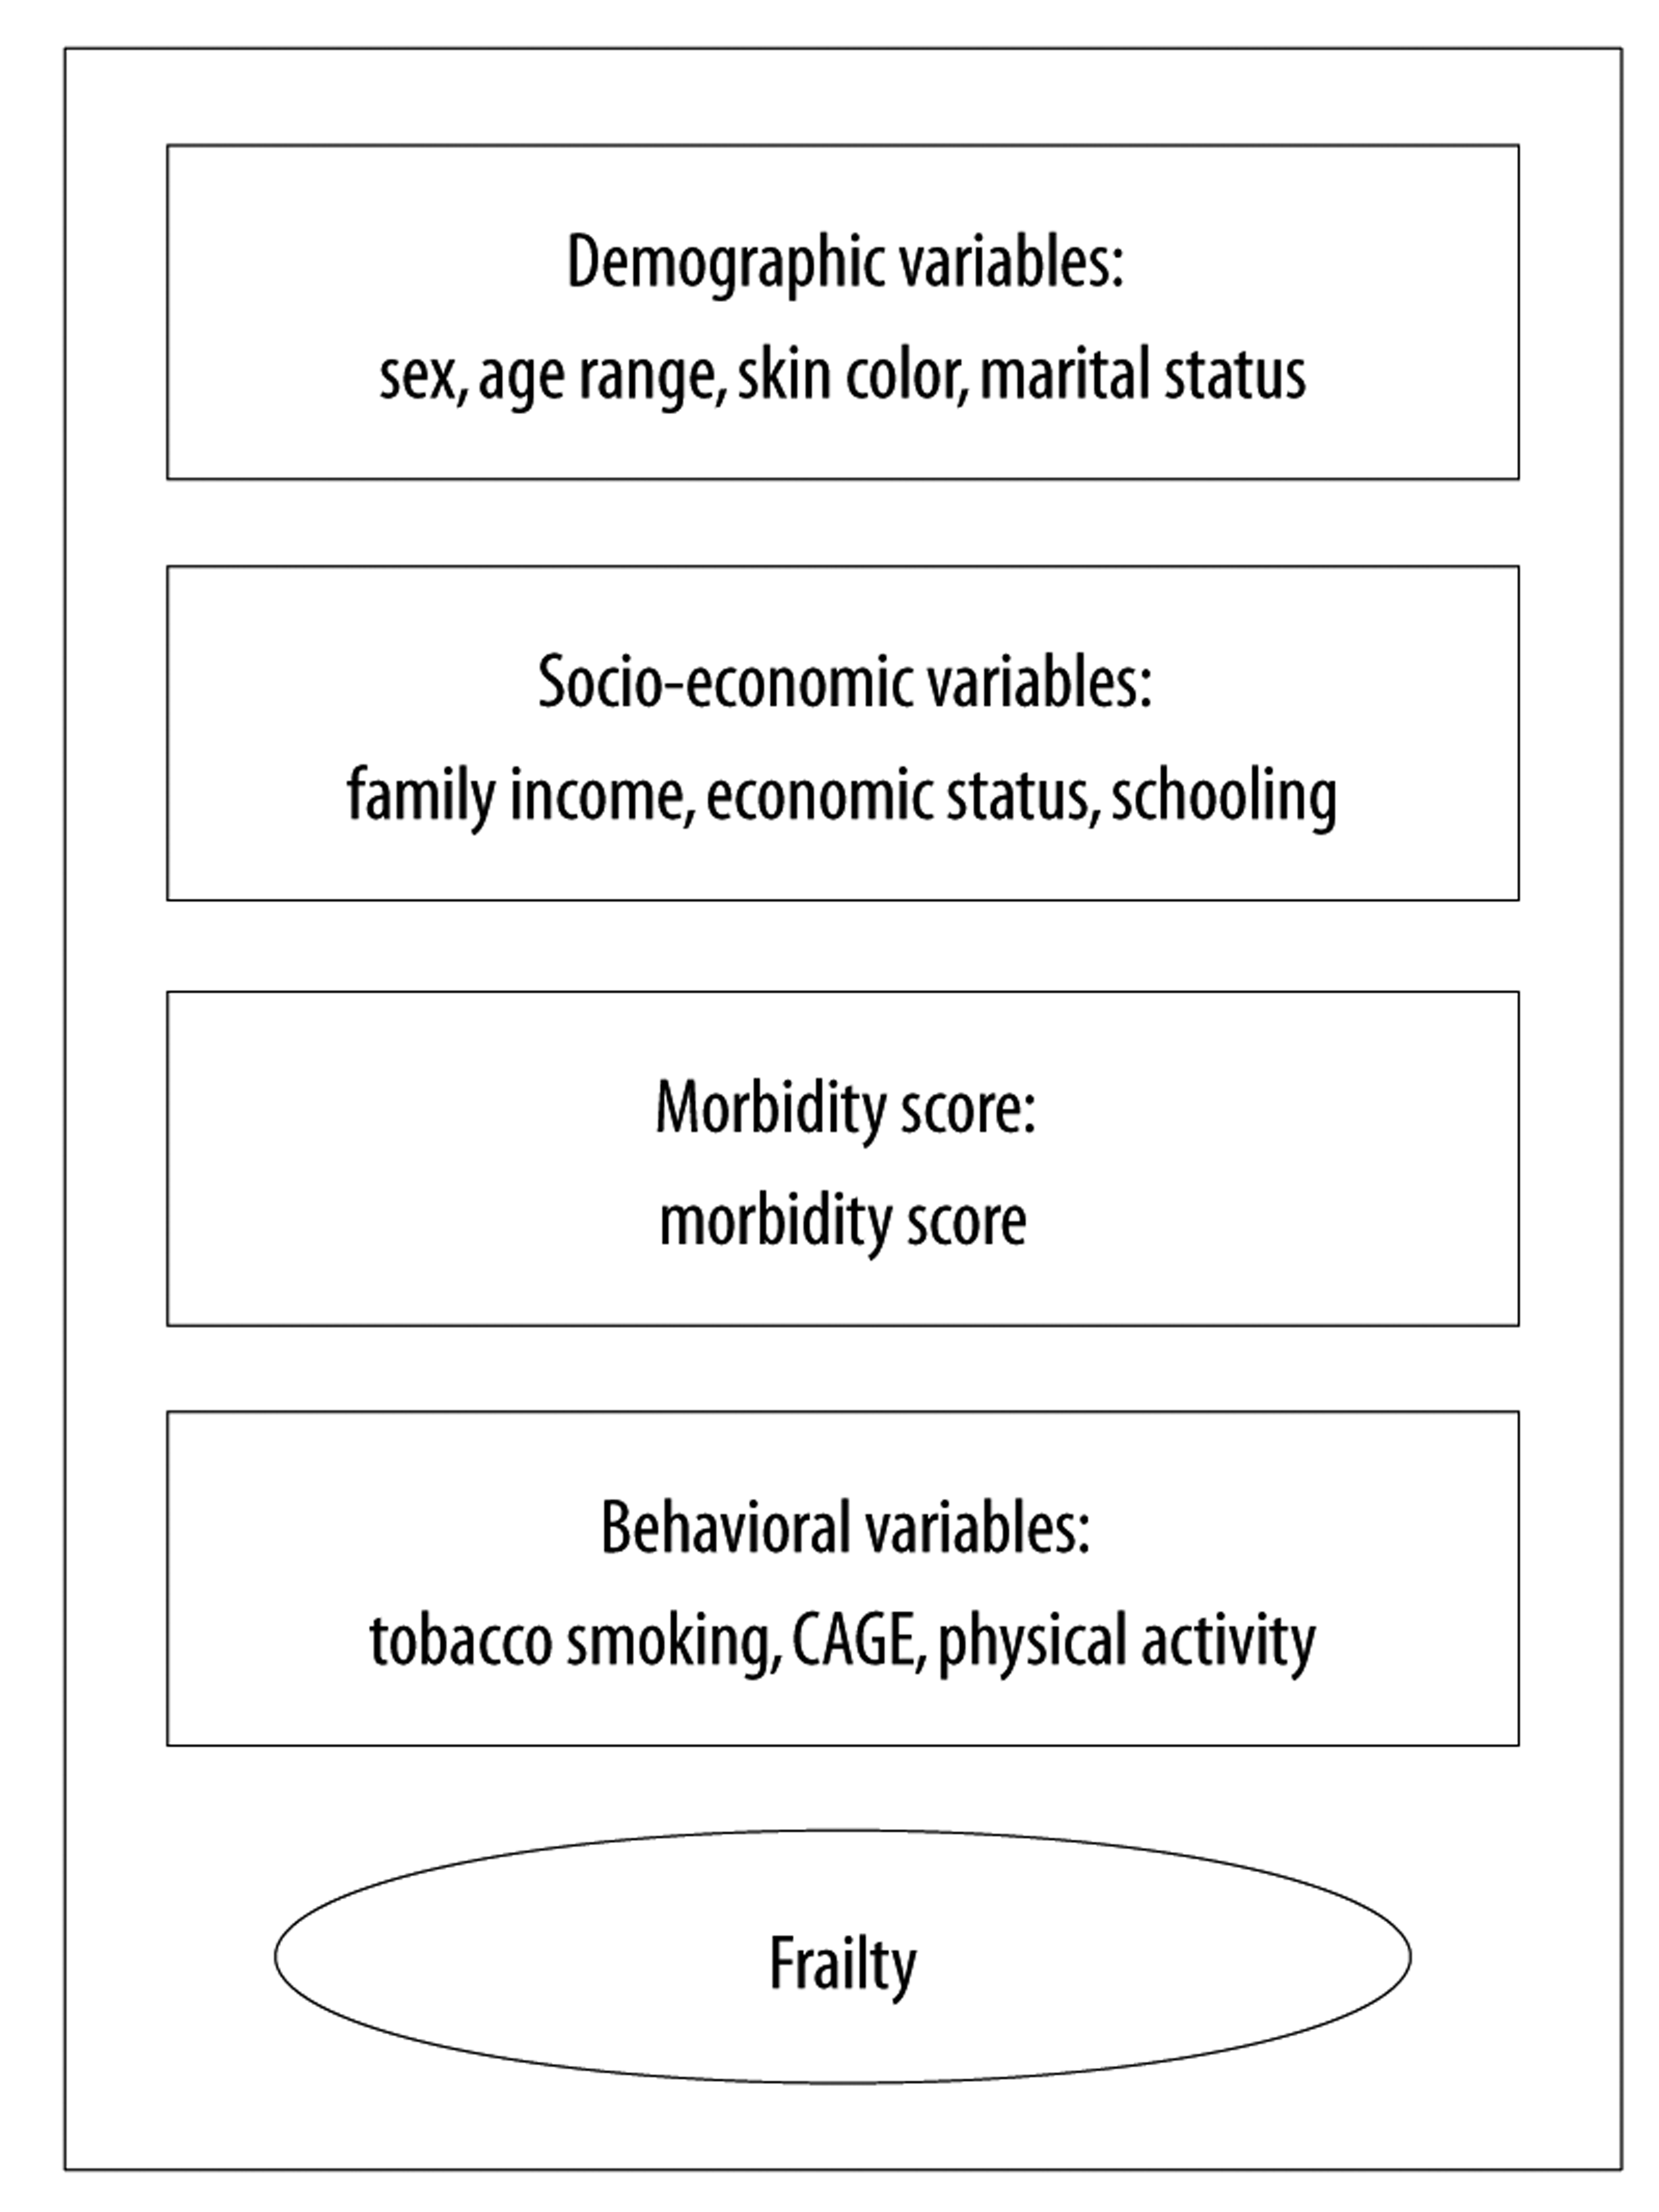
Initially we described the prevalence of the independent variables and the prevalence of the ‘frailty’ outcome. We then performed crude and adjusted analysis to assess association between the independent variables and the dichotomous outcome. We used Poisson regression with robust variance to calculate the prevalence ratios (PR) and their respective 95% confidence intervals (95%CI), taking design effect into consideration. We performed the multiple analysis using a hierarchical model22 with backward selection, with the demographic variables on the first level, the socio-economic variables on the second level, the morbidity score on the third level and the behavioral variables on the fourth level (Figure 1). Statistical association was assessed using the Wald heterogeneity and linear trend tests. Variables having significant association with the outcome in the crude analysis were included in the multiple model. Associations having a p value less than or equal to 0.05 were considered to be significant; independent variables associated with the outcome having a p value less than 0.2 were kept in the multiple model to control for confounding factors. The analyses were performed using Stata 12.1 (Stata Corp., College Station, TX, USA).
The COMO VAI? study was approved by the Federal University of Pelotas Faculty of Medicine Research Ethics Committee: Opinion No. 472.357, Certificate of Submission for Ethical Appraisal (CAAE) No. 24538513.1.0000.5317, on November 28th 2013. In order to take part in the interview, each subject signed a Free and Informed Consent Form. The confidentiality of the information provided and the right to refuse to take part in the study were guaranteed.
Results
3,799 of the 4,123 households selected were visited. 1,379 of these households had dwellers aged 60 or over, whereby 1,844 elderly individuals eligible for the study were identified. 1,451 elderly individuals were interviewed, 1,399 of whom answered the questions on the outcome, thus enabling the frailty score to be calculated. Losses and refusals totaled 21.3%, the majority of whom were female (60.0%). This proportion was similar to the proportion of female respondents (63.0% - 95%CI 60.5;65.5) and to the proportion of those in the 60-69 age group (59.0%), but was higher than the proportion of elderly participants (52.3% - 95%CI 49.7;54.9).
63.2% of the interviewees were female, 52,7% were aged up to 69 years old, 83.7% were of White race/skin color and 53.1% lived with a partner. 42.8% of the interviewees had family income of between R$724.01 and R$2,172.00, 52.6% were of economic status C (ABEP/2010 classification) and 13.6% had no schooling. 25.4% of all the elderly had four or more morbidities, 12.6% were smokers and 33.3% were former smokers, and 1.0% had a positive CAGE assessment; 81.6% of the elderly were considered to be insufficiently active in their leisure time (Table 1).
Table 1 - Sample description according to outcome variables and exposures, Pelotas, Rio Grande do Sul, 2014
| Characteristics | n | % |
|---|---|---|
| Sex (n=1,399) | ||
| Male | 515 | 36.8 |
| Female | 884 | 63.2 |
| Age range (in full years) (n=1,398) | ||
| 60-64 | 387 | 27.7 |
| 65-69 | 350 | 25.0 |
| 70-74 | 265 | 19.0 |
| ≥75 | 396 | 28.3 |
| Race/skin color (n=1,398) | ||
| White | 1.170 | 83.7 |
| Other | 228 | 16.3 |
| Marital status (1,398) | ||
| Has a partner | 743 | 53.1 |
| Does not have a partner | 655 | 46.9 |
| Family income (in BRL) (n=1,315)a | ||
| Up to R$724.00 | 139 | 10.6 |
| R$724.01 - R$2,172.00 | 563 | 42.9 |
| R$2,172.01 - R$3,620.00 | 278 | 21.1 |
| R$3,620.01 - R$7,240.00 | 195 | 14.8 |
| R$7,241.01 or more | 140 | 10.6 |
| Economic statusb (ABEPc) (n=1,333) | ||
| A/B | 470 | 35.2 |
| C | 701 | 52.6 |
| D/E | 162 | 12.2 |
| Schooling (in completed years of study) (n=1,390) | ||
| None | 189 | 13.6 |
| 1-3 | 323 | 23.2 |
| 4-7 | 431 | 31.0 |
| 8-11 | 140 | 10.1 |
| ≥12 | 307 | 22.1 |
| Morbiditiesd (n=1,391) | ||
| None | 146 | 10.5 |
| 1-3 | 892 | 64.1 |
| ≥4 | 353 | 25.4 |
| Tobacco smoking (n=1,398) | ||
| No | 756 | 54.1 |
| Yes | 176 | 12.6 |
| Former smoker | 466 | 33.3 |
| CAGEe (n=1,391) | ||
| Negative | 1.377 | 99.0 |
| Positive | 14 | 1.0 |
| Physical activity (IPAQf) (n=1,353) | ||
| Insufficiently active | 1.104 | 81.6 |
| Active | 249 | 18.4 |
| Frailty (n=1,399) | ||
| Not frail | 973 | 69.5 |
| Vulnerable | 233 | 16.7 |
| Mild frailty | 120 | 8.6 |
| Moderate frailty | 56 | 4.0 |
| Severe frailty | 17 | 1.2 |
a) National minimum wage: R$724.00 (US$303.00 on 01/01/2014).
b) Economic status: variable with the greatest number of missing values (79).
c) ABEP: Brazilian Association of Survey Companies, 2010.
d) Morbidities: systemic arterial hypertension, diabetes mellitus, heart problems, heart failure, emphysema, ischemia, arthritis, Parkinson’s disease, kidney failure, epilepsy, osteoporosis, glaucoma and cancer.
e) CAGE: Cut down, Annoyed by criticism, Guilty and Eye-opener.
f) IPAQ: International Physical Activity Questionnaire.
Prevalence of some degree of frailty was 13.8% (95%CI 12.0;15.6). With regard to degree of frailty, 69.5% of the participants were classified as ‘not frail’, 16.7% as ‘vulnerable’, 8.6% as ‘mildly frail’, 4.0% as ‘moderately frail’ and 1.2% as ‘severely frail’ (Table 1).
When comparing by sex, females had greater differences of frailty with regard to mild frailty (10.6% compared to 5.1% among males) and moderate frailty (4.9% compared to 2.5% among males), while males were more severely frail (1.4%, compared to 1.1% among females). Greater frailty was found among the elderly who did not live with a partner (19.6%), in relation to those who did live with a partner (8.8%); however, this difference was greater for mild and moderate frailty in comparison to severe frailty. Elderly people with more morbidities were found to be frailer (no morbidities, 4.1%; 4 or more morbidities, 29.5%), whereby the differences in the proportions for moderate and severe frailty were greater (Table 2).
Table 2 - Frailty level prevalence according to final model variables, Pelotas, Rio Grande do Sul, 2014
| Independent variable | Frailty | ||||
|---|---|---|---|---|---|
| Not frail | Vulnerable | Mild | Moderate | Severe | |
| n (%) | n (%) | n (%) | n (%) | n (%) | |
| Sex (n=1,399) | |||||
| Male | 403 (78.2) | 66 (12.8) | 26 (5.1) | 13 (2.5) | 7 (1.4) |
| Female | 570 (64.5) | 167 (18.9) | 94(10.6) | 43 (4.9) | 10 (1.1) |
| Age range (in full years) (n=1,398) | |||||
| 60-64 | 314 (81.2) | 52 (13.4) | 14 (3.6) | 7 (1.8) | 0 (0.0) |
| 65-69 | 264 (75.4) | 51 (14.6) | 26 (7.4) | 7 (2.0) | 2 (0.6) |
| 70-74 | 198 (74.7) | 37 (13.9) | 20 (7.6) | 8 (3.0) | 2 (0.8) |
| ≥75 | 196 (49.5) | 93 (23.5) | 60(15.1) | 34 (8.6) | 13(3.3) |
| Marital status (n=1,398) | |||||
| Has a partner | 571 (76.8) | 107 (14.4) | 40 (5.4) | 17 (2.3) | 8 (1.1) |
| Does not have a partner | 401 (61.2) | 126 (19.2) | 80(12.2) | 39 (6.0) | 9 (1.4) |
| Schooling (in completed years of study) (n=1,390) | |||||
| None | 90 (47.7) | 49 (25.9) | 32(16.9) | 14 (7.4) | 4 (2.1) |
| 1-3 | 206 (63.8) | 61 (18.9) | 33(10.2) | 17 (5.2) | 6 (1.9) |
| 4-7 | 300 (69.6) | 77 (17.8) | 33 (7.7) | 15 (3.5) | 6 (1.4) |
| 8-11 | 111 (79.3) | 18 (12.9) | 6 (4.3) | 5 (3.5) | 0 (0.0) |
| ≥12 | 260 (84.7) | 25 (8.2) | 16 (5.2) | 5 (1.6) | 1 (0.3) |
| Morbiditiesa (n=1,391) | |||||
| None | 131 (89.7) | 9 (6.2) | 5 (3.4) | 1 (0.7) | 0 (0.0) |
| 1-3 | 690 (77.3) | 123 (13.8) | 56 (6.3) | 16 (1.8) | 7 (0.8) |
| ≥4 | 148 (41.9) | 101 (28.6) | 58(16.4) | 38(10.8) | 8 (2.3) |
| Physical activity (IPAQb) (n=1,353) | |||||
| Insufficiently active | 743 (67.3) | 204 (18.5) | 98 (8.9) | 45 (4.1) | 14 (1.2) |
| Active | 216 (86.8) | 23 (9.2) | 9 (3.6) | 1 (0.4) | 0 (0.0) |
| Total | 973 (69.5) | 233 (16.7) | 120 (8.6) | 56 (4.0) | 17 (1.2) |
a) Morbidities: systemic arterial hypertension, diabetes mellitus, heart problems, heart failure, emphysema, ischemia, arthritis, Parkinson’s disease, kidney failure, epilepsy, osteoporosis, glaucoma and cancer.
b) IPAQ: International Physical Activity Questionnaire.
Epilepsy (PR 3.58 - 95%CI 2.19;5.85), ischemia (PR 2.56 - 95%CI 2.00;3.28), heart failure (PR 2.48 - 95%CI 1.92;3.19), Parkinson’s disease (PR 2.06 - 95%CI 1.22;3.47) and diabetes mellitus (PR 2.04 - 95%CI 1.59;2.67) were the diseases most associated with frailty, after adjustment for sociodemographic variables (Table 3). Glaucoma, arthritis and emphysema were not found to have statistically significant association following adjustment.
Table 3 - Morbidity prevalence and crude and adjusted analysis of their association with frailty, Pelotas, Rio Grande do Sul, 2014
| Morbidities | %a | Crude analysis | Adjusted analysis | ||
|---|---|---|---|---|---|
| PRb (95%CIc) | p-valued | PRe (95%CIc) | p-valued | ||
| Arterial hypertension | <0.001 | <0.001 | |||
| No | 33.3 | 1.00 | 1.00 | ||
| Yes | 66.7 | 1.80 (1.30;2.48) | 1.62 (1.20;2.19) | ||
| Diabetes mellitus | <0.001 | <0.001 | |||
| No | 76.3 | 1.00 | 1.00 | ||
| Yes | 23.7 | 1.92 (1.51;2.44) | 2.04 (1.59;2.67) | ||
| Heart problem | <0.001 | <0.001 | |||
| No | 68.2 | 1.00 | 1.00 | ||
| Yes | 31.8 | 2.50 (1.95;3.21) | 2.04 (1.55;2.67) | ||
| Heart failure | <0.001 | <0.001 | |||
| No | 89.6 | 1.00 | 1.00 | ||
| Yes | 10.4 | 2.78 (2.14;3.62) | 2.48 (1.92;3.19) | ||
| Ischemia/stroke | <0.001 | <0.001 | |||
| No | 88.7 | 1.00 | 1.00 | ||
| Yes | 11.3 | 3.21 (2.49;4.14) | 2.56 (2.00;3.28) | ||
| Parkinson’s disease | <0.001 | 0.007 | |||
| No | 98.6 | 1.00 | 1.00 | ||
| Yes | 1.4 | 2.98 (1.71;5.18) | 2.06 (1.22;3.47) | ||
| Kidney failure | <0.001 | 0.005 | |||
| No | 96.0 | 1.00 | 1.00 | ||
| Yes | 4.0 | 2.31 (1.52;3.52) | 1.96 (1.23;3.13) | ||
| Epilepsy | <0.001 | <0.001 | |||
| No | 97.0 | 1.00 | 1.00 | ||
| Yes | 3.0 | 2.47 (1.56;3.90) | 3.58 (2.19;5.85) | ||
| Osteoporosis | <0.001 | <0.001 | |||
| No | 74.8 | 1.00 | 1.00 | ||
| Yes | 25.2 | 2.21 (1.71;2.84) | 1.78 (1.38;2.29) | ||
| Cancer | 0.001 | <0.001 | |||
| No | 89.7 | 1.00 | 1.00 | ||
| Yes | 10.3 | 1.73 (1.25;2.40) | 1.89 (1.38;2.60) | ||
a) Morbidity prevalence.
b) PR: crude prevalence ratio.
c) 95%CI: 95% confidence interval.
d) p-value: Wald’s heterogeneity test.
e) PR: prevalence ratio adjusted for sex, age and family income in minimum wages.
In the crude analysis, being aged 75 or over, being female, not living with a partner, having less schooling and lower family income, reporting a greater number of morbidities and having insufficient physical activity were factors associated with frailty. In the multivariate analysis, according to the hierarchical model, age continued to have direct association with frailty, whereby prevalence was four times greater in the elderly aged 75 years or over (PR 4.33 - 95%CI 2.94;6.39), when compared to those aged 60-64 years old. Females (PR 1.46 - 95%CI 1.06;2.03) and individuals who did not live with a partner (PR 1.54 - 95%CI 1.16;2.04) had around 50% more likelihood of being frail. Schooling was inversely associated with the outcome. The morbidity score was found to have direct association with frailty, and prevalence among the insufficiently active elderly was twice that found among active elderly people (PR 2.37 - 95%CI 1.29;4.35) (Table 4).
Table 4 -Prevalence and crude and adjusted analysis of frailty in elderly people (n=1399) according to exposure variables, Pelotas, Rio Grande do Sul, 2014
| Independent variable | %a | Crude analysis | Adjusted analysis | ||
|---|---|---|---|---|---|
| PRb (95%CIc) | p-valued | PRb (95%CIc) | p-valued | ||
| Level 1 | |||||
| Sex | <0.001 | 0.023 | |||
| Male | 8.9 | 1.00 | 1.00 | ||
| Female | 16.6 | 1.86 (1.36;2.55) | 1.46 (1.06;2.03) | ||
| Age range (in full years) | <0.001e | <0.001e | 0,023 | ||
| 60-64 | 5.4 | 1.00 | 1.00 | ||
| 65-69 | 10.0 | 1.84 (1.10;3.09) | 1.76 (1.05;2.95) | ||
| 70-74 | 11.3 | 2.09 (1.25;3.47) | 2.02 (1.21;3.37) | ||
| ≥75 | 27.0 | 4.98 (3.39;7.32) | 4.33 (2.94;6.39) | ||
| Marital status | <0.001 | 0.003 | |||
| Has a partner | 8.8 | 1.00 | 1.00 | ||
| Does not have a partner | 19.5 | 2.23 (1.72;2.91) | 1.54 (1.16;2.04) | ||
| Level 2 | |||||
| Schooling (in completed years of study) | <0.001e | 0.001e | 0,023 | ||
| None | 26.5 | 3.69 (2.30;5.94) | 2.30 (1.43;3.73) | ||
| 1-3 | 17.3 | 2.42 (1.50;3.91) | 2.05 (1.31;3.23) | ||
| 4-7 | 12.5 | 1.75 (1.08;2.83) | 1.61 (1.04;2.51) | ||
| 8-11 | 7.9 | 1.10 (0.55;2.18) | 1.13 (0.59;2.19) | ||
| ≥12 | 7.2 | 1.00 | 1.00 | ||
| Level 3 | |||||
| Morbidities f | <0.001 e | <0.001e | |||
| None | 4.1 | 1.00 | 1.00 | ||
| 1-3 | 8.9 | 2.16 (0.96;4.83) | 1.96 (0.89;4.32) | ||
| ≥4 | 29.5 | 7.17 (3.24;15.8) | 5.19 (2.32;11.57) | ||
| Level 4 | |||||
| Physical activity (IPAQg) | <0.001 | 0.005 | 0,023 | ||
| Insufficiently active | 14.2 | 3.54 (1.93;6.50) | 2.37 (1.29;4.35) | ||
| Active | 4.0 | 1.00 | 1.00 | ||
a) Frailty prevalence.
b) PR: prevalence ratio.
c) 95%CI: 95% confidence interval.
d) p-value: Wald’s heterogeneity test.
e) p-value: Wald’s linear trend test.
f) Morbidities: systemic arterial hypertension, diabetes mellitus, heart problems, heart failure, emphysema, ischemia, arthritis, Parkinson’s disease, kidney failure, epilepsy, osteoporosis, glaucoma and cancer.
g) IPAQ: International Physical Activity Questionnaire.
Discussion
This study found frailty prevalence of 13.8% among elderly people. Prevalence was higher among females, those who were older, those who did not live with a partner, had less schooling, self-reported four or more morbidities and those who were insufficiently active in their leisure time. Morbidities most associated with frailty were epilepsy, ischemia, heart failure, Parkinson’s disease and diabetes mellitus.
The frailty prevalence rate we found diverges from the rate found in previous studies conducted in Brazil using the Edmonton Frail Scale (31 to 47.2%).2,5,9,10 However, our sample was comprised of elderly people who were younger and therefore less frail than the subjects of those studies. As commented above, the “clock test” was discarded because of its ability to overestimate frailty prevalence, classify elderly people with low levels of schooling as having cognitive problems and, consequently, cause a positive classification error with regard to frailty.2 We consider that self-reporting of ability to answer the questionnaire was adequate for assessing the ‘cognition’ domain, given the inclusion in the study of people of low economic status.
When assessing frailty among elderly people living in diverse Brazilian cities in 2008-2009 using Fried’s Frailty Phenotype, the FIBRA research network (Frailty among Elderly Brazilians)7 found prevalence of 9.1%. Also according to the FIBRA study, frailty prevalence was 17%6 in the Northeast region and 9%8 in the Southeast region of Brazil. Frailty prevalence in high-income countries, assessed using different instruments, varies between 4.0 and 59.0%.23 Variability in the scales used limits the comparability of the findings, as scales with a broader approach, such as EFS, tend to find higher frailty prevalence rates when compared to instruments with a biological focus. Notwithstanding, lower frailty prevalence rates found in high-income countries and in Southeast Brazil suggest that aging in places with better socio-economic conditions is accompanied by better quality of life, including health systems better prepared to cope with the increased number of elderly people in the population and their health needs.
“Older” elderly people are frailer both in high-income countries and also in low- and middle-income countries.5,9,11-13 Such frailty arises from biological, psychological, cognitive and social factors caused by the physiological process of aging and medical conditions. It is essential to seek to achieve healthy aging, in which loss of functionality is slight and does not prevent the elderly from remaining independent or affect their quality of life.24
According to the 2010 Demographic Census, females account from some 56.0% of the Brazilian population aged 60 or over.1 They live longer than men but are frailer. The findings of our study in relation to this are consistent with the literature.9,11,12 Females have an intrinsically higher risk of frailty because they have less lean body mass than males in the same age range; as well as having an extrinsically higher risk of frailty because of poor eating habits which make them more vulnerable to the effects of sarcopenia.16 Males, in turn, are more subject to fatal diseases and have more severe disabilities which are attributed to chronic health problems,25 thus increasing the risk of levels of severe frailty found by our study.
Low levels of schooling, which were associated in our study with increased prevalence of the outcome, are related to poor sanitation conditions and reduced access to basic infrastructure and health services. This favors the development of diseases6 and increases the occurrence of frailty. The presence of a partner or family member serves as a stimulus for elderly people to remain active for longer.27 Elderly people who live alone and have no support from family members become more susceptible to falls and disabilities that arise from them.28
Comorbidities fuel the cycle of frailty and hinder the performance of routine activities, thus reducing the autonomy of the elderly.13 In our study, alterations to the health status of the elderly, such as diabetes mellitus, cardiovascular disease, kidney disease, osteoporosis and cancer, were associated with frailty and this finding is consistent with the literature.9,11 Association between morbidities and frailty can, however, also be affected by reverse causality. The morbidities we found to be most related to frailty were epilepsy, ischemia, heart failure and Parkinson’s disease, some of which do not appear in previous studies, either because of a probable variability in the morbidities analyzed, or because of the absence in other studies of adjustment for sociodemographic variables which was done in our study. It is important to place emphasis on arterial hypertension: despite not appearing as one of the morbidities with greater magnitude of association, in view of its high prevalence among the elderly it should be considered as part of the group of morbidities most related to frailty and which should be prioritized when screening for this condition among the elderly.
Healthy habits, such as being active during leisure time, bring benefits that are capable of avoiding or delaying possible frailty.29 Notwithstanding, frail elderly people may be physically limited in terms of doing exercises, so that it is not clear whether the more active elderly are less frail or whether those that are frailer are unable to do exercise, thus characterizing possible reverse causality.
The replacement of the “clock test” as part of the Edmonton Frail Scale to assess the ability to answer the questionnaire appeared to be adequate, considering the high prevalence of low-income people in the sample analyzed. This replacement does however limit assessment of the consistency of the findings compared to previous studies. Losses were greater in the younger age ranges (60-69 years), resulting in a possible selection bias - as well as possible underestimation of frailty prevalence among the younger elderly. However, taking into consideration the direct relationship between frailty prevalence and increased age, the impact of this loss this would be low. Another limitation of our study relates to assessing morbidities using interviewee self-reported medical diagnosis, whereby the data may be subject to possible information bias; here too there is the possibility of prevalence rates being underestimated in the sample: individuals of lower economic status, with less access to health services, tend to be diagnosed less or diagnosed late.
Our study reinforces the adequacy of the actions provided for in the National Policy on Elderly People’s Health (PNSPI)30 which aim to avoid frailty, identify individuals in the initial stages of frailty and encourage their rehabilitation, without them losing their autonomy. These actions prioritize older elderly individuals, in particular females, those who do not live with a partner, those with less schooling and those who have comorbidities and who therefore have high risk of developing frailty. Nevertheless, when recommending the use of Fried’s Frailty Phenotype, PNSPI places emphasis on assessing the physical component.
We consider it to be important to include psychological, social and environmental elements in the assessment of frailty. The Edmonton Frailty Scale, used in our assessment, has shown itself to be easy to administer and has the potential to be included in health service routines as a tool for analyzing different levels of frailty among the elderly. Moreover, the domains assessed according to this scale can guide health professionals in rehabilitation strategies and thus ensure better quality of life for the elderly.
REFERENCES
1. Instituto Brasileiro de Geografia e Estatística. Síntese de indicadores sociais: uma análise das condições de vida da população brasileira [Internet]. Rio de Janeiro: Instituto Brasileiro de Geografia e Estatística; 2012 [citado 2018 nov 7]. Disponível em: Disponível em: https://biblioteca.ibge.gov.br/visualizacao/livros/liv62715.pdf [ Links ]
2. Fabrício-Wehbe SCC, Dantas RAS, Rodrigues RAP, Schiaveto FV, Vendrusculo TR, Haas VJ. Cross-cultural adaptation and validity of the ‘Edmonton Frail Scale - EFS’ in a Brazilian elderly sample. Rev Lat Am Enfermagem [Internet]. 2009 Nov-Dec [cited 2018 Dec 24];17(6):1043-9. Available in: Available in: http://www.scielo.br/scielo.php?script=sci_arttext&pid=S0104-11692009000600018 . doi: 10.1590/S0104-11692009000600018 [ Links ]
3. Rockwood K, Hogan DB, Macknigth C. Conceptualisation and measurement of frailty in elderly people. Drug Aging [Internet]. 2000 Oct [cited 2018 Dec 24];17(4):295-302. Available in: Available in: https://www.ncbi.nlm.nih.gov/pubmed/11087007 [ Links ]
4. Fried LP, Guralnik JM. Disability in older adults: evidence regarding significance, etiology, and risk. J Am Geriatr Soc [Internet]. 1997 Jan [ cited 2018 Dec 24];45(1):92-100. Available in: Available in: https://www.ncbi.nlm.nih.gov/pubmed/8994496 [ Links ]
5. Fhon JRS, Diniz MA, Leonardo KC, Kusumota L, Haas VJ, Rodrigues RAP. Síndrome de fragilidade relacionada à incapacidade funcional no idoso. Acta Paul Enferm [Internet]. 2012 jul [citado 2018 dez 24];25(4):589-94. Disponível em: Disponível em: http://www.scielo.br/scielo.php?script=sci_arttext&pid=S0103-21002012000400017 . doi: 10.1590/S0103-21002012005000016 [ Links ]
6. Sousa AC, Dias RC, Maciel AC, Guerra RO. Frailty syndrome and associated factors in community-dwelling elderly in Northeast Brazil. Arch Gerontol Geriatr [Internet]. 2012 Mar-Apr [cited 2018 Dec 24];54(2):e95-e101. Available in: https://www.ncbi.nlm.nih.gov/pubmed/21930311. doi: 10.1016/j.archger.2011.08.010 [ Links ]
7. Vieira RA, Guerra RO, Giacomin KC, Vasconcelos KSS, Andrade ACS, Pereira LSM, et al. Prevalência de fragilidade e fatores associados em idosos comunitários de Belo Horizonte, Minas Gerais, Brasil: dados do estudo FIBRA. Cad Saúde Pública [Internet]. 2013 ago [citado 2018 dez 24];29(8):1631-43. Disponível em: Disponível em: http://www.scielo.br/scielo.php?script=sci_arttext&pid=S0102-311X2013000800015 . doi: 10.1590/0102-311X00126312 [ Links ]
8. Neri AL, Yassuda MS, Araújo LF, Eulálio MC, Cabral BE, Siqueira MEC, et al. Metodologia e perfil sociodemográfico, cognitivo e de fragilidade de idosos comunitários de sete cidades brasileiras: estudo FIBRA. Cad Saúde Pública [Internet]. 2013 abr [citado 2018 dez 24];29(4):778-92. Disponível em: Disponível em: http://www.scielo.br/scielo.php?pid=S0102-311X2013000400015&script=sci_abstract&tlng=pt . doi: 10.1590/S0102-311X2013000400015 [ Links ]
9. Carneiro JA, Ramos GCF, Barbosa ATF, Mendonça JMG, Costa FM, Caldeira AP. Prevalência e fatores associados à fragilidade em idosos não institucionalizados. Rev Bras Enferm [Internet]. 2016 maio-jun [citado 2018 dez 24];69(3):435-42. Disponível em: Disponível em: http://www.scielo.br/scielo.php?script=sci_arttext&pid=S0034-71672016000300435 . doi: 10.1590/0034-7167.2016690304i [ Links ]
10. Carneiro JA, Ramos GCF, Barbosa ATF, Medeiros SM, Lima CA, Costa FM, et al. Prevalência e fatores associados à incontinência urinária em idosos não institucionalizados. Cad Saúde Colet [Internet]. 2017 jul [citado 2018 dez 24];25(3):268-77. Disponível em: Disponível em: http://www.scielo.br/scielo.php?pid=S1414-462X2017000300268&script=sci_abstract&tlng=pt . doi: 10.1590/1414-462x201700030295 [ Links ]
11. Chen CY, Wu SC, Chen LJ, Lue BH. The prevalence of subjective frailty and factors associated with frailty in Taiwan. Arch Gerontol Geriatr [Internet]. 2010 Feb [cited 2018 Dec 24];50 Suppl1:S43-7. Available in: Available in: https://www.ncbi.nlm.nih.gov/pubmed/20171456 . doi: 10.1016/S0167-4943(10)70012-1 [ Links ]
12. Cigolle CT, Ofstedal MB, Tian Z, Blaum CS. Comparing models of frailty: the health and retirement study. J Am Geriatr Soc [Internet]. 2009 May [cited 2018 Dec 24];57(5):830-9. Available in: Available in: https://www.ncbi.nlm.nih.gov/pubmed/19453306 . doi: 10.1111/j.1532-5415.2009.02225.x [ Links ]
13. Jurschik P, Nunin C, Botigué T, Escobar MA, Lavedán A, Viladrosa M. Prevalence of frailty and factors associated with frailty in the elderly population of Lleida, Spain: the FRALLE survey. Arch Gerontol Geriatr [Internet]. 2012 Nov-Dec [cited 2018 Dec 24];55(3):625-31. Available in: Available in: https://www.ncbi.nlm.nih.gov/pubmed/22857807 . doi: 10.1016/j.archger.2012.07.002 [ Links ]
14. Pereira AA, Borim FSA, Neri AL. Absence of association between frailty index and survival in elderly Brazilians: the FIBRA Study. Cad Saúde Pública [Internet]. 2017 Jun [cited 2018 Dec 24];33(5):e00194115. Available in: Available in: http://www.scielo.br/scielo.php?script=sci_arttext&pid=S0102-311X2017000505005 . doi: 10.1590/0102-311x00194115 [ Links ]
15. Mello AC, Carvalho MS, Alves LC, Gomes VP, Engstrom EM. Consumo alimentar e antropometria relacionados à síndrome de fragilidade em idosos residentes em comunidade de baixa renda de um grande centro urbano. Cad Saúde Pública [Internet]. 2017 [citado 2018 dez 24];33(8):e00188815. Disponível em: Disponível em: http://www.scielo.br/scielo.php?pid=S0102-311X2017000805011&script=sci_abstract&tlng=p. doi: 10.1590/0102-311x00188815 [ Links ]
16. Fried LP, Tangen CM, Walston J, Newman AB, Hirsch C, Gottdiener J, et al. Frailty in older adults: evidence for a phenotype. J Gerontol A Biol Sci Med Sci [Internet]. 2001 Mar [cited 2018 Dec 24];56(3):M146-56. Available in: Available in: https://www.ncbi.nlm.nih.gov/pubmed/11253156 [ Links ]
17. Rolfson DB, Majumdar SR, Tsuyuki RT, Tahir A, Rockwood K. Validity and reliabilityof the edmonton frail scale. Age Ageing [Internet]. 2006 Sep [cited 2018 Dec 24];35(5):526-9. Available in: Available in: https://www.ncbi.nlm.nih.gov/pubmed/16757522 [ Links ]
18. Instituto Brasileiro de Geografia e Estatistica. Censo demográfico 2010 [Internet]. Rio de Janeiro: Instituto Brasileiro de Geografia e Estatistica; 2010 [citado 2018 nov 7]. Disponível em: Disponível em: https://ww2.ibge.gov.br/home/estatistica/populacao/censo2010 [ Links ]
19. Associação Brasileira de Empresas de Pesquisa. Critério de classificação econômica Brasil. São Paulo: Associação Brasileira de Empresas de Pesquisa; 2010. [ Links ]
20. Mayfield D, McLeod G, Hall P. The CAGE questionnaire: validation of new alcoholism screening instrument. Am J Psychiatry [Internet]. 1974 Oct [cited 2018 Dec 24];131(10):1121-3. Available in: Available in: https://www.ncbi.nlm.nih.gov/pubmed/4416585 [ Links ]
21. Craig CL, Marshall AL, Sjöström M, Bauman AE, Booth ML, Ainsworth BE, et al. International physical activity questionnaire: 12-country reliability and validity. Med Sci Sports Exerc [Internet]. 2003 Aug [cited 2018 Dec 24];35(8):1381-95. Available in: Available in: https://www.ncbi.nlm.nih.gov/pubmed/12900694 [ Links ]
22. Victora CG, Huttly SR, Fuchs SC, Olinto M. The role of conceptual frameworks in epidemiological analysis: a hierarchical approach. Int J Epidemiol [Internet]. 1997 Feb [cited 2018 Dec 24];26(1):224-7. Available in: Available in: https://www.ncbi.nlm.nih.gov/pubmed/9126524 [ Links ]
23. Collard RM, Boter H, Schoevers RA, Oude Voshaar RC. Prevalence of frailty in community-dwelling older persons: a systematic review. J Am Geriatr Soc [Internet]. 2012 Aug [cited 2018 Dec 24];60(8):1487-92. Available in: Available in: https://www.ncbi.nlm.nih.gov/pubmed/22881367 . doi: 10.1111/j.1532-5415.2012.04054.x [ Links ]
24. Fabrício SCC, Rodrigues RAP. Revisão da literatura sobre fragilidade e sua relação com o envelhecimento. Rev RENE [Internet]. 2008 abr-jun [citado 2018 dez 24];9(2):113-9. Disponível em: Disponível em: http://www.periodicos.ufc.br/rene/article/view/5046 [ Links ]
25. Bird CE, Rieker PP. Gender matters: an integrated model for understanding men's and women's health. Soc Sci Med [Internet]. 1999 Mar [cited 2018 Dec 24];48(6):745-55. Available in: Available in: https://www.ncbi.nlm.nih.gov/pubmed/10190637 [ Links ]
26. Travassos C, Castro MSM. Determinantes e desigualdades sociais no acesso e na utilização de serviços de saúde. In: Giovanella LES, Lobato LVC, Noronha JC, Carvalho Al, editores. Políticas e sistema de saúde no Brasil. Rio de Janeiro: Fiocruz; 2008. p. 215-43. [ Links ]
27. Abreu-Rodrigues M, Seidl EMF. A importância do apoio social em pacientes coronarianos. Paidéia [Internet]. 2008 [citado 2018 dez 24];18(40):279-88. Disponível em: Disponível em: http://www.scielo.br/scielo.php?script=sci_arttext&pid=S0103-863X2008000200006 . doi: 10.1590/S0103-863X2008000200006 [ Links ]
28. Soares WJS, Moraes SA, Ferriolli E, Perracini MR. Fatores associados a quedas e quedas recorrentes em idosos: estudo de base populacional. Rev Bras Geriatr Gerontol [Internet]. 2014 mar [citado 2018 dez 24];17(1):49-60. Disponível em: Disponível em: http://www.scielo.br/pdf/rbgg/v17n1/1809-9823-rbgg-17-01-00049.pdf . doi: 10.1590/S1809-98232014000100006 [ Links ]
29. Tribess S, Virtuoso Júnior JS, Oliveira RJ. Atividade física como preditor da ausência de fragilidade em idosos. Rev Assoc Med Bras [Internet]. 2012 maio-jun [citado 2018 dez 24];58(3):341-7. Disponível em: Disponível em: http://www.scielo.br/scielo.php?script=sci_arttext&pid=S0104-42302012000300015 . doi: 10.1590/S0104-42302012000300015 [ Links ]
30. Brasil. Ministério da Saúde. Portaria MS/GM nº 2.528, de 19 de outubro de 2006. Aprova a Politica Nacional de Saúde da Pessoa Idosa [Internet]. Diário Oficial da República Federativa do Brasil, Brasília (DF), 2006 out 20 [citado 2018 dez 24]; Seção I:142. Disponível em: Disponível em: http://bvsms.saude.gov.br/bvs/saudelegis/gm/2006/prt2528_19_10_2006.html [ Links ]
*Article derived from the Master’s Degree dissertation entitled ‘Frailty in the elderly in a South Brazilian city’, defended by Simone Farías-Antúnez at the Federal University of Pelotas Epidemiology Postgraduate Program on November 20th 2014. This study was financed with resources from the Federal University of Pelotas Epidemiology Master’s Degree Research Consortium 2013/14: Academic Excellence Program - Coordination for the Improvement of Higher Level Personnel (PROEX/CAPES) No. 23038.003968/2013-99; Financial Support for Educational or Research Project via the Academic Excellence Program (AUXPE/PROEX) No. 1107/2013.
Received: October 09, 2017; Accepted: November 30, 2018
 Este é um artigo publicado em acesso aberto sob uma licença Creative Commons
