


Services on Demand
Journal

Article
 text in
  English (pdf)
 Article in xml format
 Article references
 Send this article by e-mail
Indicators
-
 Cited by SciELO
Related links
-
 Similars in
SciELO
Similars in
SciELO
Share

 Permalink
Epidemiologia e Serviços de Saúde
Print version ISSN 1679-4974On-line version ISSN 2237-9622
Epidemiol. Serv. Saúde vol.28 no.1 Brasília Mar. 2019 Epub Apr 08, 2019
http://dx.doi.org/10.5123/s1679-49742019000100015
ORIGINAL ARTICLE
Leprosy transmission in Bahia, 2001-2015: modeling based on Joinpoint regression and spatial scan statistics*
1Universidade Federal de Alagoas, Departamento de Medicina, Arapiraca, AL, Brasil
2Fundação Instituto Oswaldo Cruz, Programa de Pós-Graduação em Saúde Pública, Recife,
3Fundação Instituto Oswaldo Cruz, Instituto de Comunicação e Informação Científica e Tecnológica em Saúde, Rio de Janeiro, RJ, Brasil
Objective:
to describe the trend and the spatial distribution of leprosy in the state of Bahia, Brazil, 2001-2015.
Methods:
this was a mixed ecological study of epidemiological indicators of leprosy; Joinpoint regression was used for the temporal analysis, while spatial scan statistics were used to identify clusters of the disease; the trend was classified as stationary, increasing or decreasing; we calculated the annual percent change (APC) and average annual percent change (AAPC).
Results:
there was a reduction in prevalence (AAPC = -5.6; p<0,001), treatment dropout (AAPC = -13.7; p<0.001), and females with leprosy (AAPC = -0.6; p<0.001); the new grade II case coefficient (AAPC = 2.7; p<0.001) and the proportion of multibacillary cases (AAPC = 2,2; p<0.001) showed a growing trend; spatial distribution was heterogeneous and concentrated in three regions in particular (north, west and south of the state), with variation between the indicators.
Conclusion:
persisting leprosy transmission in the state, late diagnosis and high hidden prevalence is suggested.
Keywords: Leprosy; Spatial Analysis; Neglected Diseases; Time Series Studies; Ecological Studies
Introduction
Leprosy is still an important Public Health problem in developing countries and continues to be a challenge that has yet to be overcome.1-3 Its relevance lies not only in its persistence but also in the physical and social harm caused to the sick as well as in the very process of the neglect of this disease.3-5
Worldwide, only Brazil has not yet achieved prevalence lower than 1 leprosy case per 10,000 inhabitants. This was considered to be the target for eliminating the disease by the end of the last century.3 Currently, in addition to being in first place in terms of prevalence (1.10/10,000 inhab. in 2016), Brazil is in second place after India with regard to the absolute number of new cases. In 2016 alone, 25,218 new leprosy cases were diagnosed in Brazil, 1,696 of which occurred in people under 15 years old.4
Leprosy distribution among the Brazilian population is heterogeneous and found on different geographic scales.2-3 Whereas in Southern Brazil the detection coefficient in 2016 was 2.84 cases/100,000 inhab., in the country’s Midwest region it was 30.02 cases/100,000 inhab. The Northern region came in second place (28.70/100,000 inhab.), followed by the Northeast region (19.30/100,000 inhab.). Although the Northeast came in third place with regard to the detection coefficient among the general population, in absolute numbers this region accounted for the largest number of people with the disease, i.e. 43.5% of all cases in Brazil.4
Our study is based on two premises: firstly that leprosy does not occur fortuitously in time and space; and secondly that the need exists to understand more clearly the dynamics of the disease’s transmission in endemic areas. Temporal analysis will enable understanding of the behavior of epidemiological indicators along a time series.1 In parallel, spatial analysis, by using geographic information systems, will enable the identification of areas at greater risk of leprosy transmission.7 Together the two strategies will allow more in-depth knowledge of the status of leprosy in the state.
The main objective of this study was to describe the trends and spatial distribution of leprosy in the state of Bahia, Brazil, between 2001 and 2015.
Methods
This was a mixed ecological study, since it brought together temporal and spatial dynamics. Its backdrop was the state of Bahia and its 417 municipalities. We chose a time series of 15 years comprising the period 2001-2015. Bahia is the largest state in Northeast Brazil and the fifth largest in Brazil in terms of its territorial extent, accounting for 36.33% of the area of the Northeast region and 6.63% of the Brazilian territory. It also has the country’s fourth largest population and the largest population in the Northeast: 14,016,906 inhab. in 2010.6
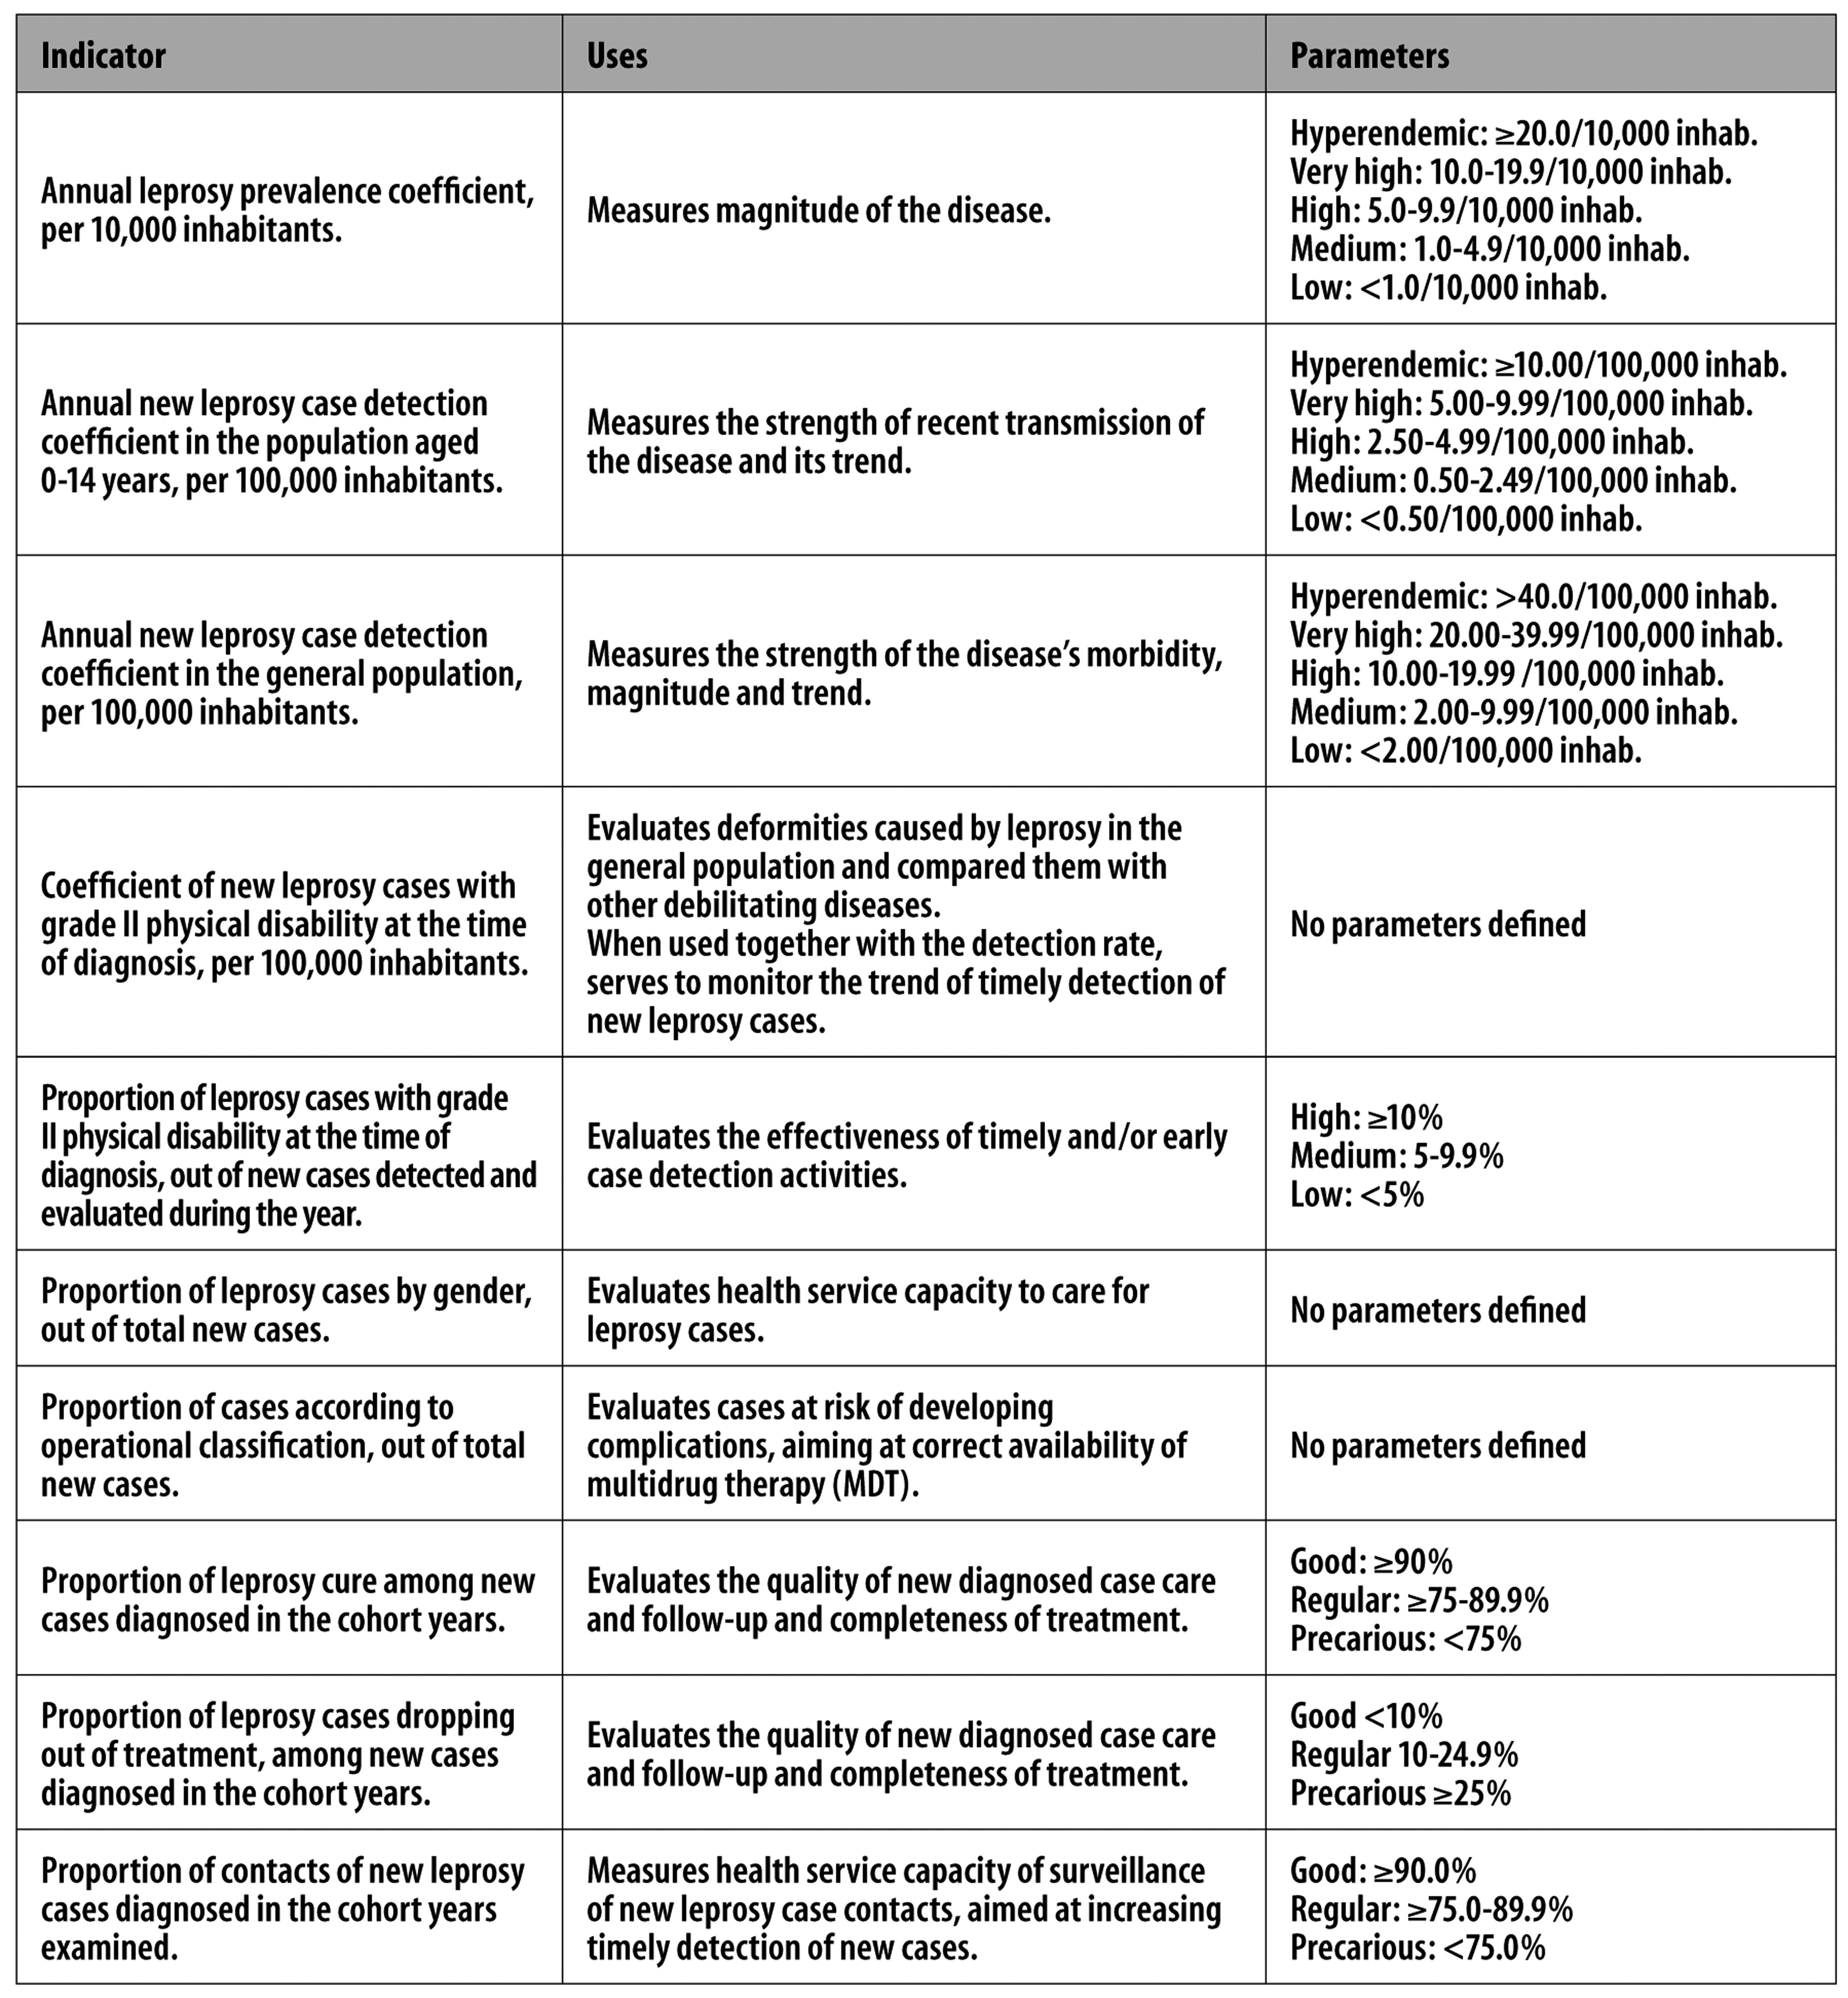
We selected ten indicators for analysis in order to (i) monitor and evaluate the magnitude of the problem of leprosy in Brazil and (ii) evaluate the quality of services provided to patients, all of which are recommended by the Ministry of Health and provided for by Ministerial Ordinance No. 149, dated February 3rd 20167 (Figure 1).
Source: Brazilian Ministry of Health, 2016. 7
Figure 1 - Monitoring and evaluation indicators for leprosy magnitude, and evaluation indicators for the quality of services provided to leprosy patients in Brazil
We retrieved data on new cases from the National Notifiable Diseases Information System (SINAN) and excluded cases that had been closed owing to diagnostic error and duplication. The methodology used to calculate the indicator for each year of the series followed the recommendations of Ordinance No. 149/2016.7 In order to calculate the indicators for the total period, we took mean cases for the period/population in the middle of the period x 100,000.
Data treatment was done in two stages. The first consisted of analyzing the trends of the ten indicators selected, using the joinpoint regression model, i.e. segmented or with inflection points. This model tests whether a line of multiple segments is statistically better for describing the temporal evolution of data when compared to a straight line or a line with fewer segments.8
The regression model enables not only the indicator’s trend to be identified (stationary, increasing or decreasing) but also points where there are changes to this trend, as well as annual percent change (APC) and average annual percent change (AAPC). For each trend detected, we calculated the 95% confidence interval (95%CI) and a 5% significance level. We used Joinpoint software version 4.5.0.1 for this analysis.
The second stage consisted of spatial analysis of three indicators (overall detection coefficient, detection for those aged under 15 and coefficient for grade II physical disability) to detect clusters of municipalities with high risk of leprosy transmission. To this end we applied spatial scan statistics using the Poisson discrete probability model. This model enables not only identification of spatial clusters but also calculation of the relative risk of each of them.9
The test used to identify clusters is based on the maximum likelihood method, the alternative hypothesis of which is that there is high risk inside the window compared to outside the window.9 Monte Carlo simulations (we used 999 permutations) were used to obtain the p-values. Clusters were considered to be significant when their p-value was <0.05. The analysis was conducted based on SatScan version 9.1. The thematic maps were prepared using QGIS 2.14.11.
The study project was approved by the Federal University of Alagoas Research Ethics Committee: Certification of Submission for Ethical Appraisal (CAAE) No. 70943617.5.0000.5013; Opinion No. 2.212.723, dated August 10th 2017.
Results
The prevalence coefficient enabled mean endemicity to be classified for the state of Bahia throughout the entire period studied (Table 1). Analysis using the regression model showed significant reduction in the period 2001-2015 (AAPC = -5.6%; p<0.001), from 2.72 (in 2001) to 1.12 cases per 10,000 inhabitants in 2015 (Tables 1 and 2).
Table 1 - Epidemiological indicators for monitoring the process of leprosy elimination and evaluation of the quality of services provided to leprosy patients, Bahia, 2001-2015
| Indicators | 2001 | 2002 | 2003 | 2004 | 2005 | 2006 | 2007 | 2008 | 2009 | 2010 | 2011 | 2012 | 2013 | 2014 | 2015 |
|---|---|---|---|---|---|---|---|---|---|---|---|---|---|---|---|
| Prevalence coefficient /10,000 inhabitants | 2.72 | 4.36 | 3.96 | 1.57 | 1.33 | 1.21 | 2.09 | 2.20 | 2.22 | 1.85 | 1.75 | 1.67 | 1.50 | 1.33 | 1.12 |
| Detection coefficient in the general population/100,000 inhab. | 16.72 | 19.02 | 23.69 | 28.94 | 26.07 | 22.01 | 21.16 | 19.96 | 18.40 | 19.49 | 19.35 | 18.29 | 13.80 | 16.49 | 16.31 |
| Detection coefficient in under 15 year-olds/100,000 inhab. | 4.71 | 4.60 | 7.13 | 8.02 | 6.78 | 5.59 | 6.15 | 5.16 | 5.59 | 5.43 | 5.54 | 5.34 | 4.12 | 4.90 | 5.88 |
| Coefficient of new cases with grade II/100,000 inhab. | 0.67 | 0.71 | 0.65 | 0.94 | 0.90 | 0.87 | 1.51 | 1.14 | 0.98 | 1.00 | 1.06 | 1.09 | 0.91 | 1.04 | 0.83 |
| % cases with grade II physical disability | 4.93 | 4.68 | 3.36 | 3.71 | 4.19 | 4.69 | 7.88 | 6.28 | 5.69 | 5.65 | 5.91 | 6.53 | 6.69 | 6.57 | 5.70 |
| % female cases | 51.57 | 50.45 | 51.65 | 52.89 | 51.00 | 50.36 | 49.38 | 48.17 | 48.22 | 48.72 | 48.66 | 46.41 | 48.70 | 47.81 | 49.72 |
| % multibacillary cases | 48.82 | 46.47 | 41.88 | 39.08 | 45.03 | 47.79 | 48.14 | 52.97 | 50.22 | 55.12 | 58.15 | 60.60 | 62.00 | 62.61 | 66.54 |
| % cure | 74.00 | 60.70 | 60.00 | 63.90 | 65.40 | 80.20 | 76.10 | 71.90 | 76.70 | 74.90 | 77.00 | 82.90 | 76.30 | 79.50 | 79.40 |
| % treatment dropout | 9.62 | 5.60 | 7.25 | 7.26 | 5.83 | 6.57 | 7.04 | 6.19 | 5.49 | 5.45 | 4.18 | 4.47 | 3.72 | 2.64 | 0.91 |
| % examined contacts | 55.80 | 57.40 | 44.20 | 43.30 | 38.00 | 39.80 | 42.40 | 57.70 | 56.70 | 56.80 | 60.60 | 62.30 | 64.20 | 68.70 | 71.50 |
Table 2 - Joinpoint temporal analysis of epidemiological indicators for monitoring the process of leprosy elimination and for evaluating the quality of services provided to leprosy patients, Bahia, 2001-2015
| Indicator | Trend 1 | Trend 2 | Trend 3 | Total period | |||
|---|---|---|---|---|---|---|---|
| Period | APCa (95%CIc) | Period | APCa (95%CIc) | Period | APCa (95%CIc) | AAPCb (95%CIc) | |
| Prevalence coefficient /10,000 inhabitants | - | - | - | - | - | - | -5.6d (-9.4;-1.6) |
| Detection coefficient in the general population/100,000 inhab. | 2001-2004d | 16.0 (1.9;32.0) | 2004-2015d | -5.0 (-6.7;-3.4) | - | - | -0.9 (-3.5;1.9) |
| Detection coefficient in under 15 year-olds/100,000 inhab. | 2001-2003 | 25.4 (-15.5;86.1) | 2003-2015d | -2.9 (-5.2;-0.6) | - | - | 0.7 (-4.5;6.1) |
| Coefficient of new cases with grade II/100,000 inhab. | 2001-2007d | 11.2 (5.6;17.2) | 2007-2015 | -3.2 (-6.4;0.1) | - | - | 2.7d (0.1;5.4) |
| % cases with grade II physical disability | 2001-2004 | -12.0 (-23.2;0.8) | 2004-2007 | 24.0 (-5.6;62.7) | 2007-2015 | -0.7 (-3.6; 2.3) | 1.5 (-4.0;7.3) |
| % female cases | - | - | - | - | - | - | -0.6d (-0.9;-0.3) |
| % multibacillary cases | 2001-2003 | -9.0 (-19.4;2.8) | 2003-2015d | 4.2 (3.4;4.9) | - | - | 2.2d (0.5;3.9) |
| % cure | 2001-2003 | -10.3 (-19.8;0.3) | 2003-2006 | 9.1 (-2.4;22.0) | 2006-2015 | 0.6 (-0.4;1.7) | 0.7 (-1.7;3.2) |
| % treatment dropout | 2001-2013d | -5.0 (-7.6;-2.4) | 2013-2015d | -51.6 (-69.4;-23.2) | -13.7d (-18.9;-8.3) | ||
| % examined contacts | 2001-2005d | -11.1 (-15.5;-6.5) | 2005-2008 | 13.1 (-3.6;32.7) | 2008-2015d | 4.2 (2.0;6.4) | 1.3 (-1.9;4.6) |
a) APC: annual percent change.
b) AAPC: average annual percent change.
c) 95%CI: 95% confidence interval.
d) Significant trend (p<0.05).
With regard to the leprosy incidence coefficient for the general population, endemicity was classified as very high for the period 2003-2007 and high in the remaining years. When comparing incidence in 2001 and in 2015, the rates are very similar (16.72/100,000 inhab. and 16.31/100,000 inhab., respectively), showing stationary temporal behavior in the period (Tables 1 and 2). The trend analysis showed two significant behaviors: growth between 2001 and 2004 (APC = 16.0%; p=0.02), and decline between 2004 and 2015 (APC = -5.0%; p<0.001) (Table 2).
In relation to the leprosy detection coefficient in those under 15 years old, in 2001, 2002, 2013 and 2014, endemicity was classified as high in this population. In the remaining years, endemicity in the state was classified as very high (Table 1). Two trends were found: the first was not significant (stationary), between 2001 and 2003 (APC = 25.4%; p=0.2), the second was a declining trend with effect from 2003 (APC = -2.9%; p<0.01). Taking the period as a whole, the trend was classified as stationary (APC = 0.7%; p=0.8). Notwithstanding, it must be highlighted that the detection coefficient at the beginning of the series was 4.71 per 100,000 inhab. while at the end of the series it had reached 5.88/100,000 inhab. (Tables 1 and 2).
Analysis of the coefficient for new cases with grade II disability showed little variation over the years, being in the region of 0.65/100,000 inhab. (in 2003) and 1.51 (in 2007). Whereas in the year 2001 the coefficient was 0.67/100,000 inhab., in 2015 it had reached 0.83/100,000 inhab. (Table 1). Two trends were found: an increasing trend between 2001 and 2007 (APC = 11.2%; p<0.001), and a stationary trend between 2007 and 2015 (APC = -3.2%; p=0.1). Differently to the previous indicators, when we analyzed the coefficient for new cases with grade II disability for the total period, we found a growing trend (APC = 2.7%; p<0.001) (Table 2).
With effect from 2007, the proportion of new cases with grade II physical disability was considered to be medium: between 5 and 10%. When comparing the indicator at the beginning and the end of the series, we found growth from 4.93 to 5.70% (Table 1). Stationary patterns were found in the trend analysis, although there was greater variation in the indicator (Table 2).
The proportion of females with leprosy varied little over the time series. At the beginning and end of the series, the proportions found were 51.57% and 49.72%, respectively (Table 1). The trend analysis showed a statistically significant decline in the period (AAPC = -0.6%; p<0.001) (Table 2).
With regard to the proportion of multibacillary cases, we found that with effect from 2008 the indicator remained above 50% (Table 1). An increasing trend was identified in the period (AAPC = 2.2%; p<0.001) (Table 2).
The proportion of cured cases varied little between the beginning and the end of the time series, altering from 74.00% (2001) to 79.40% (2015), showing stationary behavior (AAPC = 0.7%; p=0.6) (Tables 1 and 2).). Between the years 2001 and 2005 and again between 2008 and 2010, this indicator was considered to be precarious. The proportion of cured cases was only greater than 80% in two of the years of the series (2006 and 2012) (Table 1).
The proportion of leprosy treatment dropout reduced substantially over the period studied. Whereas at the beginning of the series (2001) treatment dropout was 9.62%, by the end of the series (2015) the proportion was 0.91%. Throughout the entire time series this indicator was classified as good (Table 1). However, the proportion of treatment dropout showed two significant trends of reduction: firstly in the period 2001-2013 (APC = -5.0%; p<0.01), and secondly between 2013 and 2015 (APC = -51.6; p<0.001). Taking the period as a whole, AAPC was -13.7% (p<0.001) (Table 2).
Finally, the proportion of contacts examined was the most irregular indicator over the period studied. In 2001, the proportion of contacts examined was 55.80%, while in 2015 it has reached 71.50%. This indicator was considered precarious in all the years of the series. The trend analysis found three temporal behaviors, two of which were statistically significant: the first was a decreasing trend between 2001 and 2005 (APC = -11.1; p<0.001), while the second was an increasing trend between 2008 and 2015 (APC = 4.2; p<0.001). Considering the period as a whole, the indicator showed a stationary pattern (AAPC = 1.3%; p=0.4) (Table 2).
Spatial scan statistics for the general population detection coefficient identified 15 statistically significant spatial clusters (Table 3), ten of which were considered to be hyperendemic, while five had very high endemicity. Cluster 9, comprised only of the municipality of Andaraí, had the highest relative risk (RR = 6.64; p<0.001) and the highest coefficient (131,8/100,000 inhab.). Cluster 1 came in second place and was comprised of five municipalities: Casa Nova, Remanso, Juazeiro, Sento-Sé and Sobradinho (RR = 5.30; p<0.001). Together, these two clusters accounted for 12.42% (n = 5,244) of all cases recorded in the state of Bahia between 2001 and 2015. It is noteworthy that they are small municipalities, with the exception of Juazeiro, where the population was just over 200,000 inhabitants in 2015 (Figure 2).
Table 3 - Statistically significant spatial clusters of leprosy detection coefficients in the general population, in those under 15 years old, and coefficient of new cases with grade II physical disability, Bahia, 2001-2015
| Clusters | Detection coefficient in the general population/100,000 inhabitants | Detection coefficient in under 15 year-olds/100,000 inhabitants | Coefficient of new cases with grade II physical disability/100,000 inhabitants | ||||||
|---|---|---|---|---|---|---|---|---|---|
| Municipalities | Coefficient/ 100,000 inhab. | RRa | Municipalities | Coefficient/ 100,000 inhab. | RRa | Municipalities | Coefficient/100,000 inhab. | RRa | |
| 1 | 5 | 94.6 | 5.30 | 1 | 144.8 | 27.44 | 16 | 3.4 | 4.11 |
| 2 | 14 | 63.5 | 3.58 | 14 | 21.2 | 4.31 | 9 | 3.4 | 3.83 |
| 3 | 24 | 60.9 | 3.38 | 2 | 21.8 | 4.03 | 3 | 2.2 | 2.32 |
| 4 | 32 | 51.2 | 2.89 | 24 | 13.9 | 2.13 | 14 | 1.8 | 1.95 |
| 5 | 1 | 63.9 | 3.27 | 9 | 15.9 | 2.94 | 19 | 1.7 | 1.86 |
| 6 | 2 | 60.3 | 3.07 | 16 | 15.2 | 2.83 | 1 | 5.3 | 5.52 |
| 7 | 1 | 73.3 | 3.73 | 1 | 32.0 | 5.76 | - | - | - |
| 8 | 1 | 67.7 | 3.44 | 1 | 41.3 | 7.32 | - | - | - |
| 9 | 1 | 131.8 | 6.64 | 1 | 16.6 | 2.96 | - | - | - |
| 10 | 10 | 28.1 | 1.43 | 1 | 19.5 | 3.48 | - | - | - |
| 11 | 1 | 29.3 | 1.49 | 1 | 18.9 | 3.34 | - | - | - |
| 12 | 1 | 46.9 | 2.37 | - | - | - | - | - | - |
| 13 | 4 | 30.9 | 1.57 | - | - | - | - | - | - |
| 14 | 1 | 31.7 | 1.60 | - | - | - | - | - | - |
| 15 | 1 | 24.5 | 1.24 | - | - | - | - | - | - |
a) RR: relative risk (statistically significant when p<0.05).
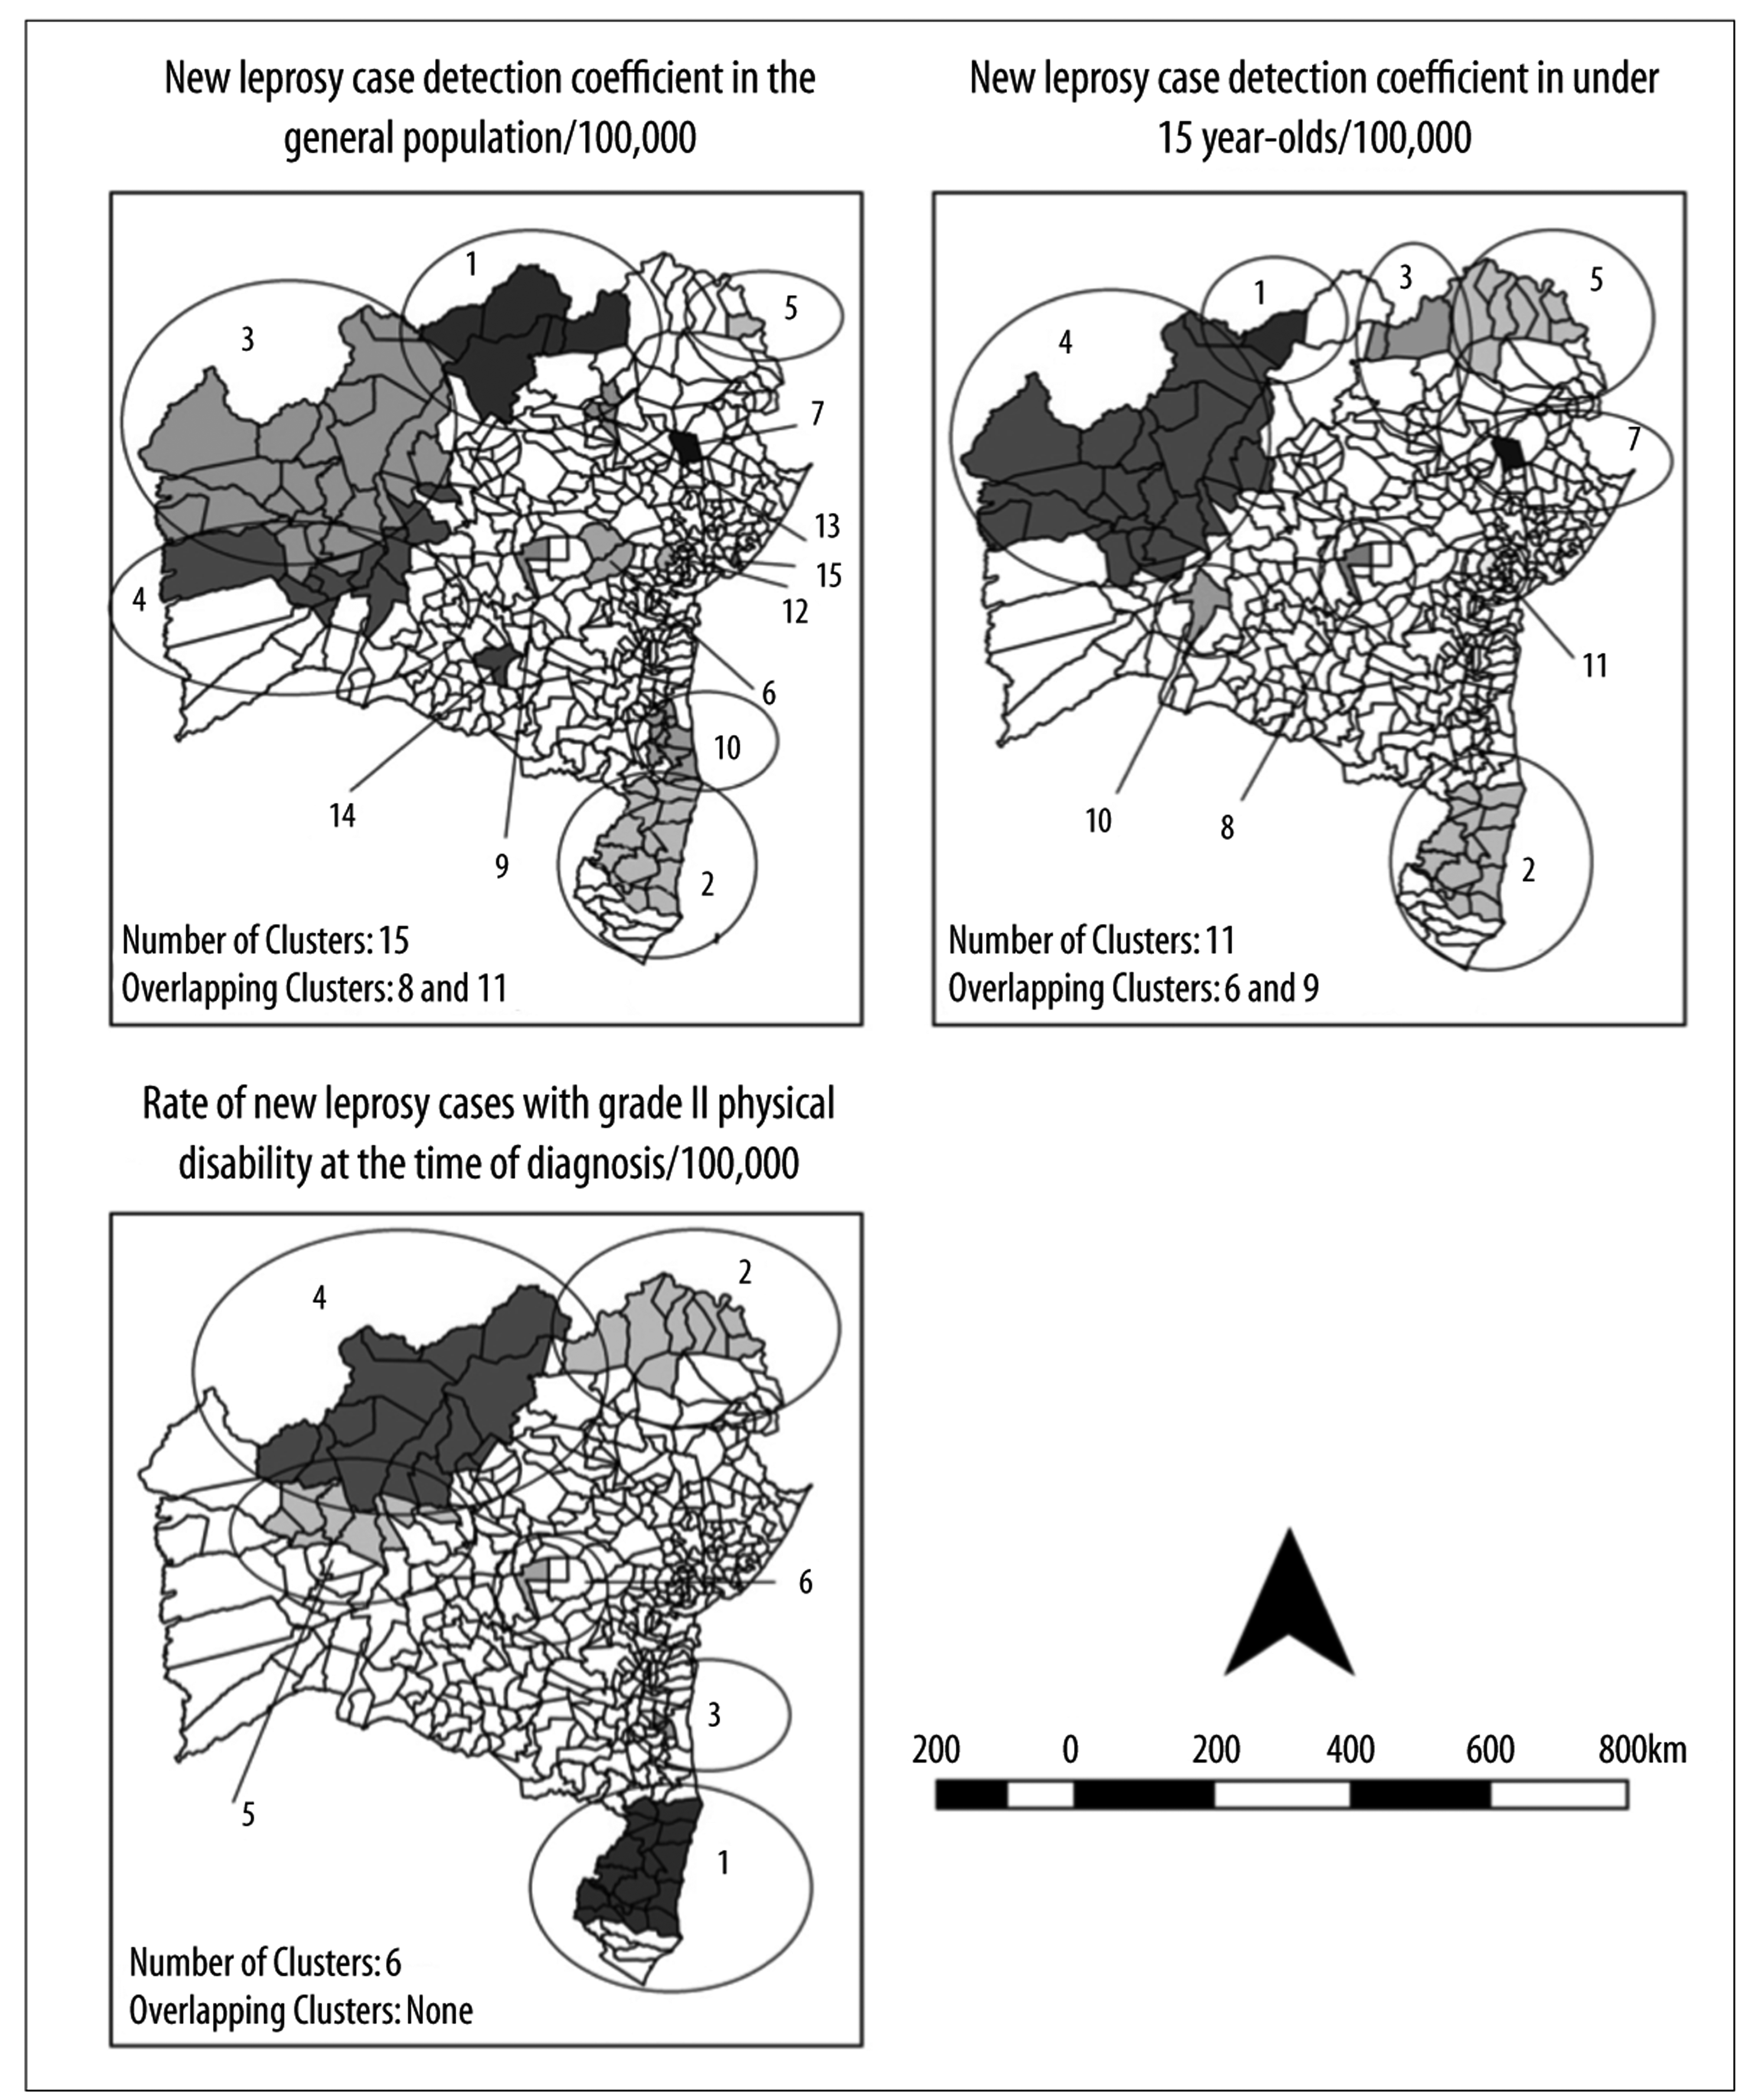
Figure 2 - Spatial scan statistics of epidemiological leprosy monitoring indicators in Bahia, 2001-2015
With regard to the detection coefficient for those under 15 years old, we identified 11 spatial clusters (Table 3). Cluster 1 (municipality of Remanso) had the highest relative risk (RR = 27.44; p<0.001) and the highest coefficient (144.8/100,000 inhab.). In this age range, the municipality of Andaraí formed part of cluster 8. Standing out among the clusters comprised of more than one municipality was cluster number 2, located in the southern region of the state and comprised of 14 municipalities: Alcoçaba, Belmonte, Eunápolis, Guaratinga, Itabela, Itagimirim, Itamaraju, Itapebi, Jucuruçu, Porto Seguro, Prado, Santa Cruz Cabrália, Teixeira de Freitas and Veredas. Together, these municipalities recorded 608 cases in those under 15 years old, accounting for 17.72% of total cases recorded in the state in the period 2001-2015 (Figure 2).
Finally, when analyzing the coefficient for new cases with grade II physical disability at the time of diagnosis, we identified six statistically significant spatial clusters (Table 3). Andaraí formed part of cluster 6 and had the highest relative risk (RR = 5.52; p<0.001) and the highest coefficient (5,3/100,000 inhab.). Cluster 1 came in second place in the analysis of this coefficient (RR = 4.11; p<0.001) and was comprised of 16 municipalities: Alcoçaba, Belmonte, Eunápolis, Guaratinga, Itabela, Itagimirim, Itanhém, Itamaraju, Itapebi, Jucuruçu, Medeiros Neto, Porto Seguro, Prado, Santa Cruz Cabrália, Teixeira de Freitas and Vereda. Together, these 16 municipalities reported 337 individuals with grade II physical disability at the time of diagnosis, accounting for 16.58% of all cases in the state in the period 2001-2015 (Figure 2).
Discussion
Our analysis of leprosy showed important facets of the process of becoming ill among infected individuals living in Bahia. In view of their complexity, this discussion combines temporal and spatial elements in order to explain the dynamics of leprosy transmission in the state.
The leprosy prevalence coefficient follows the declining pattern found on different levels, right from the global level to the local level, above all with effect from the implantation of multidrug therapy (MDT) and the international commitments taken on, including by Brazil, in addressing the disease.1 However, there is consistent evidence that this trend is a virtual phenomenon and not a real one. We refer to this process as ‘pseudo decline’ and suggest that it may be the result of high hidden prevalence of the disease, allowing one to defend that the true number of cases is even higher than those currently recorded on official information systems.5,10-11
The first set of evidence relates to the maintenance of the transmission chain in the state, shown by the analysis of the detection coefficients in the general population and in those under 15 years old. The stationary behavior of overall detection, different to the pattern found in other places in Brazil,12-13 and the fact of this indicator being practically the same at the beginning and the end of the series, contribute to supporting the thesis of active leprosy transmission in the state of Bahia.
In parallel, the spatial heterogeneity of these indicators, similar to that found in other places in Brazil,14-15 makes evident important aspects of this process. The concentration of areas of higher risk in the north/west strip and the southern region of Bahia may have two interpretations. The first relates to the process of how these regions have been formed, being characterized by large-scale migration of people in search of better living conditions in the north of the state (irrigation and irrigated fruit growing projects), in the west (grain production) and in the south (cellulose production and tourism).16-18 The ‘migration’ factor has already been indicated as an important determinant of the maintenance of the leprosy transmission chain.19
These regions of the state have the greatest potential for development, influencing the availability of health services and people’s access to them. This may also justify the reduction in treatment dropout. The central area of the state of Bahia is characterized by being historically poor and may represent a pocket of hidden prevalence, i.e. a high number of undiagnosed people with leprosy. It does not appear to be true that leprosy is on the “edges” of the state and spares its central region, where the state’s worst living conditions are found, but rather that diagnosis is easier in the state’s perimeter than in its inner regions.
Among children (<15 years old) in the state, although the trend was found to be decreasing between 2003 and 2009 and stationary for the period as a whole, the coefficient for the last year of the series, 2015 (5.88/100,000 inhab.), was substantially higher than that found at the beginning of the series, 2001 (4.71/100,000 inhab.). Oscillations in leprosy in childhood were also found in the state of Mato Grosso20 and in Fortaleza, capital of the state of Ceará.13
Persistence of leprosy in children is the most important indicator of the maintenance of the epidemiological transmission chain and reflects intense circulation of the infectious agent Mycobacterium leprae.20,21 A child with leprosy indicates that there is an undiagnosed and untreated adult. The existence of a cluster of high risk for this population in northeast Bahia (cluster 5), and the fact that this region does not appear to be of high risk for leprosy in the general population, points to high hidden prevalence in the adult population.
The second set of evidence relates to late diagnosis, in particular the significant increasing trend of the coefficient for new cases with grade II physical disability and the stability of the proportion of those already disabled at the time of diagnosis. These findings are corroborated by research conducted in the state of Mato Grosso.20 In the municipality of Fortaleza, Ceará,13 and in the state of Tocantins,12 studies found stability for both indicators.
The increasing trend of disabled people has to be viewed with concern. Late diagnosis appears to be even more serious in the state of Bahia, when compared to other regions in which this trend has been analyzed. As leprosy is a long-lasting disease, the presence of physical disability points to delayed diagnosis, hidden prevalence and failure of health services to identify cases.1,22
In addition, the existence of clusters of the coefficient for new cases with grade II disability reinforces the existence of late diagnosis and hidden prevalence, indicating the most critical and highest priority areas for intervention.1,23 The north, northeast and southern regions of Bahia require urgent measures to be taken. In the far west of the state, although it is an area of high risk both for the general population and for children, the spatial scan analysis suggests that diagnosis occurs earlier there, given that we did not identify a cluster of physical disabilities in that region.
Late diagnosis is also reinforced by the increasing trend in the proportion of multibacillary cases and dimorphic and virchowian forms. These forms of infection are important in the transmission chain and substantially increase the risk of physical disabilities.3,24 Whereas at the beginning of the time series (2001), 48.82% of new cases were multibacillary, at the end of the series they accounted for two thirds (66.54%). Proportional increase in multibacillary cases has also been found in other Brazilian states, such as Mato Grosso,20 Pará25 and Tocantins,12 as well as in municipalities such as Ribeirão Preto, in the state of São Paulo,3 and Fortaleza.13
Many factors may be associated with late diagnosis, in particular characteristics of the population itself, such as socio-economic conditions and neglect of one’s own health,2,13 as well as characteristics related to health services, their poor availability and being hard to access.5,13 Another point that stands out is the weakness of health surveillance systems, especially in smaller municipalities, where passive detection is the main case detection mechanism.
Two further pieces of evidence draw attention. The first relates to the proportion of cured leprosy cases. Given that this disease can be completely curable and its treatment is free of charge in Brazil, the low proportion of cured cases, considered to be precarious in six of the years analyzed and regular in the remaining years, suggests shortcomings in patient follow-up. Non-cured individuals, apart from contributing to continuing transmission, can develop permanent physical disabilities, reactional states and drug resistance.26,27
The second piece of evidence relates to the percentage of contacts examined. This is an indicator of the capacity of health services to undertake surveillance of case contacts and thus increase timely detection of new cases. Over the time series, performance of contact examination oscillated between 38.00% (2005) and 71.50% (2015). This coefficient was classified as precarious (<75%) in all the years selected. In addition to this proportion being very low, the quality of the procedure must be questioned as it is often reduced to prescribing BCG vaccination.28 The impacts of this process include late diagnosis, maintenance of the transmission chain and the risk of physical disabilities.29 Although health teams may place little importance on contact examinations, they should be a priority in the fight to eliminate leprosy as a Public Health problem, not only for early identification of people with leprosy but also for identification of more susceptible contacts, including use of molecular tests.30
Even considering all the methodological care taken in developing this study, it is important to highlight the existence of limitations, including the use of secondary data the quality of which depends on correct input to information systems by municipalities. Weaknesses in record quality can be seen, especially in smaller municipalities where there are often difficulties with leprosy surveillance.13,14
We have demonstrated the complexity of the dynamics of leprosy transmission in the state of Bahia and the urgent need for public policies enabling actions to reduce hidden prevalence of the disease, favor early case diagnosis, adequate follow up of those with the disease and contact surveillance.
REFERENCES
1. Schreuder PA, Noto S, Richardus JH. Epidemiologic trends of leprosy for the 21st century. Clin Dermatol [Internet]. 2016 Jan-Feb [cited 2019 Jan 28];34(1):24-31. Available from: Available from: https://www.ncbi.nlm.nih.gov/pubmed/26773620 . Doi: 10.1016/j.clindermatol.2015.11.001 [ Links ]
2. Silva CLM, Fonseca SC, Kawa H, Palner DOQ. Spatial distribuition of leprosy in Brasil: a literature review. Rev Soc Bras Med Trop [Internet]. 2017 Jul-Aug [cited 2019 Jan 28];50(4):439-49. Availabe from: Availabe from: http://www.scielo.br/scielo.php?script=sci_arttext&pid=S0037-86822017000400439 . Doi: 10.5123/s2176-62232017000100005 [ Links ]
3. Ramos ACV, Yamamura M, Arroyo LH, Popolin MP, Chiaravalloti Neto F, Palha PF, et al. Spatial clustering and local risk of leprosy in São Paulo, Brazil. PLoS Negl Trop Dis [Internet]. 2017 Feb [cited 2019 Jan 28];11(2):e0005381. Available from: Available from: https://journals.plos.org/plosntds/article?id=10.1371/journal.pntd.0005381 . Doi:10.1371/journal.pntd.0005381 [ Links ]
4. Ministério da Saúde (BR). Registro ativo: número e percentual, casos novos de hanseníase: número, coeficiente e percentual, faixa etária, classificação operacional, sexo, grau de incapacidade, contatos examinados, por estado e regiões, Brasil, 2016 [Internet]. Brasília: Ministério da Sáude; 2017 [citado 2017 set 25]. Disponível em:Disponível em:http://portalarquivos2.saude.gov.br/images/pdf/2016/julho/07/tabela-geral-2015.pdf [ Links ]
5. Salgado CG, Barreto JG, Silva MB, Frade MAC, Spencer JS. What do we actually know about leprosy worldwide? Lancet Infect Dis [Internet]. 2016 Jul [cited 2019 Jan 28];16(7):778. Available from: Available from: https://www.thelancet.com/journals/laninf/article/PIIS1473-3099(16)30090-1/fulltext . Doi: 10.1016/S1473-3099(16)30090-1 [ Links ]
6. Superintendência de Estudos Econômicos e Sociais (Bahia). Bahia em números 2013 [Internet]. Salvador: Superintendência de Estudos Econômicos e Sociais da Bahia; 2014 [citado 2019 jan 28]. v.13. Disponível em: Disponível em: https://www.sei.ba.gov.br/index.php?option=com_content&view=article&id=71&Itemid=284 [ Links ]
7. Ministério da Saúde (BR). Secretaria de Vigilância em Saúde. Departamento de Vigilância das Doenças Transmissíveis. Diretrizes para vigilância, atenção e eliminação da hanseníase como problema de saúde pública: manual técnico-operacional [Internet]. Brasília: Ministério da Saúde; 2016 [citado 2019 jan 28]. 58 p. Disponível em:Disponível em:http://www.saude.pr.gov.br/arquivos/File/Manual_de_Diretrizes_Eliminacao_Hanseniase.pdf [ Links ]
8. Kim HJ, Fay MP, Feuer EJ, Midthune DN. Permutation tests for joinpoint regression with applications to cancer rates. Stat Med [Internet]. 2000 Jan [cited 2019 Jan 28];19(3):335-51. Available from: Available from: https://onlinelibrary.wiley.com/doi/10.1002/%28SICI%291097-0258%2820000215%2919%3A3%3C335%3A%3AAID-SIM336%3E3.0.CO%3B2-Z . doi: 10.1002/(SICI)1097-0258(20000215)19:3<335::AID-SIM336>3.0.CO;2-Z [ Links ]
9. Kulldorff MA. Spatial scan statistic. Commun Stat Theory Methods [Internet]. 1997 Jun [cited 2019 Jan 28];26(6):1481-96. Available from:Available from:https://www.tandfonline.com/doi/abs/10.1080/03610929708831995?src=recsys . Doi: 10.1080/03610929708831995 [ Links ]
10. Salgado CG, Barreto JG, Silva MB, Goulart IMB, Barreto JA, Nery JA, et al. Are leprosy case numbers reliable? Lancet Infect Dis [Internet]. 2018 Feb [cited 2019 Jan 28];18(2):135-7. Available from: Available from: https://www.thelancet.com/journals/laninf/article/PIIS1473-3099(18)30012-4/fulltext . Doi: 10.1016/S1473-3099(18)30012-4 [ Links ]
11. Frade MAC, Paula NA, Gomes CM, Vernal S, Bernardes Filho F, Lugão HB, et al. Unexpectedly high leprosy seroprevalence detected using a random surveillance strategy in midwestern Brazil: a comparison of ELISA and a rapid diagnostic test. PLoS Negl Trop Dis [Internet]. 2017 Feb [cited 2019 Jan 28];11(2):e0005375. Available from: Available from: https://journals.plos.org/plosntds/article?id=10.1371/journal.pntd.0005375 . Doi: 10.1371/journal.pntd.0005375 [ Links ]
12. Monteiro LD, Martins-Melo FR, Brito AL, Alencar CH, Heukelbah J. Padrões espaciais da hanseníase em um estado hiperendêmico no Norte do Brasil, 2001-2012. Rev Saúde Pública [Internet]. 2015 dez [citado 2019 jan 28];49(84):1-8. Disponível em: Disponível em: http://www.scielo.br/pdf/rsp/v49/pt_0034-8910-rsp-S0034-89102015049005866.pdf . Doi: 10.1590/S0034-8910.2015049005866 [ Links ]
13. Brito AL, Monteiro LD, Ramos Júnior AN, Heukelbach J, Alencar CH. Temporal trends of leprosy in a Brazilian state capital in Northeast Brazil: epidemiology and analysis by join points, 2001 to 2012. Rev Bras Epidemiol [Internet]. 2016 Jan-Mar [cited 2019 Jan 28];19(1):194-204. Available from: Available from: http://www.scielo.br/pdf/rbepid/v19n1/en_1980-5497-rbepid-19-01-00194.pdf . Doi: 10.1590/1980-5497201600010017 [ Links ]
14. Barreto JG, Bisanzio D, Frade MAC, Moraes TMP, Gobbo AR, Guimarães LS, et al. Spatial epidemiology and serologic cohorts increase the early detection of leprosy. BMC Infect Dis [Internet]. 2015 Nov [cited 2019 Jan];15:527. Available from: Available from: https://www.ncbi.nlm.nih.gov/pmc/articles/PMC4647818/ . Doi: 10.1186/s12879-015-1254-8 [ Links ]
15. Duarte-Cunha M, Cunha GM, Souza-Santos R. Geographical heterogeneity in the analysis of factors associated with leprosy in an endemic area of Brazil: are we eliminating the disease? BMC Infec Dis [Internet]. 2015 Apr [cited 2019 Jan 28];15:196. Available from: Available from: https://bmcinfectdis.biomedcentral.com/articles/10.1186/s12879-015-0924-x . Doi: 10.1186/s12879-015-0924-x [ Links ]
16. Costa DH, Mondardo ML. A modernização da agricultura no Oeste Baiano: Migração Sulista e novas territorialidades. Rev Geonorte [Internet]. 2013 jun [citado 2019 jan 28];4(12):1347-61. Disponível em: Disponível em: http://www.periodicos.ufam.edu.br/revista-geonorte/article/view/1239/1122 [ Links ]
17. Andrade MLN. Um estudo cultural do cacau com perspectivas para o turismo. [dissertação]. Bahia: Universidade Estadual de Santa Cruz; 2004. Disponível em:http://www.uesc.br/cursos/pos_graduacao/mestrado/turismo/dissertacao/dissertacao_maria_luiza.pdf [ Links ]
18. Vilarim MA. A região de Petrolina - PE e Juazeiro - BA: notas sobre as transformações locais, os sujeitos do campo e a migração. In: Anais do XI Encontro Nacional da Anpege [Internet]. 2015 out 9-12. Presidente Prudente, Brasil. Presidente Prudente: Angepe; 2015 [citado 2019 jan 28]. p. 1124-6. Disponível em:Disponível em:http://www.enanpege.ggf.br/2015/anais/arquivos/13/410.pdf [ Links ]
19. Murto C, Ariza L, Alencar CH, Chichava OA, Oliveira AR, Kaplan C, et al. Migration amongindividuals with leprosy: a population-based study in Central Brazil. Cad Saúde Pública [Internet]. 2014 Mar [cited 2019 Jan 28];30(3):487-501. Available from: Available from: http://www.scielo.br/pdf/csp/v30n3/0102-311X-csp-30-3-0487.pdf . Doi: 10.1590/0102-311X00005913 [ Links ]
20. Freitas LRS, Duarte EC, Garcia LP. Análise da situação epidemiológica da hanseníase em uma área endêmica no Brasil: distribuição espacial dos períodos 2001 - 2003 e 2010 - 2012. Rev Bras Epidemiol [Internet]. 2017 dez [citado 2019 jan 28];20(4):702-713. Disponível em: Disponível em: http://www.scielo.br/pdf/rbepid/v20n4/1980-5497-rbepid-20-04-702.pdf . Doi: 10.1590/1980-5497201700040012 [ Links ]
21. Souza CDF, Rodrigues M. Magnitude, tendência e espacialização da hanseníase em menores de 15 anos no estado da Bahia, com enfoque em áreas de risco: um estudo ecológico. Hygeia [Internet]. 2015 jun [citado 2019 jan 28];11(20):201-12. Disponível em: Disponível em: http://www.seer.ufu.br/index.php/hygeia/article/view/28914/16907 . [ Links ]
22. Pinto ACVD, Wachholz PA, Silva GV, Masuda PY. Profile of leprosy in children under 15 years monitored in a Brazilian referral center (2004-2012). An Bras Dermatol [Internet]. 2017 Jul-Aug [cited 2019 Jan 28];92(4):580-2. Available from: Available from: http://www.scielo.br/pdf/abd/v92n4/0365-0596-abd-92-04-0580 .pdf. Doi: 10.1590/abd1806-4841.20175676 [ Links ]
23. Alencar CH, Ramos Júnior A, Barbosa JC, Kerr-Pontes LRFS, Oliveira MLW, Heukelbach J. Persisting leprosy transmission despite increased control measures in an endemic cluster in Brazil: the unfinished agenda. Lepr Rev [Internet]. 2012 Dec [cited 2019 Jan 28];83(4):344-53. Available from: Available from: https://www.lepra.org.uk/platforms/lepra/files/lr/dec12/lep344-353.pdf [ Links ]
24. Wagenaar I, Post E, Brandsma W, Ziegler D, Rahman M, Alam K, et al. Early detection of neuropathy in leprosy: a comparison of five tests for field settings. Infec Dis Poverty [Internet]. 2017 Sep [cited 2019 Jan 28];6:115. Available from: Available from: https://www.ncbi.nlm.nih.gov/pmc/articles/PMC5580225/ . Doi: 10.1186/s40249-017-0330-2 [ Links ]
25. Neves DCO, Ribeiro CDT, Santos LES, Lobato DC. Tendência das taxas de detecção de hanseníase em jovens de 10 a 19 anos de idade nas Regiões de Integração do estado do Pará, Brasil, no período de 2005 a 2014. Rev Pan-Amaz Saúde [Internet]. 2017 mar [citado 2019 jan 28]:8(1):29-37. Disponível em: Disponível em: http://scielo.iec.gov.br/pdf/rpas/v8n1/2176-6223-rpas-8-01-00029.pdf . Doi: 10.5123/s2176-62232017000100005 [ Links ]
26. Duarte-Cunha M, Souza-Santos R, Matos HJ, Oliveira MLW. Aspectos epidemiológicos da hanseníase: uma abordagem espacial. Cad Saúde Pública [Internet]. 2012 jun [citado 2019 jan 28];28(6):1143-55. Disponível em: Disponível em: http://www.scielo.br/pdf/csp/v28n6/13.pdf . Doi: 10.1590/S0102-311X2012000600013 [ Links ]
27. Beltraán-Alzate C, López Díaz F, Romero-Montoya M, Sakamuri R, Li W, Kimura M, et al. Leprosy drug resistance surveillance in Colombia: the experience of a sentinel country. PLoS Negl Trop Dis [Internet]. 2016 Oct [cited 2019 Jan 28];10(10):e0005041. Available from: Available from: https://www.ncbi.nlm.nih.gov/pubmed/27706165 . Doi: 10.1371/journal.pntd.0005041 [ Links ]
28. Romanholo HSB, Souza EA, Ramos Júnior NA, Kaiser ACGCB, Silva IO, Brito AL, et al. Surveillance of intradomiciliary contacts of leprosy cases: perspective of the client in a hyperendemic municipality. Rev Bras Enferm [Internet]. 2018 Jan-Feb [cited 2019 Jan 28];71(1):163-9. Available from: Available from: http://www.scielo.br/pdf/reben/v71n1/0034-7167-reben-71-01-0163.pdf . Doi: 10.1590/0034-7167-2016-0607 [ Links ]
29. Romero-Montoya M, Beltran-Alzate JC, Cardona-Castro N. Evaluation and monitoring of Mycobacterium leprae transmission in household contacts of patients with Hansen's Disease in Colombia. PLoS Negl Trop Dis [Internet]. 2017 Jan [cited 2019 Jan 28];11(1):e0005325. Available from: Available from: https://journals.plos.org/plosntds/article?id=10.1371/journal.pntd.0005325 . Doi: 10.1371/journal.pntd.0005325 [ Links ]
30. Penna ML, Penna GO, Iglesias PC, Natal S, Rodrigues LC. Anti-PGL-1 positivity as a risk marker for the development of leprosy among contacts of leprosy cases: systematic review and meta-analysis. PLoS Negl Trop Dis [Internet]. 2016 May [cited 2019 Jan 28];10(5):e0004703. Available from: Available from: https://www.ncbi.nlm.nih.gov/pubmed/27192199 . Doi: 10.1371/journal.pntd.0004703 [ Links ]
*This article is derived from the Ph.D. thesis entitled ‘Leprosy and social determinants of health: a quantitative methods-based approach - Bahia, 2001-2015’, defended by Carlos Dornels Freire de Souza at the Oswaldo Cruz Institute Foundation Public Health Postgraduate Program in 2018.
ERRATUM
In the article “Leprosy transmission in Bahia, 2001-2015: modeling based on Joinpoint regression and spatial scan statistics”, DOI: 10.5123/S1679-49742019000100015, published on Epidemiology and Health Services, 28(1):1-11:
Original text:
Leprosy transmission in Bahia, 2001-2015: modeling based on Jointpoint regression and spatial scan statistics*
Abstract
Objective: to describe the trend and the spatial distribution of leprosy in the state of Bahia, Brazil, 2001-2015.
Methods: this was a mixed ecological study of epidemiological indicators of leprosy; Jointpoint regression was used for the temporal analysis, while spatial scan statistics were used to identify clusters of the disease; the trend was classified as stationary, increasing or decreasing; we calculated the annual percent change (APC) and average annual percent change (AAPC).
Results: there was a reduction in prevalence (AAPC = -5.6; p<0,001), treatment dropout (AAPC = -13.7; p<0.001), and females with leprosy (AAPC = -0.6; p<0.001); the new grade II case coefficient (AAPC = 2.7; p<0.001) and the proportion of multibacillary cases (AAPC = 2,2; p<0.001) showed a growing trend; spatial distribution was heterogeneous and concentrated in three regions in particular (north, west and south of the state), with variation between the indicators.
Conclusion: persisting leprosy transmission in the state, late diagnosis and high hidden prevalence is suggested.
Keywords: Leprosy; Spatial Analysis; Neglected Diseases; Time Series Studies; Ecological Studies.
Corrected text:
Leprosy transmission in Bahia, 2001-2015: modeling based on Joinpoint regression and spatial scan statistics*
Abstract
Objective: to describe the trend and the spatial distribution of leprosy in the state of Bahia, Brazil, 2001-2015.
Methods: this was a mixed ecological study of epidemiological indicators of leprosy; Joinpoint regression was used for the temporal analysis, while spatial scan statistics were used to identify clusters of the disease; the trend was classified as stationary, increasing or decreasing; we calculated the annual percent change (APC) and average annual percent change (AAPC).
Results: there was a reduction in prevalence (AAPC = -5.6; p<0,001), treatment dropout (AAPC = -13.7; p<0.001), and females with leprosy (AAPC = -0.6; p<0.001); the new grade II case coefficient (AAPC = 2.7; p<0.001) and the proportion of multibacillary cases (AAPC = 2,2; p<0.001) showed a growing trend; spatial distribution was heterogeneous and concentrated in three regions in particular (north, west and south of the state), with variation between the indicators.
Conclusion: persisting leprosy transmission in the state, late diagnosis and high hidden prevalence is suggested.
Keywords: Leprosy; Spatial Analysis; Neglected Diseases; Time Series Studies; Ecological Studies.
Received: September 19, 2018; Accepted: January 11, 2019
 Este é um artigo publicado em acesso aberto sob uma licença Creative Commons
