


Servicios Personalizados
Revista

Articulo
 texto en
  Inglés (pdf)
 Articulo en XML
 Referencias del artículo
 Enviar articulo por email
Indicadores
-
 Citado por SciELO
Links relacionados
-
 Similares en
SciELO
Similares en
SciELO
Compartir

 Permalink
Epidemiologia e Serviços de Saúde
versión impresa ISSN 1679-4974versión On-line ISSN 2237-9622
Epidemiol. Serv. Saúde vol.28 no.3 Brasília set. 2019 Epub 26-Ago-2019
http://dx.doi.org/10.5123/s1679-49742019000300003
ORIGINAL ARTICLE
Lung cancer mortality trends in different urban settings in Brazil, 2000-2015*
1Universidade do Estado do Rio de Janeiro, Instituto de Medicina Social, Rio de Janeiro, RJ, Brasil
Methods:
this was a time series study; lung cancer death records were corrected; linear autoregressive models were used to calculate regression coefficients (β1) and 95% confidence intervals (95%CI) in trend analysis according to sex, in the 30 and over age group, for 19 metropolitan areas (MAs) and the interior regions of 14 Brazilian states; positive β1 indicates upward trends while negative β1 indicates downward trends.
Results:
increases were found in males from interior regions of North and Northeastern Brazilian states, especially in Rio Grande do Norte state (β1=1.03 - 95%CI0.47;1.58); downward trends were also found in males, notably in the Porto Alegre MA (β1=-2.55 - 95%CI-2.79;-2.31); the highest increase in females was found in the interior of Ceará state (β1=0.86 - 95%CI0.79;0.92).
Conclusion:
differentiated patterns according to location and sex were revealed; cancer control measures should be considered above all for women and the interior regions of Brazil.
Keywords: Lung Neoplasms; Mortality; Time Series Studies; Mortality Registries; Urban Area
Introduction
Lung cancer is the most diagnosed neoplasm worldwide and accounted for 11.6% of new cancer cases in 2018. It is estimated to be the leading global cause of death from cancer, corresponding to 1.8 million deaths in 2018.1
Of all male deaths from neoplasms registered in Brazil in 2015, 15,514 (14%) were attributed to lung cancer, thus being the leading cause of death from cancer in this population. Among females, lung cancer accounted for 10,978 (11,1%) cancer deaths and came in second place after breast cancer.2
Worldwide, although the total annual number of lung cancer deaths is high, studies have indicated a falling mortality trend in males in different countries, with mean annual percentage variance of between -3.6 and -1.1% in the period 2007-2017. On the other hand, an inverse trend or stability is being seen in females.3,4 In Brazil diverging behavior in lung cancer mortality by sex is also being seen, with a predominant downward trend in males and a notable upward trend in females.5 Notwithstanding, heterogeneity of mortality trends owing to this neoplasm among regions and settings with differing levels of urbanization has been little explored in Brazil.
Geographic variations and distinct trend patterns between the sexes have suggested differentiated levels and stages of the tobacco smoking epidemic in subpopulations around the world.6 Other important factors besides tobacco smoking are associated with lung cancer: genetic susceptibility, passive smoking, pre-existing inflammatory lung disease and infections, occupational exposure to asbestos and radon, environmental air pollution and domestic biomass burning.7
Information about cancer incidence is scarce in Brazil, and high lung cancer lethality brings mortality and incidence patterns close to each other. Nevertheless, death statistics can be particularly useful in epidemiological studies by assisting understanding of lung cancer geographic distribution and quantifying its magnitude.
In this sense, a gradual improvement in the quality of mortality information has been seen in Brazil. Cancer deaths are also believed to be well recorded in Brazil. Notwithstanding, coding errors and inadequate classification of the “underlying cause of death” variable on Death Certificates may occur and compromise the accuracy of this information. These are problems to be taken into consideration when analyzing cancer statistics based on mortality information.8
The main objective of this article was to analyze lung cancer mortality trends in different urban settings in Brazil in the period 2000-2015.
Methods
This is a time series study which analyzed lung cancer mortality in adult males and females aged over 30 years old, in 19 Metropolitan Areas (MAs) and also in the interior regions of 14 Federative Units (FUs) where the Metropolitan Area includes the state capital, in the period 2000-2015.
Lung cancer deaths were considered to be those with codes C33 and C34 of the International Statistical Classification of Diseases and Related Health Problems, 10th Revision (ICD-10), relating to the trachea, bronchus and lungs. Annual data were retrieved from the Mortality Information System (SIM) operated by the Brazilian National Health System Information Technology Department (DATASUS), disaggregated by sex and age, for the municipalities comprising the MAs and for the interior regions of the FUs corresponding to the respective MAs.
The resident population used as the denominator of the mortality coefficients was estimated by the Interagency Health Information Network (RIPSA), Ministry of Health and Brazilian Institute of Geography and Statistics (IBGE), whereby this information was collected using the same stratification as that used for deaths on the DATASUS website.
We included deaths of residents of all MAs with more than 1.5 million inhabitants on December 31st 2015. The term MA, used generically in this study, is based on the concept of large urban concentrations defined by IBGE. The term RIDE (Integrated Development Region) applies basically to the urban agglomerations forming part of municipalities of different FUs.9
The creation of MAs is the responsibility of the FUs, whereas the creation of RIDEs falls under the Federal Government’s responsibility. Neither MAs nor RIDEs have specific legislation. In order to avoid misjudgments when selecting highly urbanized MAs, we used population size as the criterion.
In order to control and guarantee comparability of MAs over time, with regard to the composition of municipalities, we created basic comparable geographic units, taking as a framework the 409 municipalities forming part of the 19 MAs assessed in 2015. Clearly the potential variations in the time series would not be attributed to alterations in the composition of municipalities in those MAs.
When grouped together, the municipalities of the interior regions of the FUs formed 14 distinct geographic units, enabling comparison between densely populated, urbanized and economically developed areas (i.e. the MAs) with less urbanized regions of the territory (the interior regions of the FUs).
São Paulo state had five MAs: Campinas; São Paulo (capital); Sorocaba; Vale do Paraíba and Litoral Norte. Only the municipalities of the São Paulo (capital) MA were excluded in order to reconstitute the interior region of that state. The remaining São Paulo state municipalities were treated as being in its interior region, serving as a contrast to the MA of the state capital.
In all the study had a total of 33 geographic analysis units, forming groups of MAs and interior regions of FUs. The 19 MAs are shown by decreasing population size, as follows: São Paulo; Rio de Janeiro; Belo Horizonte; Federal District (DF) and Surrounding Area RIDE; Porto Alegre; Fortaleza; Salvador; Recife; Curitiba; Campinas; Manaus; Vale do Paraíba and Litoral Norte; Goiânia; Belém; Grande Vitória; Sorocaba; Baixada Santista; Grande São Luís; and Natal.
The 14 geographic units of the second group are formed by municipalities in the interior regions of the FUs, also by the following decreasing population size: São Paulo; Minas Gerais; Bahia; Paraná; Rio Grande do Sul; Pará; Maranhão; Pernambuco; Ceará; Rio de Janeiro; Goiás; Espírito Santo; Rio Grande do Norte; and Amazonas.
With the aim of enhancing trend estimates, we corrected underlying cause of death as described in detail further on. We adopted the strategy used by WHO and research reporting methods, taking into consideration clinical and histological aspects of malignant lung neoplasm.10,11
We checked unknown information about sex and age of the dead. We found that the occurrence of unknown information would not impact the coefficients when they were disaggregated by year, age group, sex and place of residence, since only 182 lung cancer deaths recorded on the SIM system during the period under consideration (0.056%) had no information regarding the ‘sex’ or ‘age variables. There was therefore no need to impute these deaths. In view of this we used the following formula to calculate the correction factors used in the process:
Ill-defined causes of death were proportionally redistributed by sex, geographic unit and 5-year age group with effect from 30 years of age. Ill-defined causes were considered to be: (i) ICD-10 Chapter XVIII (Symptoms, signs and abnormal clinical and laboratory findings, not elsewhere classified (ICD10 Codes: R00 to R99]); (ii) Sudden cardiac arrest due to underlying cardiac condition (Code I46.1); (iii) Cardiac arrest, cause unspecified (I46.9); (iv) Hypotension, unspecified (I95.9); (v) Acute respiratory failure (J96.0); (vi) Respiratory failure, unspecified (J96.9); and (vii) Respiratory failure of newborn (P28.5).
In the next stage we redistributed ‘garbage codes’12 as per the scheme shown in Figure 1.
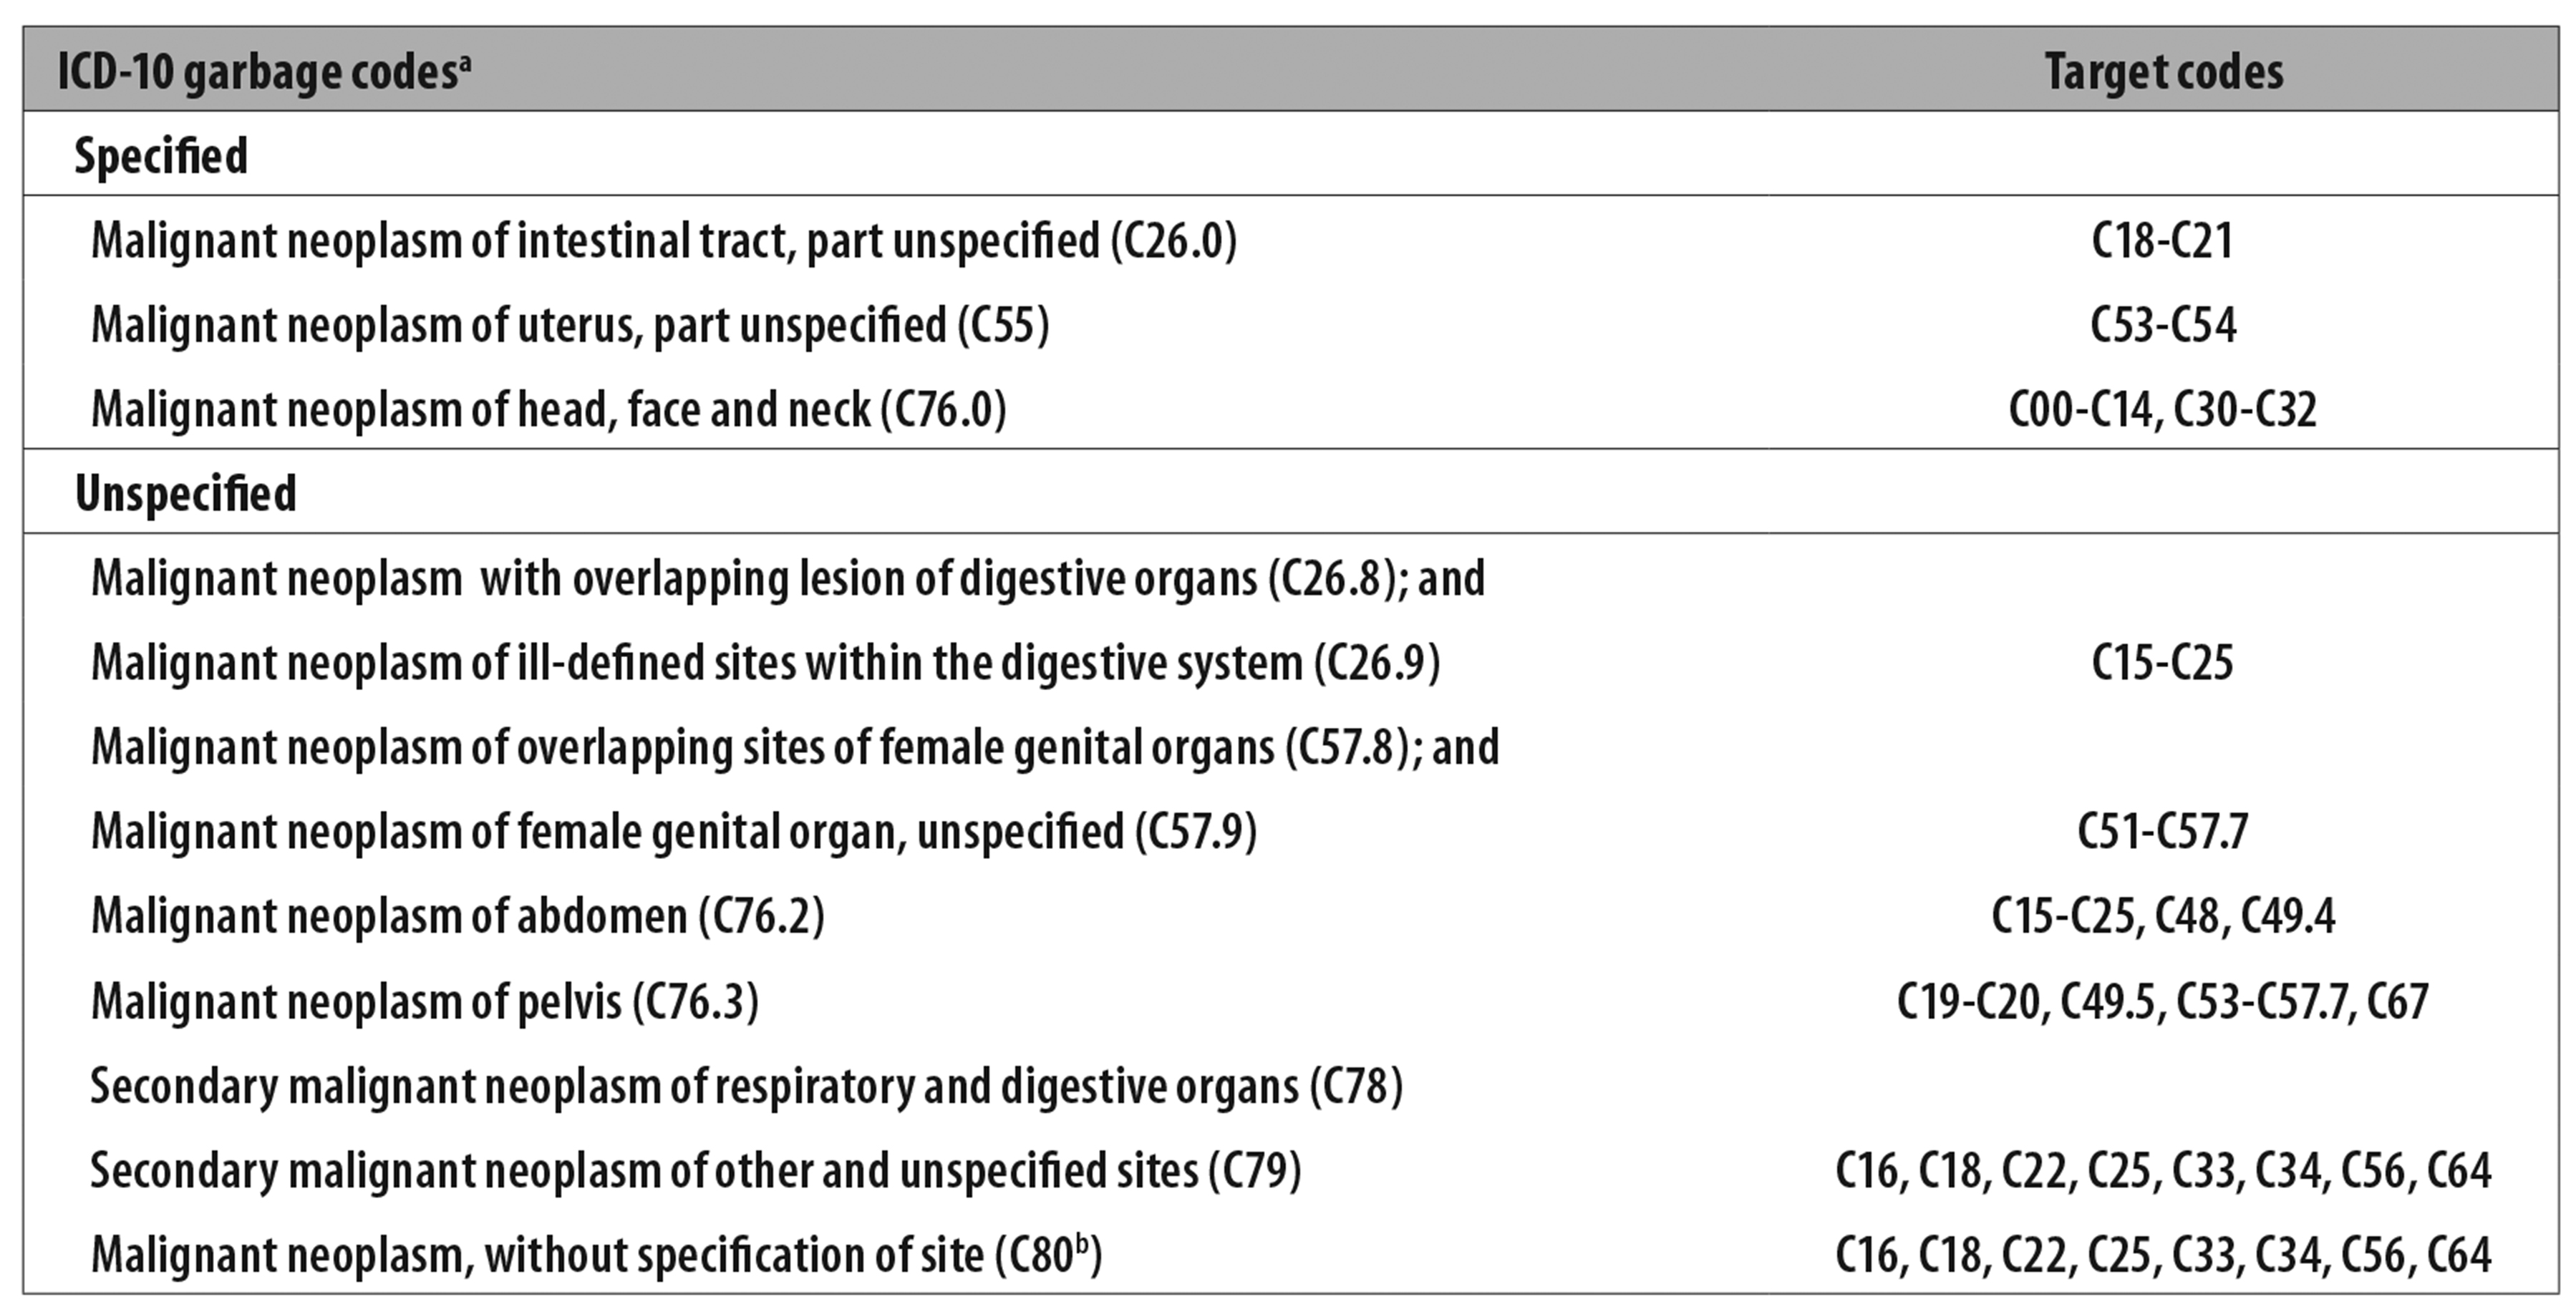
a) ICD-10: International Statistical Classification of Diseases and Related Health Problems - Tenth Revision.
b) Only deaths in excess of 5% having this ICD code as underlying cause were distributed.
Source: Scheme adapted from Silva GA et al.
Figure 1 - Recoding scheme based on garbage code mortality and respective target codes
It should be noted that deaths recorded in the ‘underlying cause’ variable using Code C80 - Malignant neoplasm, without specification of site - were redistributed discarding 5% of this total, given that an equivalent proportion of malignant neoplasms is of an unspecified nature.13
Following correction, we calculated the crude annual lung cancer mortality coefficients for the 33 units to be analyzed, by sex and the 30 years and over age group. These coefficients were then age-standardized based on the estimated Brazil standard population for the year 2010, according to the IBGE population projection.14
The standardized coefficient ratio was calculated comparatively, taking MA as the numerator and FU as the denominator. The evolution of the coefficient ratio over time was described by sex for the 14 selected FUs.
In order to analyze the lung cancer mortality time trend, by sex and geographic unit, we adjusted a linear trend model defined by the following formula
with first order autoregressive errors and parameters estimated using the Gaussian maximum likelihood method.
We also calculated 95% confidence intervals (95%CI) for the β1 coefficients. The β1 coefficients represent the mean average variation of the death coefficients and vary according to the slope of the average line. Positive β1 values indicate coefficient increase during the study period and have an increasing slope, while negative values indicate coefficient decrease and have a decreasing slope.
The error terms for regression in time series are usually correlated and require autocorrelation modeling.15 For the purposes of the model in question, we verified the assumptions about the residuals with regard to normal distribution, zero mean, constant variance and independence. We then adjusted the model for the Ɛt residuals series, where
The research project did not require appraisal by the Research Ethics Committee/National Research Ethics Commission (CEP/CONEP), because it used secondary data, whereby it is not possible to identify people, as established by National Health Council (CNS) Resolution No. 510, dated April 7th 2016.
Results
The overall lung cancer mortality coefficient in the regions studied was 28.4/100,000 inhab. in 2000 and 25.6/100,000 inhab. in 2015. In those regions the population aged 30 or over accounted for 80,313,347 inhabitants in 2010 and represented 85.9% of the Brazilian population in the same age group.
Lung cancer mortality was greater in males than in females in the 16 years assessed. In the first year of the series, male coefficients varied between 4.9/100,000 inhabitants in the interior region of Maranhão state and 109.6/100,000 inhab. in the Porto Alegre MA. In 2015, risk of death from this cause among males varied between 16.3/100,000 inhab. in the interior region of Bahia state and 74.3/100,000 inhab. in the Porto Alegre MA. In 2015, we found the same pattern as seen in the year 2000 with regard to coefficient magnitude per location (Table 1).
Table 1 - Standardized lung cancer mortality coefficients by sex and geographic analysis unit, 2000-2015
a) FU: Federative Unit.
b) MA: metropolitan area.
c) Metropolitan area with no complementary geographic unit.
Among females, the lung cancer mortality coefficient in the year 2000 varied between 2.1/100,000 inhab. in the interior region of Maranhão state and 31.4/100,000 inhab. in the Porto Alegre MA; in 2015, variation of this coefficient among females ranged from 9.8/100,000 inhab. in the inner region of Bahia state to 36.1/100,000 inhab. in the Porto Alegre MA (Table 1). Also in 2015, the ten highest female coefficients varied between 22.8/100,000 inhab. in the Grande São Luís MA and 36.1/100,000 in the Porto Alegre MA, two of which were found in inner state regions: interior of Rio Grande do Sul state (30.4/100,000 inhab.) and interior of Paraná state (23.2/100,000 inhab.) (Table 1).
Figure 2 shows the time evolution of the standardized mortality coefficients ratio between the MAs and the interior regions of the FUs over the years. Among males, coefficients in the MAs were found to be up to 9.3 times higher than in the interior regions of the corresponding UFs (Grande São Luís MA/interior region of Maranhão state, 2002).
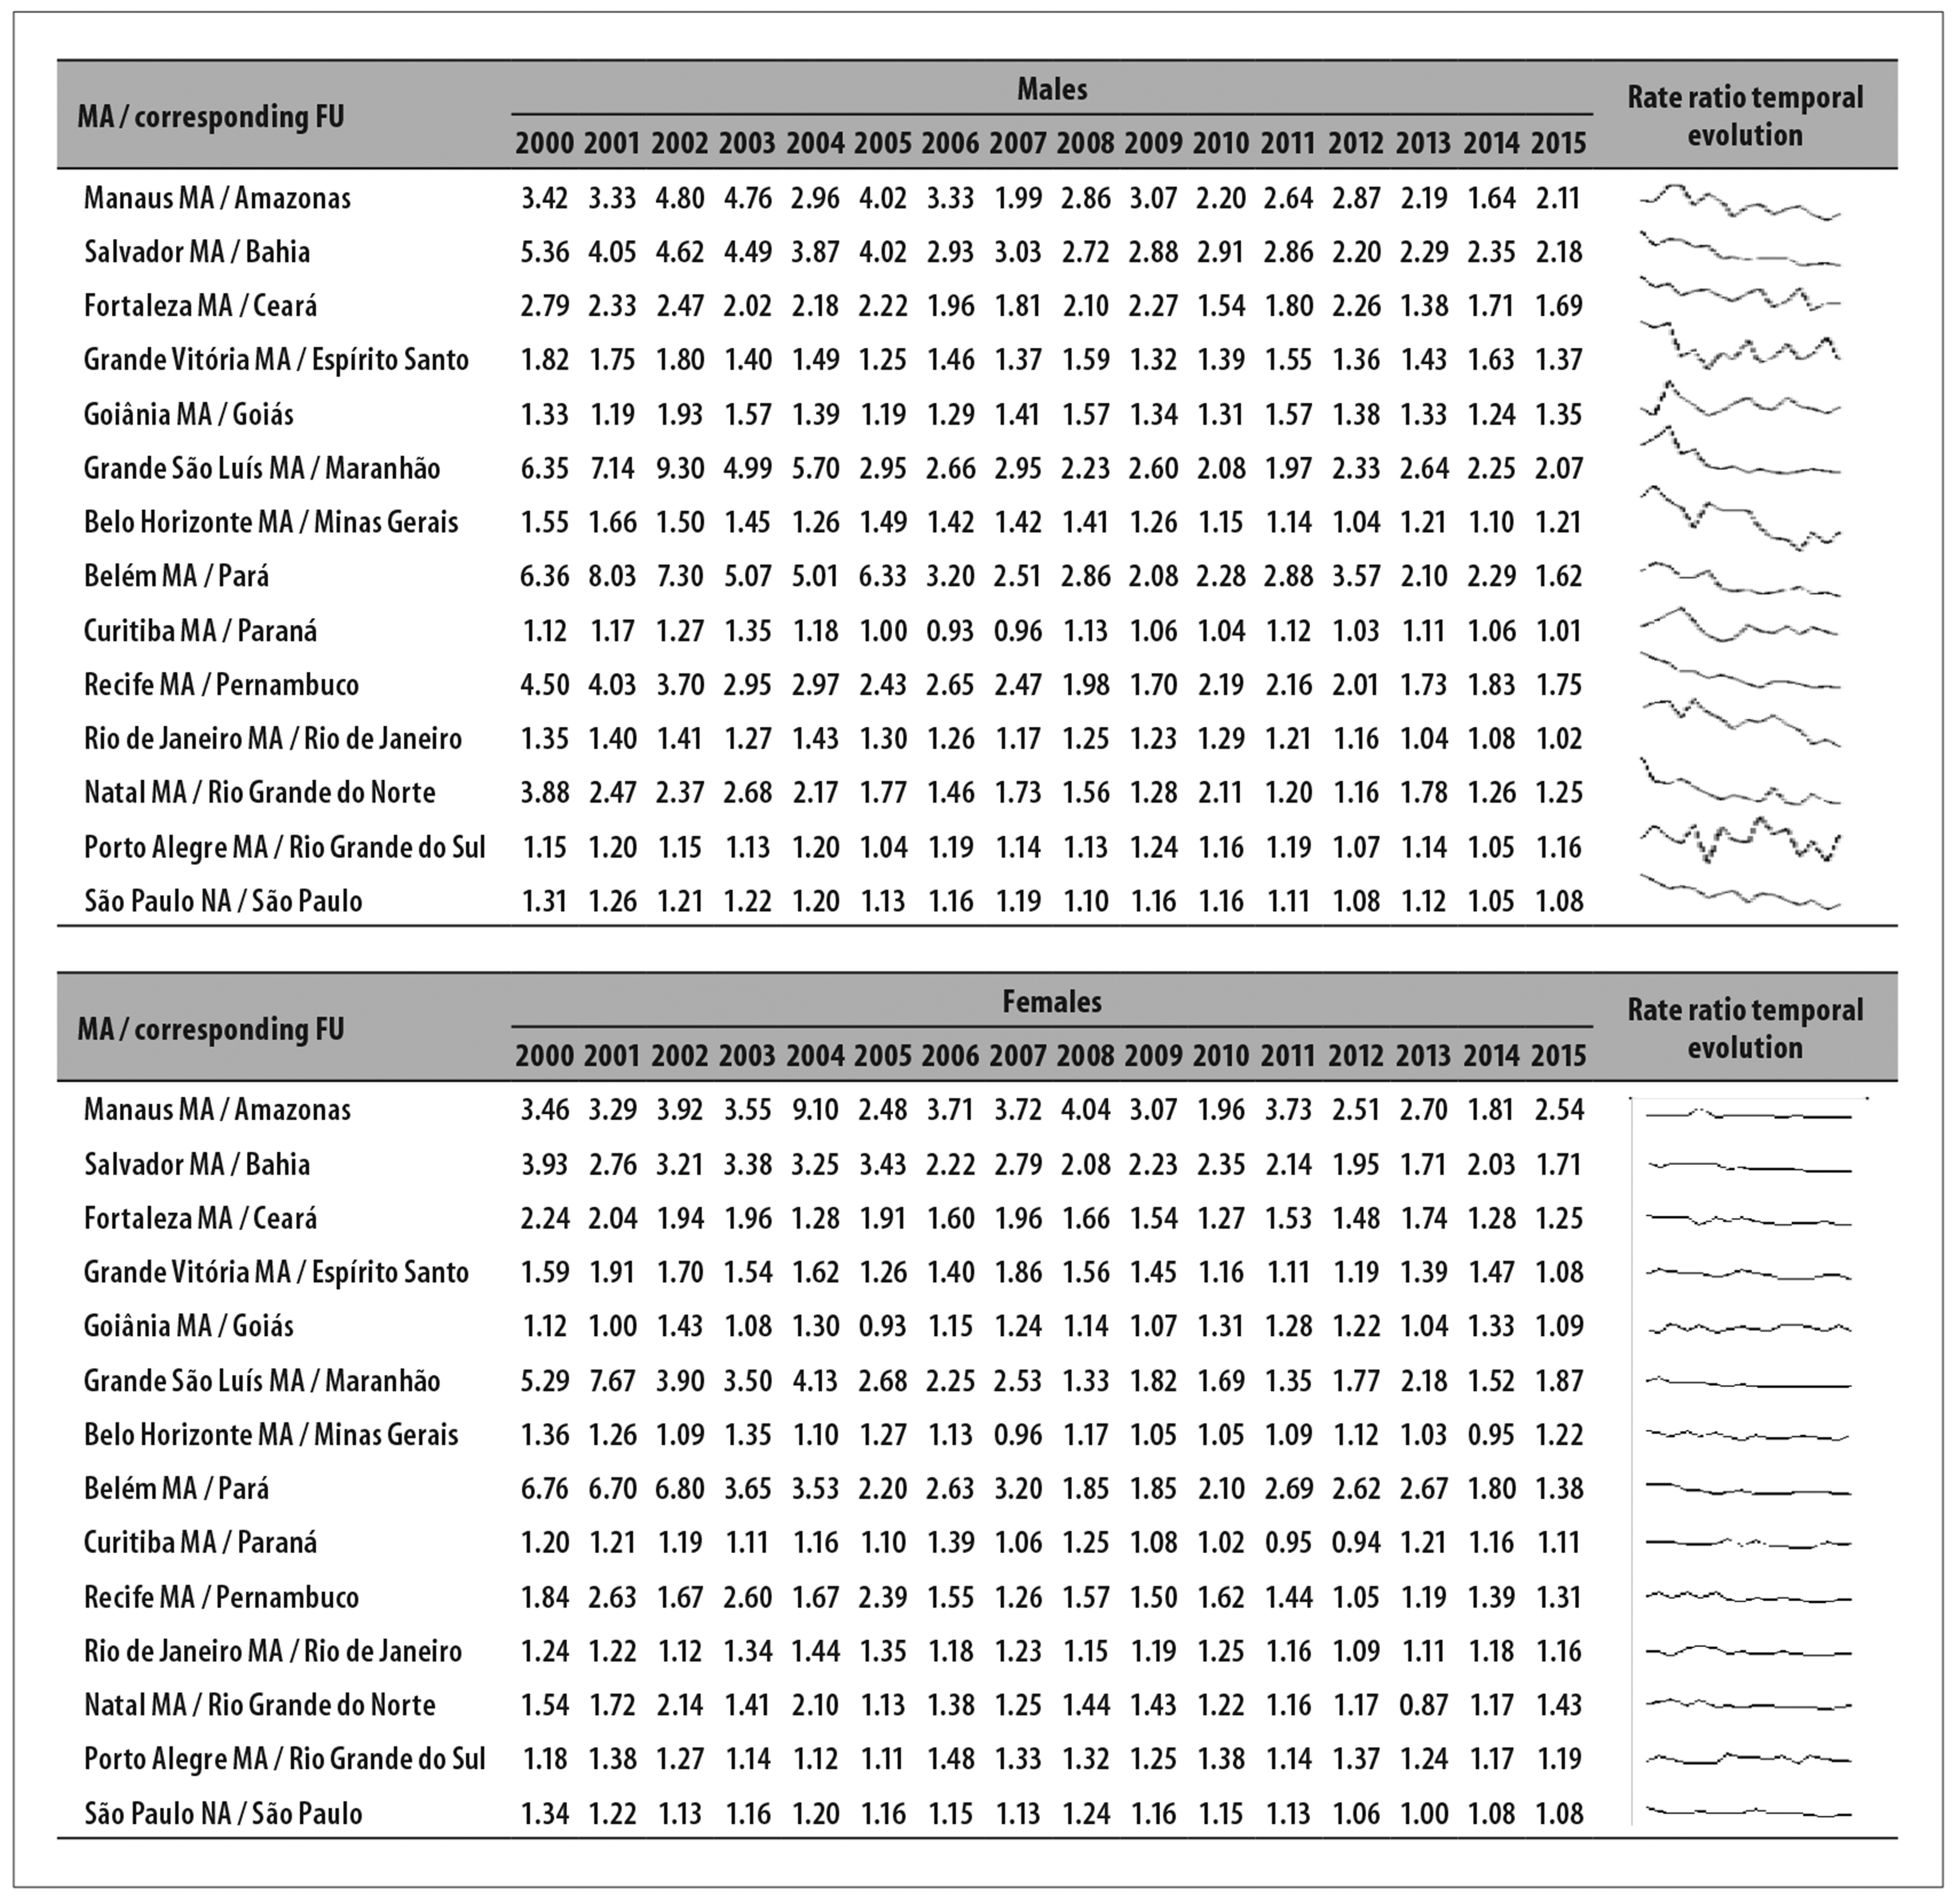
Figure 2 - Temporal evolution of lung cancer mortality coefficient ratio, by sex, state capital metropolitan area (MA) / Federative Unit (FU) interior region, 2000-2015
Among females, the discrepancy between MAs and interior regions of the states follows a similar pattern to that among males, in particular in North and Northeast Brazil. However, time evolution of the ratios suggests that the disparity among males tends to decrease over time, more strongly than among females. The largest difference among females was found in 2004: the coefficient was 9.1 times higher in the Manaus MA than in the interior region of the corresponding state (Figure 2).
Temporal analysis of lung cancer mortality coefficients among males showed a predominant falling trend in MAs. Mean annual reduction in death coefficients was slight in the Recife MA (β1=-0.63 - 95%CI-1.02;-0.24) and more pronounced in the Porto Alegre MA (β1=-2.55 - 95%CI-2.79;-2.31). However, an increasing trend was found in eight geographic units in North and Northeast Brazil. The highest mean annual coefficient increase was found in the interior region of Rio Grande do Norte state (β1=1.03 - 95%CI0.47;1.58). The Fortaleza MA was the only MA showing an increase (β1=0.48 - 95%CI0.20;0.75). A slight increase was also found in the interior region of Minas Gerais state (β1=0.09 - 95%CI0.01;0.17) (Figure 3).
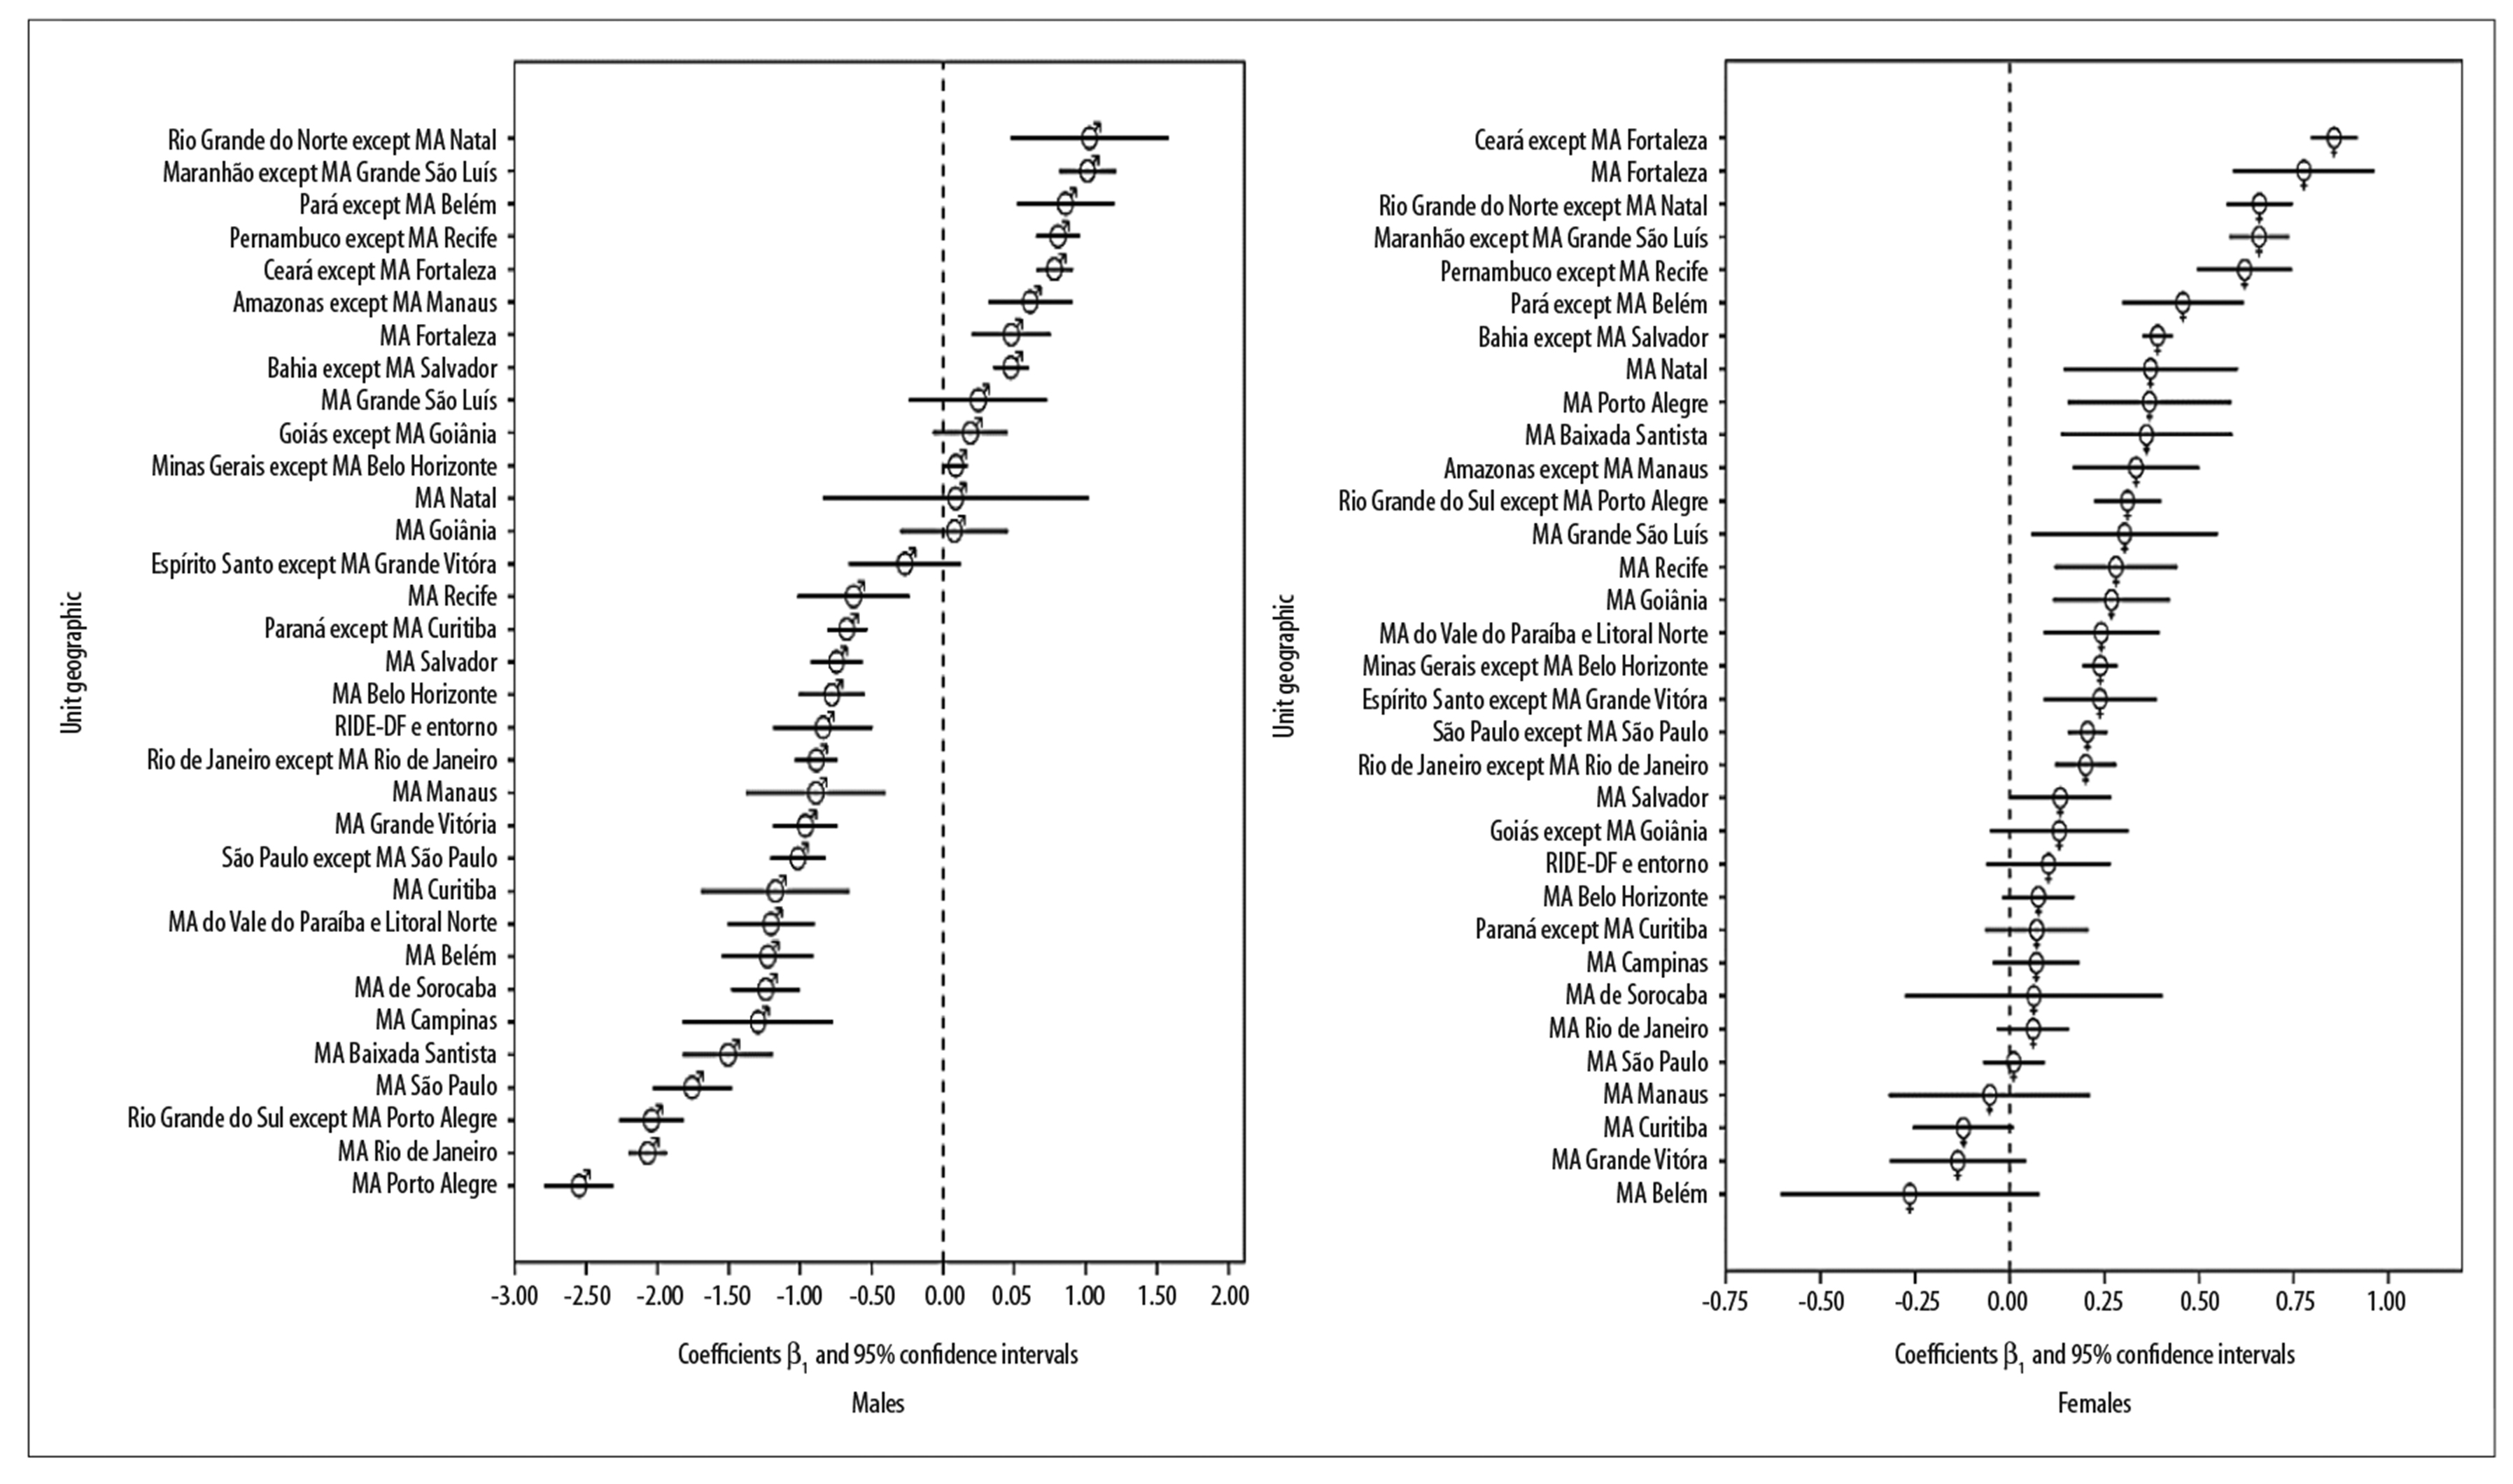
Note: Geographic analysis units in decreasing β1 order.
Figure 3 - Linear trends of standardized lung cancer coefficients by sex and geographic analysis unit, 2000-2015
Particularly among females, the increasing trend in mean average mortality coefficients was found in 20 of the 30 units assessed. The highest coefficients were found in Northeast Brazil, especially in the interior region of Ceará state (β1=0.86 - 95%CI0.79;0.92), followed by the MA of its capital city Fortaleza (β1=0.78 - 95%CI0.59;0.96). A lower increase was found in Rio de Janeiro state (β1=0.20 - 95%CI0.12;0.28). No falling trend was found for females (Figure 3). Additional coefficients can be seen in the Table 2.
Table 2 - Lung cancer mortality trenda β1 angular coefficient values and respective confidence intervals,a by geographic analysis units and sex, 2000-2015
| Geographic unit | Males | Females | |||||
|---|---|---|---|---|---|---|---|
| Beta | Lower limit | Upper limit | Beta | Lower limit | Upper limit | ||
| State interior region | Amazonas except Manaus MA | 0.61 | 0.32 | 0.90 | 0.33 | 0.17 | 0.50 |
| Bahia except Salvador MA | 0.48 | 0.35 | 0.60 | 0.39 | 0.35 | 0.43 | |
| Ceará except Fortaleza MA | 0.78 | 0.65 | 0.91 | 0.86 | 0.79 | 0.92 | |
| Espírito Santo except Grande Vitória MA | -0.27 | -0.66 | 0.12 | 0.24 | 0.09 | 0.39 | |
| Goiás except Goiânia MA | 0.19 | -0.07 | 0.45 | 0.13 | -0.05 | 0.31 | |
| Maranhão except Grande São Luís MA | 1.01 | 0.81 | 1.21 | 0.66 | 0.58 | 0.74 | |
| Minas Gerais except Belo Horizonte MA | 0.09 | 0.01 | 0.17 | 0.24 | 0.19 | 0.28 | |
| Pará except Belém MA | 0.86 | 0.52 | 1.20 | 0.46 | 0.30 | 0.62 | |
| Paraná except Curitiba MA | -0.67 | -0.81 | -0.54 | 0.07 | -0.07 | 0.21 | |
| Pernambuco except Recife MA | 0.81 | 0.65 | 0.96 | 0.62 | 0.50 | 0.75 | |
| Rio de Janeiro except Rio de Janeiro MA | -0.89 | -1.04 | -0.74 | 0.20 | 0.12 | 0.28 | |
| Rio Grande do Norte except Natal MA | 1.03 | 0.47 | 1.58 | 0.66 | 0.57 | 0.75 | |
| Rio Grande do Sul except Porto Alegre MA | -2.04 | -2.27 | -1.82 | 0.31 | 0.22 | 0.40 | |
| São Paulo except São Paulo MA | -1.02 | -1.21 | -0.83 | 0.21 | 0.15 | 0.26 | |
| Metropolitan Area (MA) | Federal District RIDE | -0.84 | -1.19 | -0.49 | 0.10 | -0.06 | 0.27 |
| Baixada Santista MA | -1.51 | -1.82 | -1.19 | 0.36 | 0.13 | 0.59 | |
| Belém MA | -1.23 | -1.55 | -0.91 | -0.26 | -0.61 | 0.08 | |
| Belo Horizonte MA | -0.78 | -1.01 | -0.55 | 0.08 | -0.02 | 0.17 | |
| Campinas MA | -1.30 | -1.82 | -0.77 | 0.07 | -0.04 | 0.18 | |
| Curitiba MA | -1.17 | -1.70 | -0.65 | -0.12 | -0.26 | 0.01 | |
| Sorocaba MA | -1.24 | -1.48 | -1.00 | 0.06 | -0.28 | 0.40 | |
| Vale do Paraíba and Litoral Norte MA | -1.20 | -1.51 | -0.90 | 0.24 | 0.09 | 0.39 | |
| Fortaleza MA | 0.48 | 0.20 | 0.75 | 0.78 | 0.59 | 0.96 | |
| Goiânia MA | 0.08 | -0.30 | 0.46 | 0.27 | 0.12 | 0.42 | |
| Grande São Luís MA | 0.25 | -0.24 | 0.73 | 0.30 | 0.06 | 0.55 | |
| Grande Vitória MA | -0.96 | -1.19 | -0.74 | -0.14 | -0.32 | 0.04 | |
| Manaus MA | -0.89 | -1.38 | -0.40 | -0.05 | -0.32 | 0.21 | |
| Natal MA | 0.09 | -0.84 | 1.02 | 0.37 | 0.14 | 0.60 | |
| Porto Alegre MA | -2.55 | -2.79 | -2.31 | 0.37 | 0.15 | 0.59 | |
| Recife MA | -0.63 | -1.02 | -0.24 | 0.28 | 0.12 | 0.44 | |
| Rio de Janeiro MA | -2.07 | -2.20 | -1.94 | 0.06 | -0.03 | 0.16 | |
| Salvador MA | -0.75 | -0.93 | -0.57 | 0.13 | 0.00 | 0.27 | |
| São Paulo MA | -1.76 | -2.03 | -1.48 | 0.01 | -0.07 | 0.09 | |
a) Linear trend of lung cancer mortality coefficients standardized according to Brazilian standard population (2010), calculated after database correction.
Discussion
There was a decreasing time trend for lung cancer mortality among males in 15 MAs. At the same time, a significant increase was found in the inner regions of nine FUs, predominantly in North and Northeast Brazil. In the Porto Alegre, São Paulo and Rio de Janeiro MAs, important reductions were found among males but not among females. Lung cancer mortality was found to have increased in 20 of the units analyzed, eight of which were MAs: Fortaleza, Natal, Porto Alegre, Baixada Santista, Grande São Luís, Recife, Goiânia, Vale do Paraíba and Litoral Norte. A stable situation was found in the remaining geographic units.
Lung cancer is estimated have accounted for 2.3% of total deaths in Brazil in 2016 and was the leading cause of death from malignant neoplasms.16 However, the increase in deaths over the time period may also be attributed, albeit partially, to the proportional growth and aging of the Brazilian population.
A recent study identified a 12% fall in the lung cancer mortality coefficient between 1990 and 2015 for Brazil as a whole. Even so, the coefficient for lung cancer mortality was the second highest among malignant neoplasms in males. Among females, an expressive increase of 20.7% in the coefficient was reported for the period, with lung cancer as the second leading cause of death from neoplasms in females after breast cancer.17
Increased lung cancer mortality among males in Northeast Brazilian state capital cities and the fall in this rate with effect from the mid 1990s in the other state capitals have been reported elsewhere,18 as has the difference in mortality behavior between the interior regions of states and their capitals.19
Repeated identification of an irregular and especially unfavorable pattern in mortality from this neoplasm, with evidence of geographic disparity, suggests the need for greater surveillance efforts to ensure that lung cancer risk factor control programs reach the entire population equally, thus impacting positively on the scenario analyzed.
An increasing trend was effectively found in the interior regions of the North and Northeast Brazilian states, while some of the MAs of these states showed stable or declining lung cancer mortality. Even considering diagnosis difficulties in these places, the findings of our study may possibly indicate that the tobacco epidemic may have occurred later in those regions in comparison to the rest of Brazil.20
The trend patterns found in MAs were similar to those described for the Brazilian state capitals.19 It appears to be reasonable to conclude that the state capitals, to the detriment of the municipalities surrounding them, have an important influence on the lung cancer mortality pattern found in the MAs, where the urban center is the capital of the FU.
The contrast between MAs and the interior regions of the UFs was perceptible in the magnitude of the coefficients and trend behavior. Four interior region geographic units - of the states of Paraná, Rio Grande do Sul, Rio de Janeiro and São Paulo - showed a favorable trend, although only among the male population.
This contrast should be viewed with caution. Dissimilarities in tobacco smoking prevalence rates and in levels of air pollution between MAs and interior regions of the states could explain part of these differences. MAs tend to have a better structured and stronger mortality notification than inner state locations. This can lead to coefficients being underestimated in the latter.
It is possible that access to health services providing cancer diagnosis and treatment and the influence of tobacco smoking control programs may be unequal not only between different Brazilian regions but also within the same FU. People living in socioeconomically developed areas usually have access to health resources and cancer prevention and control policies that do not always reach people who live in inner state regions, on the outskirts of large cities or who are otherwise underprivileged.21
In high-income countries, lung cancer mortality coefficients tend to be higher, when compared to those found in poorer countries. Considered to be a consequence of “Westernization”, the effect observed in developed populations would appear to be related to higher rates of tobacco smoking and air pollution.3 Similarly, higher lung cancer mortality coefficients are reported in urban areas when compared to rural areas.22
The counterpoint found in mortality rates in countries with differing levels of development could be extrapolated to Brazilian reality, by comparing MAs with interior regions, or by comparing different regions of the country itself: greater magnitude of mortality from this form of neoplasm in MAs in relation to interior regions and, likewise, in the South and Southeast regions in relation to the North and Northeast regions of the country. Regional inequality appears to affect survival in Brazil: geographical differences of up to twofold survival, without adjustment for histological type, have been reported.4
The increasing trend among women - at a considerable rate - in the interior of Northeast Brazil reinforces the evidence that lung cancer epidemiology can have distinct characteristics between the sexes, influenced by hormonal, genetic, environmental and behavioral factors.23
The decline of this neoplasm among males and its increased stability among females form a pattern found in other parts of the world. This trend could be related, above all, to increased tobacco smoking among women observed in recent years.20 Moreover, in Brazil this difference according to sex has been decreasing since the 1980s presumably because of variations in tobacco smoking and exposure to passive smoking. In this respect it is appropriate to rule out women having greater difficulty in giving up smoking.24
It is estimated that 15% of smokers develop lung cancer. However, some 85 to 90% of cases arise from tobacco.25 As the main risk factor for lung cancer, tobacco smoking has been addressed with good results in Brazil since the 1980s. Regulatory measures and control policies based on targets for reducing noncommunicable diseases and tobacco smoking prevalence have been intensified in Brazil since the 2000s.26,27
The long latency period of approximately 30 years between exposure to tobacco and its derivatives and the subsequent occurrence of death from lung cancer results in the impact caused by the decline in tobacco smoking prevalence taking a long time to appear. National surveys on the current proportion of smokers aged 18 or over found negative percentage variance of 37.4% in males compared to 31.9% in females between 1989 and 2003. Between 2003 and 2013, however, the fall in tobacco smoking prevalence was more pronounced in females (-40.2%) than in males (-30.3%).28
Given that the tobacco epidemic in Brazil occurred firstly in males and then in females and began in the 1970s, this may explain part of the differences found in the mortality trends between the sexes.24
The expansion of tobacco smoking in Brazil, notably among females, has varied according to geographic region and has undergone a process of moving from the state capitals into interior regions of the states. In view of this fact, it is expected that female mortality will continue to increase in the forthcoming years, both in the state capitals and more urbanized regions and also in the interior.
Despite shortcomings relating to the filling out of death certificates, high proportions of deaths from ill-defined causes and unspecific diagnoses, i.e. garbage codes, point to the population having problems with health service access, care and ability to diagnose.
In spite of the reduction seen in the volume of deaths will ill-defined underlying causes, variability in the proportion of these deaths between or within regions and states is expected in Brazil.19 Whereas the proportion of ill-defined causes was less than 1% in the Federal District in 2013, in the state of Amazonas it was approximately 13%.2
This difference can alter the real magnitude of coefficients of mortality from specific causes and result in errors in analyses and comparisons between different places.
A limitation of this study is inherent to the use of secondary data. However, in order to improve the quality of the information, we opted to correct death data, so as to increase the reliability of underlying cause of death without causing case overestimation. Death records in state capitals are known to be of better quality when compared to those issued in interior municipalities, and the same can be said of urban centers in relation to their surrounding outskirts. For this reason we corrected underlying cause of death for the MAs, given that they encompass not only the central municipality but also its peripheral municipalities. Underlying cause of death was also corrected for the interior regions.
It is therefore unlikely that the increased trend found among females stems from the quality of death records having improved over the years, since there would be no reason or justification for unequal improvement between men and women.
Despite the future perspective of identifying new molecular biomarkers, the development of targeted therapy drugs and modern technologies for cancer diagnosis and treatment, there is an imposition of increased costs on health services that means they are unlikely to be feasible or available for the entire population. In view of this, it is assumed that it will take time for the progress mentioned and increased survival to occur before cancer mortality is reduced.
Recently, international bodies have begun recommending lung cancer screening for groups at higher risk with the aim of reducing the mortality burden.29,30 In Brazil this discussion needs to be increased and agreement reached between specialists, considering new possibilities of addressing this important Public Health problem without compromising the successful Brazilian anti-tobacco policy.
The dynamics of lung cancer mortality in course are complex and are a big challenge for the Brazilian National Health System (SUS). Actions to reduce mortality remain centered on tobacco smoking prevention. Similarly, we suggest that tobacco control strategies be implemented and strengthened in the interior regions of the country, paying special attention to females.
This study comprehensively assessed lung cancer mortality trends in various different contexts, levels of urbanization and development in Brazil. The findings provide evidence that there is not just one single lung cancer mortality pattern in the country. In males a falling mortality trend was predominant, although in the interior regions of North and Northeast Brazil there was still a rising trend among this population. In women a rising trend in mortality coefficients prevailed. Similarly, the highest increases in this group were also found in the interior regions of North and Northeast Brazil.
REFERENCES
1. Ferlay J, Ervik M, Lam F, Colombet M, Mery L, Piñeros M, et al. Global cancer observatory: cancer today [Internet]. Lyon: International Agency for Research on Cancer; 2018 [cited 2019 Jun 12]]. Available from: Available from: https://gco.iarc.fr/today [ Links ]
2. Ministério da Saúde (BR). Departamento de Informação do SUS. Sistema de informações sobre mortalidade [Internet]. Brasília: Ministério da Saúde; 2017 [citado 2019 jun 12]. Disponível em: Disponível em: http://www2.datasus.gov.br/DATASUS/index.php?area=0205 [ Links ]
3. Wong MCS, Lao XQ, Ho KF, Goggins WB, Tse SLA. Incidence and mortality of lung cancer: global trends and association with socioeconomic status. Sci Rep [Internet]. 2017 Oct [cited 2019 Jun 12];7(1):14300. Available from: Available from: https://www.ncbi.nlm.nih.gov/pmc/articles/PMC5662733/ . doi: 10.1038/s41598-017-14513-7 [ Links ]
4. Cheng TY, Cramb SM, Baade PD, Youlden DR, Nwogu C, Reid ME. The international epidemiology of lung cancer: Latest trends, disparities, and tumor characteristics. J Thorac Oncol [Internet]. 2016 Oct [cited 2019 Jun 12];11(10):1653-71. Available from: Available from: https://www.jto.org/article/S1556-0864(16)30496-8/fulltext . doi: 10.1016/j.jtho.2016.05.021 [ Links ]
5. Malta DC, Abreu DMX, Moura L, Lana GC, Azevedo G, França E. Tendência das taxas de mortalidade de câncer de pulmão corrigidas no Brasil e regiões. Rev Saúde Pública [Internet]. 2016 jun [citado 2019 jun 12];50(33):1-10. Disponível em: Disponível em: http://www.scielo.br/pdf/rsp/v50/pt_0034-8910-rsp-S1518-87872016050006209.pdf . doi: 10.1590/S1518-8787.2016050006209 [ Links ]
6. Torre LA, Bray F, Siegel RL, Ferlay J, Lortet-Tieulent J, Jemal A. Global cancer statistics, 2012. CA Cancer J Clin [Internet]. 2015 Mar [cited 2019 Jun 12];65(2):87-108. Available from: Available from: https://onlinelibrary.wiley.com/doi/full/10.3322/caac.21262 . doi: 10.3322/caac.21262 [ Links ]
7. Groot P, Munden RF. Lung cancer epidemiology, risk factors, and prevention. Radiol Clin N Am [Internet]. 2012 Sep [cited 2019 Jun 12];50(5):863-76. Available from: Available from: https://www.ncbi.nlm.nih.gov/pubmed/22974775 . doi: 10.1016/j.rcl.2012.06.006 [ Links ]
8. Laurenti R, Jorge MHPM, Gotlieb SLD. Mortalidade segundo causas: considerações sobre a fidedignidade dos dados. Rev Panam Salud Pública [Internet]. 2008 [citado 2019 jun 12];23(5):349-56. Disponível em: Disponível em: https://scielosp.org/pdf/rpsp/2008.v23n5/349-356/pt [ Links ]
9. Instituto Brasileiro de Geografia e Estatísticas. Arranjos populacionais e concentrações urbanas no Brasil [Internet]. Rio de Janeiro: Instituto Brasileiro de Geografia e Estatísticas; 2015 [citado 2019 jun 12]. 167 p. Disponível em: Disponível em: https://www.ibge.gov.br/geociencias/organizacao-do-territorio/divisao-regional/15782-arranjos-populacionais-e-concentracoes-urbanas-do-brasil.html?=&t=o-que-e [ Links ]
10. Mathers CD, Ma Fat D, Inoue M, Rao C, Lopez AD. Counting the dead and what they died from: an assessment of the global status of cause of death data. Bull World Health Organ [Internet]. 2005 Mar [cited 2019 Jun 12];8383(3):171-7. Available from: Available from: https://apps.who.int/iris/bitstream/handle/10665/72966/bulletin_2005_83%283%29_171-177.pdf?sequence=1&isAllowed=y [ Links ]
11. Silva GA, et al. Relatório da pesquisa: estimativas de câncer para o Brasil em 2020 com base em dados corrigidos de óbito. Rio de Janeiro: [S.n.]; 2016. [ Links ]
12. Naghavi M, Makela S, Foreman K, O’Brien J, Pourmalek F, Lozano R. Algorithms for enhancing public health utility of national causes-of-death data. Popul Health Metr [Internet]. 2010 May [cited 2019 Jun 12];8(9). Available from: Available from: https://pophealthmetrics.biomedcentral.com/articles/10.1186/1478-7954-8-9 . doi: 10.1186/1478-7954-8-9 [ Links ]
13. Pavlidis N, Pentheroudakis G. Cancer of unknown primary site. Lancet [Internet]. 2012 abr [cited 2019 Jun 12];379(9824):1428-35. Available from: Available from: https://www.thelancet.com/journals/lancet/article/PIIS0140-6736(11)61178-1/fulltext . doi: 10.1016/S0140-6736(11)61178-1 [ Links ]
14. Instituto Brasileiro de Geografia e Estatística. Projeção da população das unidades da federação por sexo e idade: 2000-2030 [Internet]. Rio de Janeiro: Instituto Brasileiro de Geografia e Estatísticas; 2016 [citado 2019 jun 12]. Disponível em: Disponível em: https://www.ibge.gov.br/estatisticas-novoportal/sociais/populacao/9109-projecao- da-populacao.html?edicao=9116&t=resultados [ Links ]
15. Latorre MRDO, Cardoso MRA. Análise de séries temporais em epidemiologia: uma introdução sobre os aspectos metodológicos. Rev Bras Epidemiol [Internet]. 2001 nov [citado 2019 jun 12];4(3):145-52. Disponível em: Disponível em: http://www.scielo.br/pdf/rbepid/v4n3/02.pdf . doi: 10.1590/S1415-790X2001000300002 [ Links ]
16. Fitzmaurice C, Allen C, Barber RM, Barregard L, Bhutta ZA, Brenner H, et al. Global, regional, and national cancer incidence, mortality, years of life lost, years lived with disability, and disability-adjusted life-years for 32 cancer groups, 1990 to 2015: a systematic analysis for the global burden of disease study global burden. JAMA Oncol [Internet]. 2017 Apr [cited 2019 Jun 12];3(4):524-48. Available from: Available from: https://jamanetwork.com/journals/jamaoncology/fullarticle/2588797 . doi: 10.1001/jamaoncol.2016.5688 [ Links ]
17. Guerra MR, Bustamante-Teixeira MT, Corrêa CSL, Abreu DMX de, Curado MP, Mooney M, et al. Magnitude e variação da carga da mortalidade por câncer no Brasil e Unidades da Federação, 1990 e 2015. Rev Bras Epidemiol [Internet]. 2017 maio [citado 2019 jun 12];20(suppl 1):102-15. Disponível em: Disponível em: http://www.scielo.br/pdf/rbepid/v20s1/1980-5497-rbepid-20-s1-00102.pdf . doi: 10.1590/1980-5497201700050009 [ Links ]
18. Silva GA, Noronha CP, Santos MO, Oliveira JFP. Diferenças de gênero na tendência de mortalidade por câncer de pulmão nas macrorregiões brasileiras Gender. Rev Bras Epidemiol [Internet]. 2008 [citado 2019 jun 12];11(3):411-9. Disponível em: Disponível em: https://www.scielosp.org/pdf/rbepid/2008.v11n3/411-419/pt [ Links ]
19. Silva GA, Gamarra CJ, Girianelli VR, Valente JG. Cancer mortality trends in Brazilian state capitals and other municipalities between 1980 and 2006. Rev Saúde Pública [Internet]. 2011 out [citado 2019 jun 12];45(6):1009-18. Disponível em: Disponível em: http://www.scielo.br/pdf/rsp/v45n6/2963.pdf . doi: 10.1590/S0034-89102011005000076 [ Links ]
20. Malta DC, Stopa SR, Santos MAS, Andrade SSCA, et al. Evolução de indicadores do tabagismo segundo inquéritos de telefone, 2006-2014. Cad Saúde Pública [Internet]. 2017 [citado 2019 jun 12];33(Supl 3):e00134915. Disponível em: Disponível em: http://www.scielo.br/pdf/csp/v33s3/1678-4464-csp-33-s3-e00134915.pdf . doi: 10.1590/0102-311x00134915 [ Links ]
21. Silva GA, Bustamante-Teixeira MT, Aquino EML, Tomazelli JG, Santos-Silva I. Acesso à detecção precoce do câncer de mama no Sistema Único de Saúde: uma análise a partir dos dados do Sistema de Informações em Saúde. Cad Saúde Pública [Internet]. 2014 jul [citado 2019 jun 12];30(7):1537-50. Disponível em: Disponível em: http://www.scielo.br/pdf/csp/v30n7/0102-311X-csp-30-7-1537.pdf . doi: 10.1590/0102-311X00156513 [ Links ]
22. Cao M, Chen W. Epidemiology of lung cancer in China. Thorac Cancer [Internet]. 2019 Jan [cited 2019 Jun 12];1-(1):3-7. Available from: Available from: https://www.ncbi.nlm.nih.gov/pmc/articles/PMC6312841/ . doi: 10.1111/1759-7714.12916 [ Links ]
23. Barrera-Rodriguez R, Morales-Fuentes J. Lung cancer in women. Lung Cancer [Internet]. 2012 Dec [cited 2019 Jun 12];3:79-89. Available from: Available from: https://www.ncbi.nlm.nih.gov/pmc/articles/PMC5312492/ . doi: 10.2147/LCTT.S37319 [ Links ]
24. Silva GA. Câncer de pulmão e as tendências atuais do tabagismo no Brasil. Cad Saúde Pública [Internet]. 2012 set [citado 2019 jun 12];28(9):1620-1. Disponível em: Disponível em: http://www.scielo.br/pdf/csp/v28n9/v28n9a01.pdf [ Links ]
25. Spitz MR, Wei Q, Dong Q, Amos CI, Wu X. Genetic susceptibility to lung cancer: the role of DNA damage and repair. Cancer Epidemiol Biomarkers Prev [Internet]. 2003 Jul [cited 2019 Jun 12];12(8):689-98. Available from: Available from: http://cebp.aacrjournals.org/content/12/8/689.long [ Links ]
26. Levy D, Almeida LM, Szklo A. The Brazil simsmoke policy simulation model: the effect of strong tobacco control policies on smoking prevalence and smoking-attributable deaths in a middle income nation. PLoS Med [Internet]. 2012 Nov [cited 2019 Jun 12];9(11):e1001336. Available from: Available from: https://journals.plos.org/plosmedicine/article?id=10.1371/journal.pmed.1001336 . doi: 10.1371/journal.pmed.1001336 [ Links ]
27. Malta DC, Silva MMA, Albuquerque GM, Lima CM, Cavalcante T, Jaime PC, et al. A implementação das prioridades da Política Nacional de Promoção da Saúde, um balanço, 2006 a 2014. Ciên Saúde Coletiva [Internet]. 2014 nov [citado 2019 jun 12];19(11):4301-12. Disponível em: Disponível em: http://www.scielo.br/pdf/csc/v19n11/1413-8123-csc-19-11-4301.pdf . doi: 10.1590/1413-812320141911.07732014 [ Links ]
28. Instituto Nacional de Câncer José Alencar Gomes da Silva. Observatório da política nacional de controle do tabaco. Comissão Nacional para o Controle do Uso do Tabaco. Prevalência de tabagismo [Internet]. Rio de Janeiro: Instituto Nacional de Câncer José Alencar Gomes da Silva; 2017 [citado 2019 jun 12]. Disponível em: Disponível em: http://www2.inca.gov.br/wps/wcm/connect/observatorio_controle_tabaco/site/home [ Links ]
29. Oudkerk M, Devaraj A, Vliegenthart R, Henzler T, Prosch H, Heussel CP, et al. European position statement on lung cancer screening. Lancet Oncol [Internet]. 2017 Dec [cited 2019 Jun 12];18(12):e754-66. Available from: Available from: https://www.thelancet.com/journals/lanonc/article/PIIS1470-2045(17)30861-6/fulltext . doi: 10.1016/S1470-2045(17)30861-6 [ Links ]
30. Moyer VA. Screening for lung cancer: U.S. preventive services task force recommendation statement. Ann Intern Med [Internet]. 2014 Mar [cited 2019 Jun 12];160(5):330-8. Available from: Available from: https://annals.org/aim/fullarticle/1809422/screening-lung-cancer-u-s-preventive-services-task-force-recommendation . doi: 10.7326/M13-2771 [ Links ]
*This manuscript was based on the doctoral thesis written by Gustavo dos Santos Souza and entitled ‘Lung cancer mortality and atmospheric pollution in Brazilian metropolitan areas’, defended at the Institute of Social Medicine, Rio de Janeiro State University (IMS/UERJ) and approved on June 18th 2018.
Received: November 08, 2018; Accepted: May 06, 2019
 Este é um artigo publicado em acesso aberto sob uma licença Creative Commons
