


Servicios Personalizados
Revista

Articulo
 texto en
  Inglés (pdf)
 Articulo en XML
 Referencias del artículo
 Curriculum ScienTI
 Enviar articulo por email
Indicadores
-
 Citado por SciELO
Links relacionados
-
 Similares en
SciELO
Similares en
SciELO
Compartir

 Permalink
Epidemiologia e Serviços de Saúde
versión impresa ISSN 1679-4974versión On-line ISSN 2237-9622
Epidemiol. Serv. Saúde vol.28 no.3 Brasília set. 2019 Epub 16-Ene-2020
http://dx.doi.org/10.5123/s1679-49742019000300016
ORIGINAL ARTICLE
Vaccine dose usage and wastage in the Metropolitan Region of Porto Alegre, Rio Grande do Sul, Brazil: a descriptive study, 2015-2017*
1Universidade Federal do Rio Grande do Sul, Programa de Pós-Graduação em Saúde Coletiva, Porto Alegre, RS, Brazil
2Universidade Federal do Rio Grande do Sul, Faculdade de Medicina, Porto Alegre, RS, Brazil
3Pontifícia Universidade Católica do Rio Grande do Sul, Escola de Medicina, Porto Alegre, RS, Brazil
4Universidade Federal do Rio Grande do Sul, Escola de Enfermagem, Porto Alegre, RS, Brazi
5Universidade do Vale do Rio do Sinos, Mestrado Profissional em Enfermagem, Porto Alegre, RS, Brazil
6Secretaria de Estado da Saúde, Departamento de Gestão da Tecnologia da Informação, Porto Alegre, RS, Brazil
Objective:
to estimate usage and wastage of multi-dose and single-dose vaccine vials in the Metropolitan Region of Porto Alegre, Rio Grande do Sul, Brazil, from 2015 to 2017.
Methods:
a descriptive study was carried out based on secondary data from the National Immunization Program Information System (SIPNI) and the Strategic Health Supplies Information System (SIES).
Results:
a total of 12,342 records were examined; mean wastage rate was 45.8% (95%CI 39.5;51.7), while usage rate was 54.2% (95%CI 48.3;60.5); vaccines with the highest mean annual wastage rate were MMR (68.8% - 95%CI 66.5;71.1), BCG (68.1% - 95%CI 65.4;70.7), Hepatitis B (56.4% - 95%CI 53.0-59.7) and Yellow Fever (55.9% - 95%CI 51.4;60.4).
Conclusion:
the highest rates of vaccine wastage were for multi-dose vials; although single-dose vaccines also exceeded the acceptable limit defined by the World Health Organization.
Keywords: Vaccines; Health Management; Health Economics; Immunization; Health Evaluation
Introduction
In Brazil the National Immunization Program (PNI) organizes the national policy on vaccination of the Brazilian population. Its main mission can be summarized as controlling and eradicating vaccine-preventable diseases. On the federal level, PNI is the responsibility of the Health Ministry’s Health Surveillance Secretariat (SVS) and it works alongside the state and municipal level health departments.1
The progress achieved by the program has brought undeniable benefits, despite still having to live with problems such as vaccine wastage, whether this be technical and/or physical wastage.2 Some degree of wastage is inevitable,3 and some of it is acceptable and justified.2 The World Health Organization (WHO) estimates that globally vaccine wastage is around 50%,4 while recommending minimum rates of 25% and 5% for multi-dose and single-dose vaccines, respectively.5
WHO defines vaccine wastage as loss by use, decay, erosion, leakage or through wastefulness.6 Physical loss is understood to be loss of unopened vials, while technical losses are doses from opened vials that have not been administered.7 Opened vial losses can be due to: (i) doses discarded at the end of the vaccination session; (ii) vaccine label not identifying the number of doses; (iii) poor vaccine reconstitution practices; (iv) open vials submerged in melted ice water; (v) suspected contamination; and (vi) inadequate vaccine administration practices. Unopened vial wastage can occur because of: (i) vaccine exposed to heat; (ii) vaccine exposed to freezing; (iii) missing inventory; (iv) breakage; (e) theft; and (v) expiry.7-9
Monitoring vaccine wastage is important for adequate immunization program management,1 with the aim of reducing wastage and optimizing planning of immunobiological product purchasing and distribution.
Several countries do not monitor vaccine wastage. According to a study conducted in 2010, of the 72 eligible countries under the Global Alliance for Vaccines and Immunizations (GAVI), only 19 had information about wastage rates.10
In Brazil wastage monitoring is possible at the municipal level by means of the Immunologics Usage and Wastage Control Module (AIU) of the National Immunization Program Information System (SI-PNI), which contains information on technical losses, physical losses and losses due to other reasons.1
The objective of this study was to estimate vaccine usage and wastage in the Metropolitan Region of Porto Alegre, capital of Rio Grande do Sul state, Brazil, between 2015 and 2017.
Methods
This is a descriptive study based on secondary data for the three-year period 2015-2017. It took into consideration 34 municipalities in the Metropolitan Region of Porto Alegre (RMPA), the most densely populated area of Rio Grande do Sul where four million inhabitants are concentrated, accounting for 37.7% of the state’s total population.12
Brazil has an immunization program capable of providing a large number of vaccines free of charge and in a universal manner to the population. These vaccines differ in terms of their composition, administration route, vial presentation/number of doses, as well as having different usage times after the vial has been opened (Figure 1). In view of the need to identify vaccines, vial presentation/number of doses, doses issued, administrated and wasted, we had to collect information from two different databases via official Ministry of Health information systems. The substratum of our study was comprised of stock management reports produced by the Strategic Health Supplies Information System (SIES) as well as SI-PNI data.
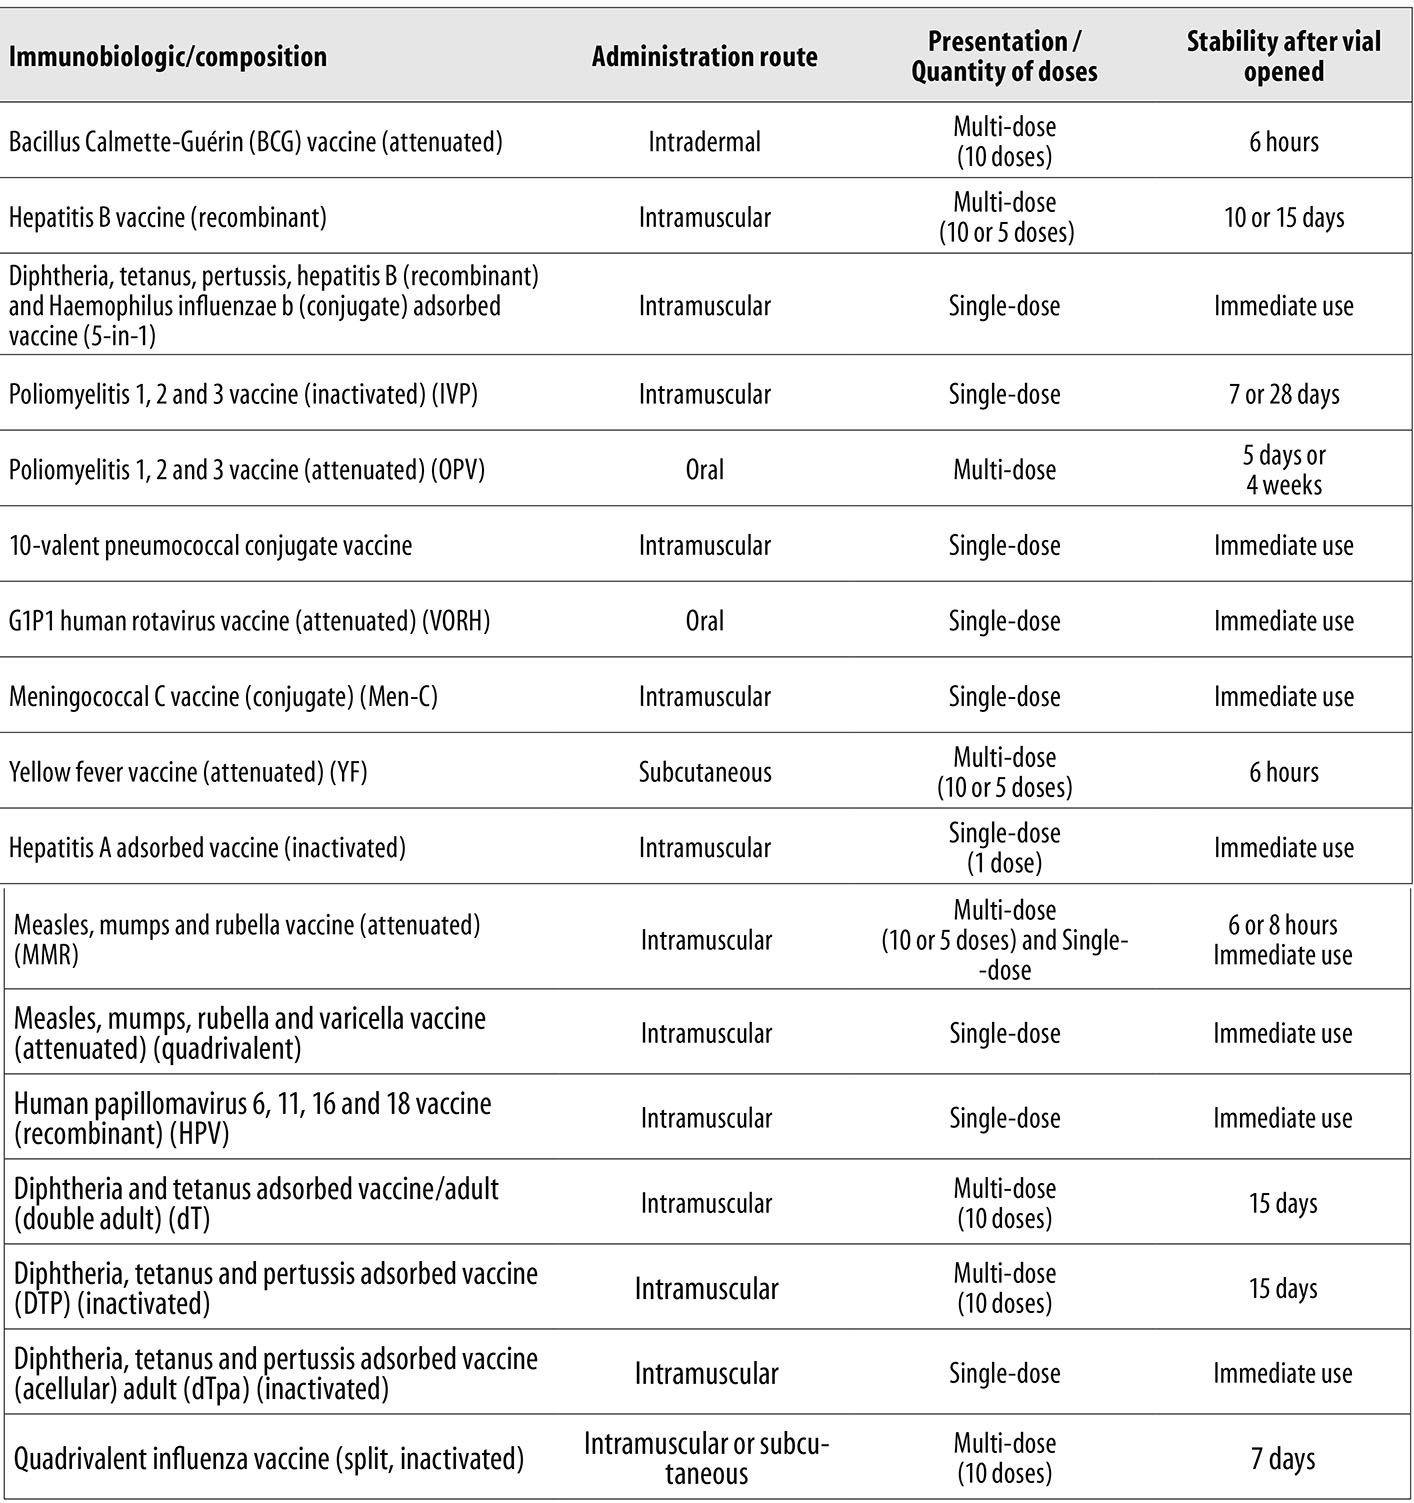
Source: Ministry of Health, Health Surveillance Secretariat, Vaccination Norms and Procedures Manual, 2014.
Note: Single-dose corresponds to one dose.
Figure 1 - Vaccination schedule immunobiologic description (composition, administration route presentation/quantity of doses, stability after vial opened), Brazil, 2017
SI-PNI monitors vaccination coverage records, aggregating them by given age groups, periods and geographical areas. It is a nominal data information system whereby data input is both individual and by origin. This enables monitoring of people who have been vaccinated anywhere in Brazil and also enables people who need to be vaccinated to be located by means of their records on the system.1,13 SIES, in turn, is a logistics system for the three levels of government (federal, state and municipal), focusing on stock control and production of management reports.
Data collection for this study took place in 2018 using a Microsoft Excel® spreadsheet containing information from both systems (SIES and SI-PNI). This spreadsheet database was comprised of different tabs, each one of which corresponded to one of the eleven specific immunobiologics: (i) Bacillus Calmette-Guérin (BCG) vaccine; (ii) hepatitis B vaccine (recombinant); (iii) yellow fever vaccine (attenuated); (iv) diphtheria and tetanus adsorbed vaccine/adult (dT); (v) diphtheria, tetanus and pertussis adsorbed vaccine (DTP); (vi) quadrivalent influenza vaccine (split, inactivated); (vii) diphtheria, tetanus, pertussis, hepatitis B (recombinant) and Haemophilus influenzae B (conjugate) adsorbed vaccine; (viii) hepatitis A adsorbed vaccine (inactivated); (ix) measles, mumps, rubella and varicella vaccine (attenuated); (x) diphtheria, tetanus and pertussis adsorbed vaccine (acellular)/adult (dTpa); and (xi) measles, mumps and rubella vaccine (attenuated).
Some vaccines, with which health professionals and the general population are familiar, have common names, as is the case of the diphtheria, tetanus, pertussis, hepatitis B and Haemophilus influenzae B adsorbed vaccine, commonly called the 5-in-1 vaccine, the measles, mumps, rubella and varicella vaccine, also known as quadrivalent vaccine, and the measles, mumps and rubella, referred to as MMR vaccine.
Each tab of the spreadsheet, corresponding to a specific immunobiologic, included the following variables: (i) municipality; (ii) reference year; (iii) doses at the beginning of the selected period; (iv) vaccine dose values at the beginning of the period; (v) doses received during the period; (vi) value of doses received during the period; (vii) doses issued during the period; (viii) value of doses issued during the period; (ix) dose stock at the end of the period; (x) dose stock value at the end of the period; and (xi) doses administered during the period.
Statistical treatment of the data was done using Microsoft Excel® and the Statistical Package for the Social Sciences (SPSS®). With regard to statistical procedures, only 95% confidence intervals were used (95%CI). The formulae used to calculate usage and wastage rates were based on WHO guidelines:5
Usage rate (UR)
where
A: number of doses administered
B: number of usable doses at the beginning of the period
C: number of usable doses received during the period
D: number of usable doses in stock at the end of the period
Wastage rate (WR)
where
A: number of usable doses at the beginning of the period
B: number of usable doses received during the period
C: number of usable doses in stock at the end of the period
D: number of doses administered
The usage and wastage rates were calculated according to vial presentation, in addition to comparison between total doses administered and estimated and acceptable losses as per the WHO parameters.5 For the analysis, we consolidated 12,342 records in one main file (11 variables x 34 municipalities x 3 years x 11 types of vaccine). We calculated the vaccine dose usage and wastage rate for single-dose vials (hepatitis A, 5-in1 and quadrivalent), multi-dose vials (BCG, dT, DTP, yellow fever and hepatitis B) and vials with both presentations (MMR). Of the total records, 2,244 (18.2%) relating to influenza vaccine and dTpa vaccine were excluded from the analysis because more than 25% of the data contained inconsistent information.
With regard to ethical aspects, the study was based on stock control management reports generated using secondary data, with no use of information enabling individuals to be identified on either system (SIES and SI-PNI). The majority of the crude data were public domain data provided by the Brazilian National Health System Information Technology Department (DATASUS) in electronic format; access to the remaining data needed for the study was obtained by requesting specific reports from Health Surveillance management staff at the Rio Grande do Sul Health Department. This study complies with National Health Council (CNS) Resolutions No. 466/2012 and No. 510/2016.
Results
Tables 1, 2 and 3 show the usage and wastage rates for each vaccine, according to the quantity of doses (single-dose and/or multi-dose).
Table 1 - Single-dose vaccine vial usage and wastage rate in the Metropolitan Region of Porto Alegre, Rio Grande do Sul, 2015-2017
| Vaccine | 2015 | 2016 | 2017 | Mean rate (95%CI a) |
|---|---|---|---|---|
| Hepatitis A | ||||
| Usage rate | 67.9 | 75.0 | 77.6 | 73.5 (72.4;74.6) |
| Wastage rate | 32.1 | 25.0 | 22.4 | 26.5 (25.4;27.6) |
| 5-in-1 | ||||
| Usage rate | 59.9 | 75.8 | 87.4 | 74.4 (71.3;77.5) |
| Wastage rate | 40.1 | 24.2 | 12.6 | 25.6 (22.5;28.7) |
| Quadrivalent | ||||
| Usage rate | 52.4 | 80.0 | 75.9 | 69.4 (66.3;72.6) |
| Wastage rate | 47.6 | 20.0 | 24.1 | 30.6 (27.4;33.7) |
a) 95%CI: 95% confidence interval.
Table 2 - Multi-dose vaccine vial usage and wastage rate in the Metropolitan Region of Porto Alegre, Rio Grande do Sul, 2015-2017
| Vaccine | 2015 | 2016 | 2017 | Mean rate (95%CIa) |
|---|---|---|---|---|
| Bacillus Calmette-Guérin (BCG) vaccine | ||||
| Usage rate | 19.1 | 30.8 | 45.9 | 31.9 (29.3;34.6) |
| Wastage rate | 80.1 | 69.2 | 54.1 | 68.1 (65.4;70.7) |
| Diphtheria and tetanus adult adsorbed vaccine (dT) | ||||
| Usage rate | 52.7 | 62.9 | 71.2 | 62.2 (60.3;64.2) |
| Wastage rate | 47.3 | 37.1 | 28.8 | 37.8 (35.8;39.7) |
| Diphtheria, tetanus and pertussis adsorbed vaccine (DTP) | ||||
| Usage rate | 53.8 | 77.8 | 64.9 | 62.1 (58.6;65.6) |
| Wastage rate | 46.2 | 22.2 | 35.1 | 37.9 (34.4;41.4) |
| Yellow fever | ||||
| Usage rate | 23.2 | 41.1 | 68.0 | 44.1 (39.6;48.6) |
| Wastage rate | 76.8 | 58.9 | 32.0 | 55.9 (51.4;60.4) |
| Hepatitis B | ||||
| Usage rate | 31.7 | 36.3 | 63.0 | 43.6 (40.3;47.0) |
| Wastage rate | 68.3 | 63.7 | 37.0 | 56.4 (53.0;59.7) |
a) 95%CI: 95% confidence interval.
Table 3 - Multi-dose and single-dose vaccine vial usage and wastage rate in the Metropolitan Region of Porto Alegre, Rio Grande do Sul, 2015-2017
| Vaccine | 2015 | 2016 | 2017 | Mean rate (95%CI a) |
|---|---|---|---|---|
| MMR | ||||
| Usage rate | 18.9 | 33.3 | 41.4 | 31.2 (28.9;33.5) |
| Wastage rate | 81.1 | 66.7 | 58.6 | 68.8 (66.5;71.1) |
a) 95%CI: 95% Confidence interval.
Between 2015 and 2016, there was a reduction in the dose wastage rate for all vaccines. The same phenomenon occurred between 2016 and 2017, except for quadrivalent and DTP vaccines.
In 2015, MMR vaccine had the highest dose wastage (81.1%), followed by BCG (80.1%). On the other hand, the vaccines with the lowest wastage rates were hepatitis A (32.1%) and 5-in-1 (40.1%).
In 2016, despite the reduction in the wastage rates, MMR (66.7%) and BCG (69.2%) continued to have the highest wastage rates, while the quadrivalent (20.0%) and DTP (22.2%) vaccines had the lowest wastage that year.
In 2017, there was an even greater reduction in the wastage rates of MMR (58.6%) and BCG (54.1%), although they continued to be the vaccines with the highest wastage. The 5-in-1 (12.6%) and hepatitis A (22.4%) vaccines had the lowest wastage rates that year.
Yellow fever vaccine had the greatest wastage rate variation in the period under consideration: from 76.8% (2015) to 32.0% (2017), while hepatitis A vaccine had the lowest wastage rate variation: from 32.1% (2015) to 22.4% (2017).
In the three year period selected, the mean wastage rate for the nine vaccines in RMPA was 45.8% (95%CI 39.5;51.7), while the mean usage rate was 54.2% (95%CI 48.3;60.5).
With regard to the mean wastage rate per immunobiological product, the vaccines with the highest rates were MMR (68.8% - 95%CI 66.5;71.1), BCG (68.1% - 95%CI 65.4;70.7), hepatitis B (56.4% - 95%CI 53.0;59.7) and yellow fever vaccine (55.9% - 95%CI 51.4;60.4), all of which had multi-dose presentation. The single-dose hepatitis A vaccine (26.5% - 95%CI 25.4;27.6), 5-in1 vaccine (25.6% - 95%CI 22.5;28.7) and quadrivalent vaccine (30.6% - 95%CI 27.4;33.7) had the lowest wastage rates.
Wastage of each vaccine was assessed in the light of the acceptable limit defined by WHO (Table 4). The number of wasted doses (2,247,631) was greater than the number of administered doses (2,141,809). Total acceptable wastage for the three-year study period, according to WHO parameters, would be just 410,610 doses.
Table 4 - Vaccine dose wastage versus acceptable loss, according to parameters defined by the World Health Organization, in the Metropolitan Region of Porto Alegre, Rio Grande do Sul, 2015-2017
| Vaccine | Administered doses | Wasted doses | ||
|---|---|---|---|---|
| Estimated No. | Acceptable No. (WHO a) | |||
| Bacillus Calmette-Guérin (BCG) Vaccine | 159,736 | 417,614 | 39,934 | |
| Diphtheria and tetanus adult adsorbed vaccine (dT) | 406,621 | 247,769 | 101,655 | |
| Diphtheria, tetanus and pertussis adsorbed vaccine (DTP) | 218,614 | 169,336 | 54,653 | |
| Yellow fever | 330,986 | 539,785 | 82,746 | |
| Hepatitis B | 401,654 | 616,116 | 100,413 | |
| Total Multi-dose | 1,517,611 | 1,990,620 (56.7%) | 379,401 (25%) | |
| Hepatitis A | 126,727 | 47,882 | 6,336 | |
| 5-in-1 | 389,843 | 156,377 | 19,492 | |
| Quadrivalent | 107,628 | 52,752 | 5,381 | |
| Total Single-dose | 624,198 | 257,011 (29.1%) | 31,209 (5%) | |
| TOTAL | 2,141,809 (48.8%) | 2,247,631(51.2%) | 410,610 | |
a) 95%CI: 95% Confidence interval.
With regard to dose wastage, the vaccine with the greatest wastage was hepatitis B (616,116 doses), followed by BCG (417,614 doses), both of which are contained in multi-dose vials. The high number of wasted 5-in1 vaccine doses (156,377) stands out in the single-dose presentation category.
Wasted multi-dose vaccines accounted for 56.7% (1,990,620), whereas the acceptable limit is up to 25% (379,401); wasted single-dose vaccines accounted for 29.1% (257,011 doses), whereas the recommended limit is just 5% (31,209 doses).
Discussion
Despite the reduction in wasted doses of the majority of the vaccines, all mean annual wastage rates exceeded the WHO recommended limit.4 When taking the GAVI guidelines, wastage data is even more alarming, since they recommend that wastage rates should be gradually reduced until 15% is achieved for multi-dose vials.4
Usually, when vials are opened vaccines should be administered in a matter of hours. However, in the long term low demand or failure to manage needs result in high vaccine wastage rates.14,15
Studies conducted in India, although more frequent, show large wastage rate variance in the periods 2015-2016,3 2004,8 1996,16 2012-2013,17 201218 and 2009-2010.19 In relation to Brazil, the few studies we found showed higher wastage rates between 2007 and 2010,2 in 200820 and in 2013,21 when compared to international studies.
Vaccine wastage is inevitable and some wastage is acceptable and justified. However, some wastage is questionable, such as that found in this study for hepatitis B vaccine. This vaccine expires within 15 to 28 days (depending on the manufacturer), and its wastage rate was greater than 50.0%, being close to the result of another Brazilian study.2 However, it was much higher than that found by a North American study (1.1%),9 as well as the conclusive rates of studies conducted in India: 5.3%, 21.0% and 10.5%, relating to the periods 2012-2013,17 2012,18 and 2015-2016,3 respectively. It is noteworthy than in all these studies the vaccine was supplied in multi-dose vials (ten doses).
In our study MMR vaccine had the highest wastage, 68.8%, this being close to the 64.1% wastage rate found by a study conducted in four Brazilian states (Amazonas, Rio Grande do Norte, Mato Grosso do Sul and Santa Catarina) for the year 2008, when around three doses were wasted for every one dose administered.20 Another study conducted in 2013 in the Southeast region of Brazil found an even higher rate: 74.27%.21 These results diverge from results of other international studies conducted in 2012-201317 and 1994-1999:9 with low wastage of this vaccine of 1.4% for single-dose vials17 and 1.3%9 (the latter does not detail the number of doses per vial).
In India, MMR had the lowest vaccine wastage rate and was used in five-dose vials in 2008.20 The difference may be due to vial presentation which, in Brazil, varied between one, five and ten doses, thus requiring complementary analysis with the aim of identifying which vial format accounted for most wastage.
The BCG wastage rate we found (68.1%) was similar to that found in some international studies, namely 70.9%, 66.8% and 64.6% for the periods 2009-2010,19 2016-201722 and 2013-2017,16 respectively. Other studies have found lower rates: 45%18 and 20.7%.3 On the other hand, a study conducted in Asia8 found a higher BCG wastage rate (84.0-85.0%) than that found in RMPA. Furthermore, other Brazilian studies also found higher rates (e.g. 75.1%20), in particular one study found 93.3% wastage in vaccination rooms in the city of Juiz de Fora in Southeast Brazil.21 Vial presentation in all these studies was multi-dose (ten doses), and BCG vaccine had the highest wastage rate among all immunobiological products studied. The exception was our study, in which BCG came in second place in terms of wastage.
We found 37.9% wastage for DTP vaccine, this being one of the lowest rates for multi-dose presentation vials (ten doses). Even so, this rate is high when compared to rates found by other studies for the periods 2012, 2016-2017 and 2015-2016, namely 16.0%,18 24.9%22 and 15.6%3 respectively; although another study conducted in Brazil found an even higher rate: 60.0%.2 On the other hand, we found a 37.8% wastage rate for dT vaccine (ten-dose vial), which was below the rate found by other studies that analyzed this immunobiological product.2,19
With regard to single-dose presentation vaccines, despite the rates being lower than those for multi-dose vials, nevertheless they are above the parameters considered acceptable by WHO. An example is the wastage rate for the 5-in-1 vaccine (25.6%), which is relatively high in comparison to rates found by other studies: 0% (2012-2013)17 and 5.2% (2015-2016)3 for ten-dose vials. A rate of 33.1% was found in a rural setting in central India,22 which is close to the rate we found; however, the rate found in India relates to a 20-dose vial. In our study, 5-in-1 vaccine wastage cannot be attributed to multi-dose presentation, since it is a single-dose vaccination, wastage of which was nothing less than 136,885 doses in excess of the acceptable limit.
We found high single-dose vaccination wastage rates, for example, for hepatitis A vaccine (26.5%) and quadrivalent vaccine (30.6%), although comparative data in the literature is scarce. This situation may indicate that studies are focusing on multi-dose presentation wastage. However, our results also revealed considerable wastage rates for single-dose vaccines.
Exceeding limits acceptable to WHO is a reality found in a further two studies, one of which was conducted in Brazil21 and the other in India.19 On the other hand, two other studies conducted in India2,22 found all vaccine wastage rates to be in compliance with WHO recommendations.
Knowledge of wastage rates is essential for situation evaluation and for directing efforts. When this information is missing, a country can face vaccination shortages or may not be able to consume those it has received.17,18
In Brazilian National Health System (SUS) services, vaccine supply is based on the calculation of the technical fall-back percentage, which is intended to prevent immunological product wastage. Fall-back is 20.% for vaccines supplied in ten-dose vials, 10% for five-dose vials and zero for single-dose vials.20 In the context of our study, in which wastage was higher than the technical fall-back percentages, it can be questioned whether vaccine supply within SUS was insufficient (whether there was a shortage of vaccines), or whether vaccination coverage was lower than expected.
Although knowledge about vaccine wastage is fundamental, the literature demonstrates that this information falls short of the level of analysis needed. Despite WHO guidelines, vaccine wastage monitoring and control are insufficient.5,10
Brazil has moved forward with enhancing its Health Information Systems and SI-PNI is evidence of this.23 However, there are still limitations, as identified by this study. The national (public access) SI-PNI database does not enable direct analysis of vaccine wastage, so that information has to be cross-tabulated with another database, i.e. SIES (which has relatively restricted access). There are weaknesses in this cross-tabulation. An example of this is MMR vaccine which is supplied with both single- and multi-dose presentation, so that it was impossible for us to identify whether wastage was higher for single-, five- or ten-dose vials.
Another weakness found when cross-tabulating information from the two systems was inconsistency of data on some immunobiological products which, when it was above 25%, obliged us to exclude this data from the study. We therefore suggest that SIES data be enhanced by adding the following information: ‘dose taken from a single-dose vial’ and/or, in the case of multi-dose vials, the ‘amount of doses in each vial’. We also suggest that vaccination wastage records held on SI-PNI be made more widely available - currently they are restricted to the municipal level -, in order to enable analyses by the other management levels.
The scarcity of data in the literature may be one of the reasons why monitoring of this information is low. At the federal and state levels, there are no studies of vaccine loss/wastage, with the exception of some one-off initiatives. Progress needs to be made in enhancing the information systems and making data available about vaccine wastage. We therefore recommend that the SI-PNI be strengthened and that within health services greater value and effort be placed on monitoring vaccine wastage.
This study quantified vaccine wastage in the Metropolitan Region of Porto Alegre. Its conclusions can help with rethinking immunization policies and practices, as well as channeling efforts to optimize health resources, reduce unnecessary expenditure and promote greater efficiency in the use of public resources.7,8,11 While it is evident that SUS is a protagonist with regard to immunization of the population, our analysis shows that the cost may be onerous for the public health system and an issue that needs to be analyzed is that this cost could be minimized.
REFERENCES
1. Ministério da Saúde (BR). Secretaria de Vigilância em Saúde. Departamento de Vigilância das Doenças Transmissíveis. Manual de normas e procedimentos para vacinação [Internet]. Brasília: Ministério da Saúde; 2014 [citado 2018 out 12].176 p. Disponível em: Disponível em: http://bvsms.saude.gov.br/bvs/publicacoes/manual_procedimentos_vacinacao.pdf [ Links ]
2. Pereira DDS, Neves EB, Gemelli M, Ulbricht L. Análise da taxa de utilização e perda de vacinas no programa nacional de imunização. Cad Saúde Colet [Internet]. 2013 [citado 2019 set 4];21(4):420-24. Disponível em: Disponível em: http://www.scielo.br/pdf/cadsc/v21n4/v21n4a10.pdf . doi: 10.1590/S1414-462X2013000400010 [ Links ]
3. Tiwari R, Shatkratu D, Swami P, Mahore R, Tiwari S. A study to assess vaccine wastage in an immunization clinic of tertiary care center, Gwalior, Madhya Pradesh, India. Int J Res Med Sci [Internet]. 2017 Jun [cited 2019 Sep 4];5(6):2472-76. Available from: Available from: https://www.msjonline.org/index.php/ijrms/article/view/3001/3001 . doi: 10.18203/2320-6012.ijrms20172431 [ Links ]
4. World Health Organization. Immunization, vaccines and biologicals: IVB catalogue 2017 [Internet]. Geneva: World Health Organization; 2017 [cited 2018 Jan 27]. 80 p. Available from: Available from: https://extranet.who.int/ivb_docs/reports/catalogue [ Links ]
5. World Health Organization. Monitoring vaccine wastage at country level: guidelines for programme managers [Internet]. Geneva: World Health Organization; 2005 [cited 2018 Jan 27]. 63 p. Available from: Available from: http://apps.who.int/iris/bitstream/handle/10665/68463/WHO_VB_03.18.Rev.1_eng.pdf?sequence=1&isAllowed=y [ Links ]
6. United Nations Children's Fund (UNICEF). Vaccine wastage assessment: field assessment and observations from national stores and five selected states in India [Internet]. [New Delhi]: United Nations Children's Fund; 2010 [cited 2018 Jan 27]. Available from: Available from: http://www.mofa.go.jp/mofaj/gaiko/oda/seisaku/kanmin/chusho_h24/pdfs/a20-12.pdf [ Links ]
7. Ministério da Saúde (BR). Secretaria de Vigilância em Saúde. Vigilância em saúde: anotações [Internet]. Brasília: Ministério da Saúde; 2014 [citado 2018 fev 26]. 154 p. Disponível em: Disponível em: http://bvsms.saude.gov.br/bvs/publicacoes/secretaria_vigilancia_anotacoes.pdf [ Links ]
8. Guichard S, Hymbaugh K, Burkholder B, Diorditsa S, Navarro C, Ahmed S, et al. Vaccine wastage in Bangladesh. Vaccine [Internet]. 2010 Jan [cited 2019 Sep 4];28(3):858-63.Available from: Available from: https://www.sciencedirect.com/science article/pii/S0264410X09012092?via%3Dihub . doi: 10.1016/j.vaccine.2009.08.035 [ Links ]
9. Setia S, Mainzer H, Washington ML, Coil G, Snyder R, Weniger BG. Frequency and causes of vaccine wastage. Vaccine [Internet]. 2002 Jan [cited 2019 Sep 4];20(7-8):1148-56. Available from: Available from: https://www.sciencedirect.com/science/article/pii/S0264410X01004339?via%3Dihub . doi: 10.1016/S0264-410X(01)00433-9 [ Links ]
10. Parmar D, Baruwa EM, Zuber P, Kone S. Impact of wastage on single and multi-dose vaccine vials: implications for introducing pneumococcal vaccines in developing countries. Human Vaccin [Internet]. 2010 Mar [cited 2019 Sep 4];6(3):270-78. Available from: Available from: https://www.tandfonline.com/doi/abs/10.4161/hv.6.3.10397 . doi: 10.4161/hv.6.3.10397 [ Links ]
11. World Health Organization. Global vaccine action plan 2011-2020 [Internet]. Geneva: World Health Organization; 2013 [cited 2018 Jan 27]. Available from: Available from: https://www.unicef.org/immunization/files/GVAP(1).pdf [ Links ]
12. Secretaria de Planejamento, Governança e Gestão (RS). Atlas socioeconômico Rio Grande do Sul. Região Metropolitana de Porto Alegre - RMPA [Internet]. Porto Alegre: Secretaria de Planejamento, Governança e Gestão; 2018 [citado 2018 fev 26]. Disponível em: Disponível em: http://www.atlassocioeconomico.rs.gov.br/regiao-metropolitana-de-porto-alegre-rmpa [ Links ]
13. Silva BS, Coelho HV, Cavalcante RB, Oliveira VC, Guimarães EAA. Evaluation study of the National Immunization Program Information System. Rev Bras Enferm [Internet]. 2018 [cited 2019 Jan 27];71(1):615-64. Available from: Available from: http://www.scielo.br/pdf/reben/v71s1/0034-7167-reben-71-s1-0615.pdf . doi: 10.1590/0034-7167-2017-0601 [ Links ]
14. Mofrad MH, Maillart LM, Norman BA, Rajgopal J. Dynamically optimizing the administration of vaccines from multi-dosevials. Socio-Econ Plan Sci [internet]. 2014 Mar [cited 2019 set 4];46(7):623-35. Available from: Available from: https://www.tandfonline.com/doi/abs/10.1080/0740817X.2013.849834 [ Links ]
15. Crosewski F, Larocca LM, Chaves MMN. Perdas evitáveis de imunobiológicos na instância local: reflexões acerca do processo de trabalho da enfermagem. Saúde Debate [Internet]. 2018 jan [citado 2019 set 4];42(116):203-13. Disponível em: Disponível em: http://www.scielo.br/pdf/sdeb/v42n116/0103-1104-sdeb-42-116-0203.pdf . doi: 10.1590/0103-1104201811616 [ Links ]
16. Duttagupta C, Bhattachayya D, Narayanan P, Pattanshetty SM. Vaccine wastage at the level of service delivery: a cross-sectional study. Public Health [Internet]. 2017 Jul [cited 2019 Sep 4];48:63-5. Available from: Available from: https://www.sciencedirect.com/science/article/abs/pii/S0033350617300860?via%3Dihub . doi: 10.1016/j.puhe.2017.02.020 [ Links ]
17. Praveena DA, Selvaraj K, Veerakuma AM, Nair D, Ramaswamy G, Chinnakali P. Vaccine wastage assessment in a primary care setting in rural India. Ind J Contemp Pediatri [Internet]. 2015 Feb [cited 2019 Sep 4];2(1):7-11. Available from: Available from: https://www.ejmanager.com/mnstemps/119/119-1416996210.pdf . doi: 10.5455/2349-3291.ijcp20150202 [ Links ]
18. Mehta S, Umregar P, Patel P, Bansal RK. Evaluation of vaccine wastage in Surat. Natl J Community Med [Internet]. 2013 Jan-Mar [cited 2019 Sep 4];4(1):15-19. Available from: Available from: http://www.njcmindia.org/uploads/4-1_15-19.pdf [ Links ]
19. Chinnakali P, Kulkarni V, Kalaiselvi S, Nongkynrih B. Vaccine wastage assessment in a primary care setting in urban India. J Pediatr Sci [Internet]. 2012 [cited 2019 Sep 4];4(1):e119. Available from: Available from: http://www.pediatricsciences.com/article/view/1050000227 [ Links ]
20. Samad SA. Perdas de vacinas: razões e prevalência em quatro unidades federadas do Brasil [dissertação]. São Paulo (SP): Universidade Federal de São Paulo; 2011. Disponível em: http://vml029.epm.br/handle/11600/9923 [ Links ]
21. Dias BF. Relação entre perdas vacinais e variáveis de infraestrutura em salas de vacinação de uma cidade do sudeste brasileiro [dissertação]. Rio de Janeiro (RJ): Universidade Federal do Rio de Janeiro; 2016. Disponível em: http://www.peb.ufrj.br/teses/Tese0247_2016_09_16.pdf [ Links ]
22. Patle L, Adikane H, Dhage D, Surwase K, Gogulwar S. A cross sectional study of vaccine wastage assessment in a primary health care setting in rural central India. Sch J App Med Sci [Internet]. 2017 Aug [cited 2019 Sep 4];5(8F):3411-15. Available from: Available from: https://pdfs.semanticscholar.org/d813/aec0a5b6c304d6e51454f0b970ac05bef2ad.pdf . doi: 10.21276/sjams [ Links ]
23. Moura ADA, Carneiro AKB, Braga AVL, Bastos ECSA, Canto SVE, Figueiredo TWS, et al. Estratégias e resultados da vacinação no enfrentamento da epidemia de sarampo no estado do Ceará, 2013-2015. Epidemiol Serv Saúde [Internet]. 2018 [citado 2019 set 4];27(1):e201634310. Disponível em: Disponível em: http://www.scielo.br/pdf/ress/v27n1/2237-9622-ress-27-01-e201634310.pdf . doi: 10.5123/s1679-49742018000100010 [ Links ]
Received: November 25, 2018; Accepted: August 22, 2019
 Este é um artigo publicado em acesso aberto sob uma licença Creative Commons
