


Servicios Personalizados
Revista

Articulo
 texto en
  Inglés (pdf)
 Articulo en XML
 Referencias del artículo
 Enviar articulo por email
Indicadores
-
 Citado por SciELO
Links relacionados
-
 Similares en
SciELO
Similares en
SciELO
Compartir

 Permalink
Epidemiologia e Serviços de Saúde
versión impresa ISSN 1679-4974versión On-line ISSN 2237-9622
Epidemiol. Serv. Saúde vol.29 no.3 Brasília jun. 2020 Epub 20-Mayo-2020
http://dx.doi.org/10.5123/s1679-49742020000300002
Original article
Factors related to the dissatisfaction of users of specialized dental care centers in Brazil in 2014: a cross-sectional study*
1Fundação Oswaldo Cruz, Instituto René Rachou, Belo Horizonte, MG, Brazil
2Universidade Federal de Minas Gerais, Departamento de Odontologia Social e Preventiva, Belo Horizonte, MG, Brazil
Objective
to evaluate factors related to the dissatisfaction of users of the specialized dental care centers (CEO) in Brazil.
Methods
this was a cross-sectional study with data from the Dental Specialty Center Access and Quality Improvement Program; the study was conducted in 2014 and included a non-probabilistic sample of users; those who answered that the service received was regular, poor or very poor were classified as dissatisfied.
Results
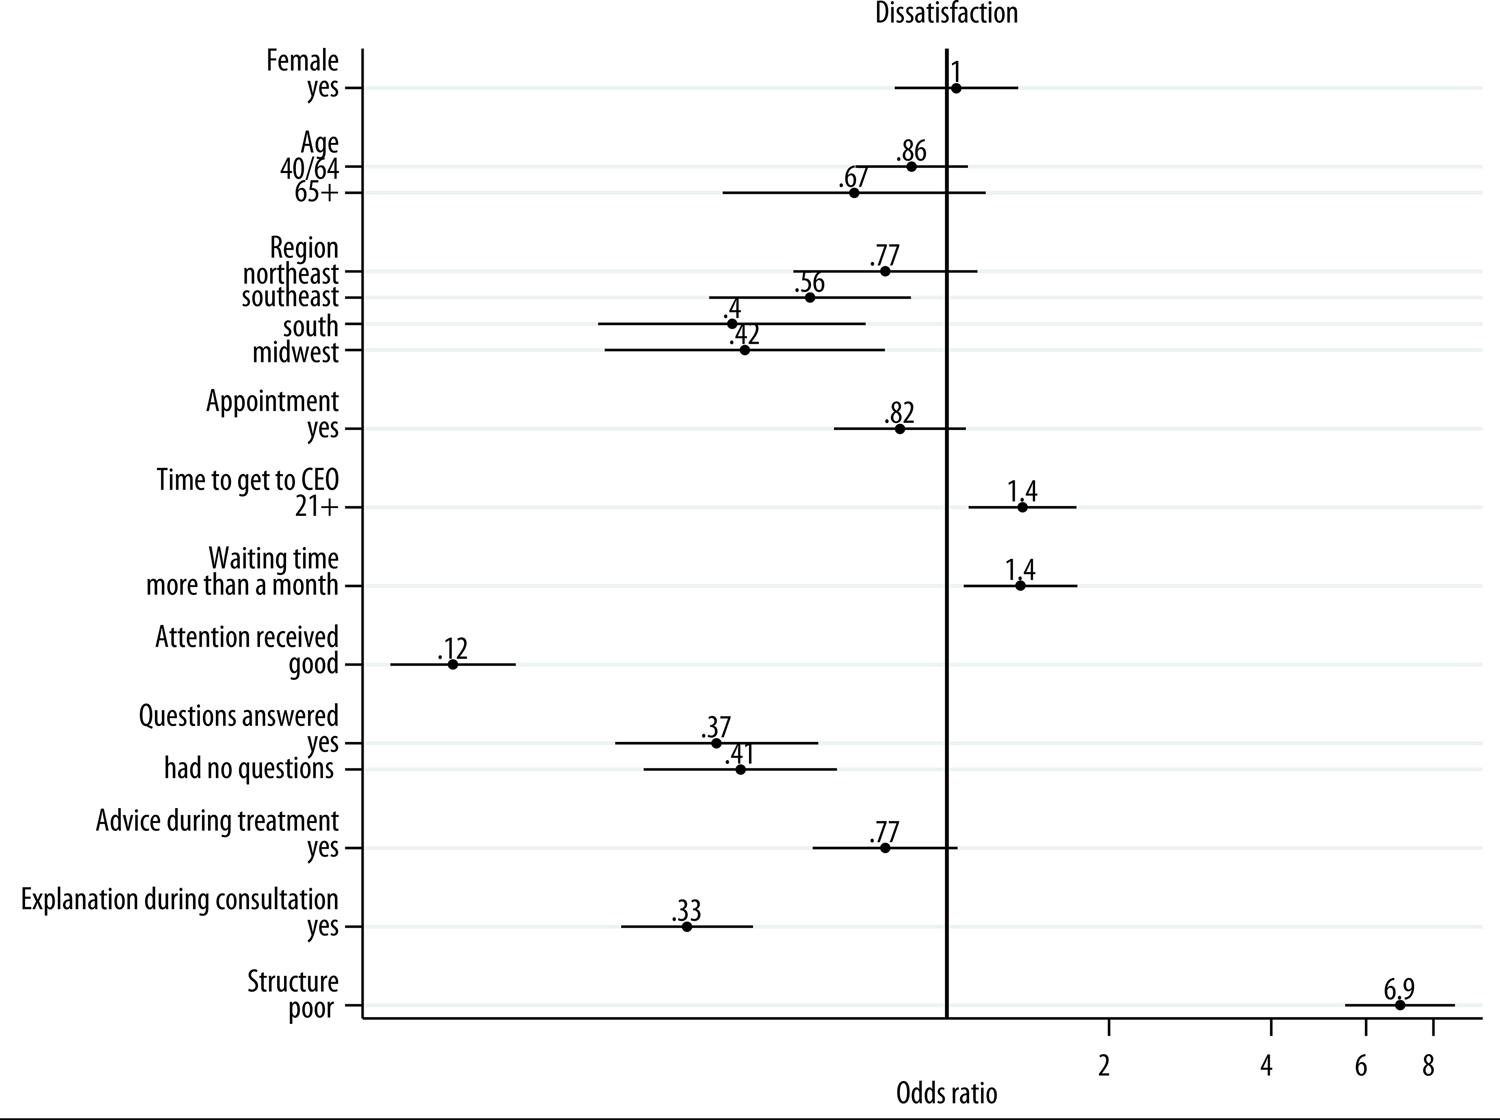
a total of 8,730 users were included, 4.8% reported dissatisfaction; longer time taken to get to the service (OR=1.38 – 95%CI1.10;1.74), and longer waiting time until treatment (OR=1.37 – 95%CI1.07;1.75), were positively associated with dissatisfaction, whereas negative association was found with attention received (OR=0.12 – 95%CI0.09;0.16), the possibility of asking questions about treatment (OR=0.37 – 95%CI0.24;0.58), and receiving advice during treatment (OR=0.33 – 95%CI0.25;0.44).
Conclusion
prevalence of user dissatisfaction was low and was associated with factors related to service organization and receipt of information and support.
Key words: Patient Satisfaction; Oral Health; Secondary Care; Specialties, Dental; Cross-Sectional Studies
Introduction
User satisfaction is an important marker of service quality,1 as it provides information about individual expectations in relation to different factors that form part of the health service evaluation process (e.g. structure and service organization, interpersonal relations between health workers and patients etc.).1 The ‘user satisfaction’ marker is useful for evaluating system and service quality, preparation and management.1 As such, service user dissatisfaction with health care is related to lower adherence to or interruption of treatment, less use of services and, consequently, poorer outcomes.6
Lack of service users’ views in the evaluation process leads to the result being biased by the views of service managers or health workers,4 since technical evaluation is different to evaluation made by service users.13 Blendon et al.13 found negative correlation between subjective evaluation by service users and the quality ranking for health systems estimated by the World Health Organization (WHO). The two countries with the best WHO evaluation were classified in 14th and 15th place in the opinion of their respective users.13 Differences between evaluations made by service users and health workers have also been found in relation to Primary Care dental services.14
Studies have been conducted to evaluate user satisfaction with the quality of health services provided to them, especially in high-income countries. In Brazil these studies began in the 1990s. In particular they were committed to making effective Social Monitoring and Participation, based on the participation of society in evaluating and planning the services provided by the health system.7 These studies are still incipient, even more so when they focus on specialized dental care services. There is no national estimate of Secondary Care service user satisfaction with regard to the specialized dental care centers (CEO). Studies available on this theme have involved CEOs in capital cities9 or states of the Northeast region,10 as well as one state in the Southeast.12 Despite differences in measuring outcomes, which hinders comparability between prevalence rates found, the results coincide with regard to finding high satisfaction among service users interviewed.
A study conducted in 2013 with service users attending CEOs in the state of Minas Gerais,12 found that better self-perception of oral health and less time spent waiting in the dental surgery increases the likelihood of satisfaction with the service provided.
The creation of the National Dental Specialty Center Access and Quality Improvement Program (PMAQ-CEO) in 2014 denotes Public Health recognition of the importance of evaluating the quality of the different stages and levels of this public dental service. PMAQ-CEO was designed to inform the definition of quality parameters and certification, with the aim of improving and expanding oral health care and prevention actions throughout the national territory, including evaluating satisfaction with these actions based on samples of service users.15
The objective of this study was to evaluate factors associated with dissatisfaction of users of Brazil’s specialized dental care centers – CEOs.
Methods
A cross-sectional study was conducted using data from the 2014 Dental Specialty Center Access and Quality Improvement Program – PMAQ-CEO.
The Program evaluated the data on users of services authorized by the Ministry of Health. The final sample was comprised of 930 CEOs, after 54 (5%) registered centers had been excluded, namely, (i) closed centers, (ii) centers being renovated, (iii) those disqualified by the Ministry of Health and (iv) those that refused to take part in the external evaluation stage.16 Data collection was done by duly trained interviewers. Ten users aged 18 or over were interviewed at each service, who were either having treatment or who had finished treatment in the last year.17 A non-probabilistic sampling procedure was used. All individuals having complete information for the variables of interest were included in this study (n=8,730), and 167 (1.9%) were excluded.
Data collection took place at the dental centers, by administering a questionnaire aimed at evaluating user perception of the specialized oral health services, access to them and use of them.
The dependent variable was user satisfaction with the services provided by Brazil’s CEOs. Satisfaction was evaluated by means of the following question on the PMAQ-CEO questionnaire:
In your opinion, generally speaking the service provided to you at this CEO is:
The question had five answer options – very good; good; regular; poor; very poor –, dichotomized into ‘satisfied’ (very good/good) e ‘not satisfied’ (regular/poor/very poor).
The independent variables were classified as follows:
a) sociodemographic characteristics
sex (male; female);
age (in years: 18-39; 40-64; 65 or over);
schooling (incomplete elementary education; incomplete high school education; incomplete higher education; complete higher education); and
Brazilian macro-region (North; Northeast; Southeast; South; Midwest).
b) indicators of dissatisfaction, as per previous studies – service organization14 (time taken to get to the service [up to 20 minutes; 21 minutes or more], waiting time until treatment started [up to one month; more than one month], care provided at a scheduled time (appointment) [no; yes],attention received [good; poor]), information and support14 (explanation about treatment during consultation [yes; no], advice during treatment [yes; no],having questions answered [no; yes]); and service structure14 (assessment of facilities [good; poor]).
The questions for each dissatisfaction indicator are shown in Figure 1.
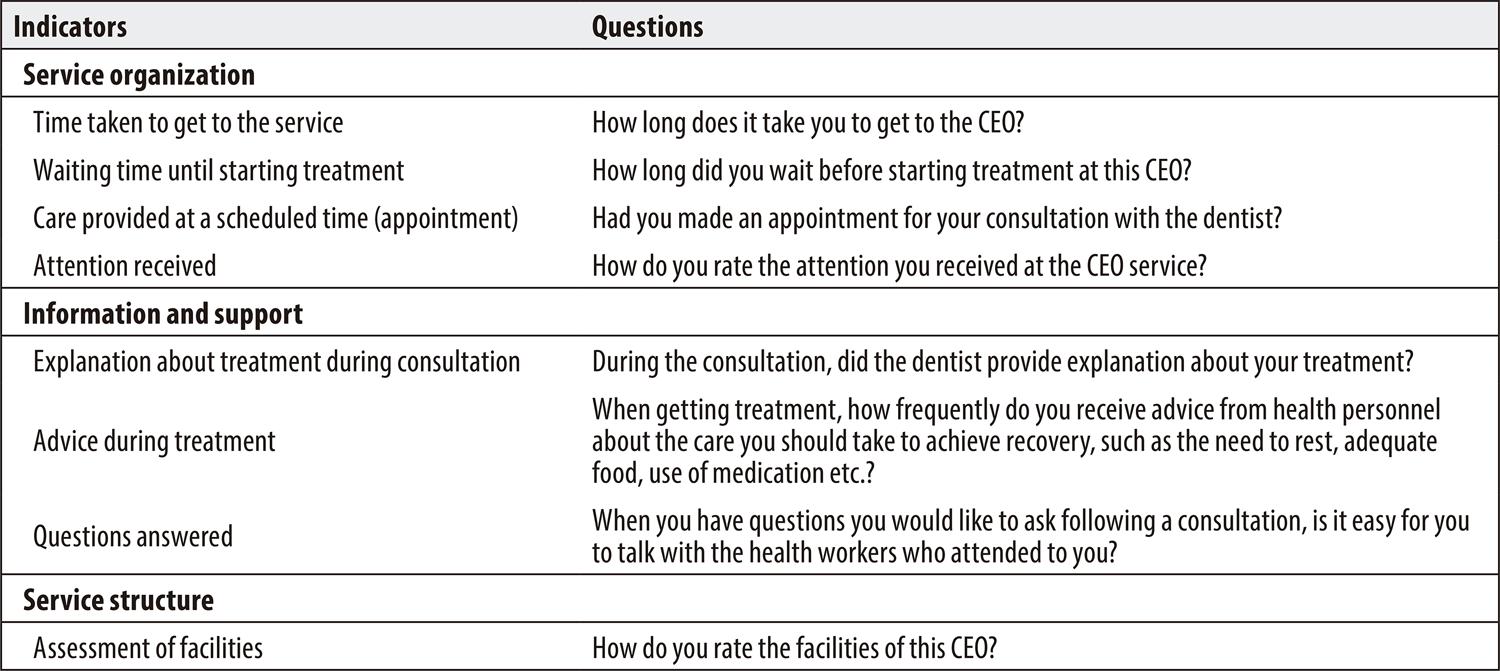
Figure 1 – Questions informing indicators of user dissatisfaction with the service provided at specialized dental care centers, based on Dental Specialty Center Access and Quality Improvement Program (PMAQ-CEO) data, Brazil
Crude analysis and multivariate logistic regression analysis was performed. Variables having a significance level below 0.20 in the crude analysis were included in the multivariate model. The estimates produced by the model were expressed as odds ratios, with respective 95% confidence intervals (95%CI). Study participants who had complete information for all the variables of interest were included in the analysis of the data. All analyses were performed using Stata/SE version 14.0.
PMAQ-CEO data collection was conducted in accordance with the standards required by the Declaration of Helsinki. PMAQ-CEO was approved by the Federal University of Pernambuco Health Sciences Center Research Ethics Council (CEP/CCS/UFPE), under number 740.974; and was granted Certification of Submission for Ethical Appraisal (CAAE) No. 23458213.0.0000.5208, on August 6th 2014. PMAQ-CEO data are public domain data.
Results
A total of 8,730 specialized dental care center users were interviewed. Prevalence of these users’ dissatisfaction with the service was 4.8% (95%CI 4.4;5.3).
Table 1 shows the distribution of the sample according to the independent variables. The majority of respondents were female (69.9%), a large part of the respondents were in the 18-39 year-old age group (48.9%), more than a third had incomplete elementary education (37.5%) and a slightly higher proportion lived in the Northeast region (38.2%). With regard to service organization, it took the majority of respondents up to 20 minutes to get to their CEO (59.3%), most of them waited for up to one month for treatment (70.9%), the majority were seen by the dentist without having an appointment (52.7%) and with regard to the attention they received, most of them felt they were treated well by center personnel (95.1%).
Table 1 – Description of variables for the total sample and for the subgroup of individuals dissatisfied with care provided, among users of specialized dental care centers, based on Dental Specialty Center Access and Quality Improvement Program (PMAQ-CEO) data, Brazil, 2014
| Variables | Total sample % (95%CI)a | Dissatisfied % (95%CI)a |
|---|---|---|
| Sociodemographic | ||
| Sex | ||
| Male | 30.1(29.1;31.0) | 5.2(3.3;4.8) |
| Female | 69.9(69.0;70.9) | 4.0(4.6;5.7) |
| Age (in years) | ||
| 18; 39 | 48.9(47.8;49.9) | 5.9(5.2;6.6) |
| 40; 64 | 42.9(41.9;44.0) | 4.1(3.5;4.8) |
| ≥65 | 8.2(7.7;8.8) | 2.2(1.4;3.6) |
| Schooling | ||
| Incomplete elementary education | 37.5(36.5;38.5) | 4.3(3.6;5.0) |
| Incomplete high school education | 21.1(20.3;22.0) | 5.3(4.4;6.4) |
| Incomplete higher education | 34.8(33.8;35.8) | 5.2(4.5;6.1) |
| Complete higher education or more | 6.6(6.1;7.2) | 3.6(2.4;5.5) |
| Brazilian macro-region | ||
| North | 5.5(5.1;6.0) | 9.3(7.1;12.3) |
| Northeast | 38.2(37.2;39.3) | 6.6(5.8;7.5) |
| Southeast | 37.2(36.2;38.2) | 3.2(2.6;3.8) |
| South | 12.7(12.0;13.4) | 2.4(1.6;3.5) |
| Midwest | 6.3(5.8;6.8) | 4.3(2.9;6.3) |
| Service organization | ||
| Time taken to get to the service | ||
| Up to 20 minutes | 59.3(58.2;60.3) | 4.0(3.5;4.6) |
| 21 minutes or more | 40.7(39.7;41.8) | 5.9(5.1;6.7) |
| Waiting time until starting treatment | ||
| Up to one month | 70.9(69.9;71.8) | 4.0(3.5;4.5) |
| One month or more | 29.1(28.2;30.1) | 6.8(5.9;7.8) |
| Care provided at a scheduled time (appointment) | ||
| No | 52.7(51.7;53.8) | 6.5(5.8;7.2) |
| Yes | 47.3(46.2;48.3) | 2.9(2.5;3.5) |
| Attention received | ||
| Poor | 4.9(4.5;5.4) | 3.8(3.4;4.3) |
| Good | 95.1(94.6;95.5) | 3.1(2.7;3.5) |
| Information and support | ||
| Explanation about treatment during consultation | ||
| No | 11.8(11.2;12.5) | 15.3(13.3;17.6) |
| Yes | 88.2(87.5;88.9) | 3.4(3.0;3.8) |
| Advice during treatment | ||
| No | 10.6(10.0;11.3) | 13.0(11.0;15.3) |
| Yes | 89.4(88.7;90.0) | 3.8(3.4;4.3) |
| Questions answered | ||
| No | 2.5(2.2;2.9) | 28.4(22.9;34.7) |
| Yes | 42.5(41.5;43.6) | 3.4(2.9;4.1) |
| Had no questions | 55.0(53.9;56.0) | 4.7(4.2;5.4) |
| Service structure | ||
| Assessment of facilities | ||
| Good | 81.4(80.5;82.2) | 1.8(1.6;2.2) |
| Poor | 18.6(17.8;19.5) | 17.7(15.9;19.6) |
a) 95%CI: 95% confidence interval.
All the independent variables included in the crude analysis were found to be associated with dissatisfaction with service delivery, except schooling (Table 2). In the multivariate analysis (Table 2; Figure 2), dissatisfaction with services was not associated with sociodemographic characteristics. Likelihood of dissatisfaction was greater among those who reported taking more time to get to the service (OR=1.38 – 95%CI 1.10;1.74), those who waited one month or more for treatment (OR=1.37 – 95%CI 1.07;1.75), and those who evaluated service structure as being poor (OR=6.94 – 95%CI 5.49;8.77). Participants who reported receiving good attention had 88% less likelihood of dissatisfaction (OR=0.12 – 95%CI 0.09;0.16), compared to those who did not feel they had been treated well. Less likelihood of dissatisfaction was also found among individuals who had their questions about treatment answered (OR=0.37 – 95%CI 0.24;0.58) and those who received advice about treatment during appointments (OR=0.33 – 95%CI 0.25;0.44).
Table 2 – Crude and adjusted analysis of factors associated with dissatisfaction with care received by users of specialized dental care centers, based on Dental Specialty Center Access and Quality Improvement Program (PMAQ-CEO) data, Brazil, 2014
| Variables | Crude analysis | Adjusted analysis | ||
|---|---|---|---|---|
| OR (95%CI)a | p-valueb | OR (95%CI)a | p-valueb | |
| Sociodemographic | ||||
| Sex | 0.021 | 0.761 | ||
| Male | 1.00 | 1.00 | ||
| Female | 1.31(1.04;1.64) | 1.04(0.80;1.36) | ||
| Age (in years) | <0.001 | 0.237 | ||
| 18-39 | 1.00 | 1.00 | ||
| 40-64 | 0.69(0.56;0.85) | 0.86(0.68;1.09) | ||
| ≥65 | 0.37(0.22;0.61) | 0.67(0.38;1.18) | ||
| Schooling | 0.138 | |||
| Incomplete elementary | 1.00 | |||
| Incomplete high school | 1.24(0.95;1.61) | - | ||
| Incomplete higher education | 1.22(0.96;1.53) | - | ||
| Complete higher education | 0.83(0.52;1.32) | - | ||
| Brazilian macro-region | <0.001 | 0.002 | ||
| North | 1.00 | 1.00 | ||
| Northeast | 0.67(0.48;0.94) | 0.77(0.52;1.14) | ||
| Southeast | 0.32(0.22;0.46) | 0.56(0.36;0.86) | ||
| South | 0.22(0.13;0.36) | 0.40(0.23;0.71) | ||
| Midwest | 0.41(0.25;0.69) | 0.42(0.23;0.77) | ||
| Service organization | 0.162 | |||
| <0.001 | ||||
| No | 1.00 | 1.00 | ||
| Yes | 0.42(0.34;0.53) | 0.82(0.62;1.08) | ||
| Time taken to get to the service | <0.001 | 0.006 | ||
| Up to 20 minutes | 1.00 | |||
| 21 minutes or more | 1.51(1.24;1.84) | 1.38(1.10;1.74) | ||
| Waiting time until starting treatment | <0.001 | 0.011 | ||
| Up to one month | 1.00 | 1.00 | ||
| One month or more | 1.72(1.41;2.10) | 1.37(1.07;1.75) | ||
| Attention received | <0.001 | <0.001 | ||
| Poor | 1.00 | 1.00 | ||
| Good | 0.05(0.04;0.06) | 0.12(0.09;0.16) | ||
| Information and support | ||||
| Questions answered | <0.001 | <0.001 | ||
| No | 1.00 | 1.00 | ||
| Yes | 0.09(0.07;0.13) | 0.37(0.24;0.58) | ||
| Had no questions | 0.13(0.09;0.18) | 0.41(0.27;0.63) | ||
| Advice during treatment | <0.001 | 0.095 | ||
| No | 1.00 | 1.00 | ||
| Yes | 0.27(0.22;0.34) | 0.77(0.56;1.05) | ||
| Explanation about treatment during consultation | <0.001 | <0.001 | ||
| No | 1.00 | 1.00 | ||
| Yes | 0.19(0.16;0.24) | 0,33(0.25;0.44) | ||
| Service structure | ||||
| Assessment of facilities | <0.001 | <0.001 | ||
| Good | 1.00 | 1.00 | ||
| Poor | 11.50(9.28;14.25) | 6.94(5.49;8.77) | ||
a) 95%CI: 95% confidence interval.
b) P-value obtained using the Wald test.
Discussion
The study demonstrated low prevalence of user dissatisfaction with the service provided by Brazilian CEOs. Dissatisfaction was associated with service organization, receipt of information and support, and with the overall evaluation of the facilities at these dental care centers. Dissatisfaction was not found to be related to individual sociodemographic factors.
High prevalence of satisfaction among users of public health services in Brazil has been consistently described in the literature.9 The prevalence of satisfaction with Brazilian CEO services was found to be higher than that reported by Kitamura et al.12 for the southeast region of the state of Minas Gerais (86.78%). Another study conducted in public health services in the state of Rio Grande do Norte in 2009 found 90.9% satisfaction among CEO users.21 The differences between prevalence rates reported – among the few studies available – reflect different measurement methods. Similarly, differences have been found between services depending on the region of the country in which they are located, as demonstrated by this study. Higher prevalence of satisfaction among specialized dental care services when compared to satisfaction with Primary Care,20 confirms the result of an earlier study;23 however, the reasons for the difference found between the different health care levels have not been the object of studies.
High satisfaction of public health service users can be attributed, albeit partially, to selection bias. This may be related to the fact that the majority of studies, including this study, evaluate the outcome at the end of treatment and in the services themselves, thus increasing the possibility of the measurement being overestimated, since dissatisfied patients tend to desist from treatment or from using the service.24 Gratitude bias is also among the explanations for high prevalence of this form of satisfaction in developing countries:25 fear of losing the right to treatment,1 or understanding public services to be a favor rather than a civil right, can increase the chances of positive evaluation by users, preventing a more critical stance about the care received.17 This latter form of bias, however, needs to be assessed better with regard to public services in Brazil: recent studies have not found differences between types of dental care services, whether public or private, and satisfaction of their users, regardless of age – with the exception of adolescents.
With regard to associated factors, the absence of a relationship between socio-economic conditions and user dissatisfaction corroborates findings of other studies, conducted from the same perspective as this study, whether their object is SUS CEOs10 or dental care services offered by SUS Primary Care.19 A recent systematic review26 demonstrated that association between socio-demographic conditions and satisfaction with health services is weak and inconsistent. The most consistent associations were those relating to service quality characteristics, especially interpersonal relations between patients and health workers, and factors related to service organization.
It is noteworthy that absence of socio-economic inequality in relation to dissatisfaction with services is a positive result for the health services evaluated and indicates that SUS is achieving part of its objectives which include promoting equality.
This study highlighted the importance of service organization and information and support measures related to communication between health workers and patients. Individuals who did not receive advice about treatment and did not have their questions about treatment answered at CEOs were more likely to be dissatisfied. These findings do not correspond to those of Kitamura et al.,12 whereby differences in categorization of the outcome and measurements of information and support hinder comparison of their results with those of this study. However, with regard to Primary Care, both in the case of dental treatment20 and other health conditions,22 communication and interrelation with health workers has been an important marker of patient satisfaction with services. In a study conducted in 2009 in the municipality of Montes Claros, in the state of Minas Gerais, Roberto et al.20 found that individuals who had access to information about oral health prevention and promotion had 67% less likelihood of dissatisfaction with dental care services. According to the results of our study, Brazilians who received explanations about treatment during dental consultations had 71% less likelihood of dissatisfaction with the service. According to Donabedian,1 interpersonal relationships are the vehicle through which technical care is given and on which its success depends.
With regard to service organization, dissatisfaction was found to be associated with all the factors evaluated, except for care provided at a scheduled time (appointment). Kitamura et al.12 also found that time spent in the CEO waiting room was associated with a lower satisfaction score among users. Taking longer to get to the service and having to wait longer before treatment began increased the likelihood of dissatisfaction by 40%. Similarly to the results of our study, an earlier study about Primary Care in Brazil found that users of services that were a long way or a moderate distance from their homes reported dissatisfaction more frequently.22 Delay in being attended to by the CEO reflects a mismatch between the scaling up of Primary Care services and Secondary Care oral health services,20 with a possible impact on clinical outcomes. As already proposed,27 waiting time affects patients’ readiness to return to services.
Also with regard to service organization measures, patients who classified the attention they received as poor were more likely to be dissatisfied. According to Souza et al.,28 attention received at Primary Care is fundamental for meeting service users’ needs, creating a bond between them and the health team, triggering comprehensive care and modifying clinical care, as well as enabling evaluation of the process based on the beneficiary’s experience. As such it is important to emphasize the opportunity to act to improve service quality, as represented by the attention received by service users.
Among the study’s strong points, it is appropriate to mention the fact that it is the first study to evaluate factors associated with dissatisfaction with dental care services provided by Brazil’s CEOs based on PMAQ-CEO data collected in accordance with standardized methods. The low proportion of cases excluded due to lack of answers (1.9%) can be considered to be another strong point of this study. Notwithstanding, there are limitations inherent to the design of PMAQ-CEO capable of influencing the results, including the use of a non-probabilistic sample of users selected at the service itself, which, as mentioned above, may have underestimated measurement of dissatisfaction. Moreover, the difference between the number of users interviewed at some services should be taken into consideration when interpreting the results.
Despite these limitations, the scope of PMAQ-CEO and the inexistence of another study that can provide such comprehensive national data, make these findings an important source of information for evaluating service quality, capable of being compared with the next stages of the study, thus enabling evaluation of these quality indicators.
The conclusion reached is that dissatisfaction of Brazilian CEO users with the service received is low, there being no association between this outcome and socio-demographic characteristics. Factors associated with dissatisfaction highlight the importance of efforts aimed at guaranteeing quality, directed towards service organization itself by improving administrative efficiency, as well as by enhancing approaches to information and support that ensure interaction between patients and health workers.
REFERENCES
1. Donabedian A. The Quality of Care: How Can It Be Assessed? JAMA. 1988;260(12):1743-8. [ Links ]
2. De Geyndt W. Managing the quality of health care in developing countries [Internet]. The World Bank; 1995. Report No.: WTP258. Available in: http://documents.worldbank.org/curated/en/898741468739761841/Managing-the-quality-of-health-care-in-developing-countries [ Links ]
3. Akerman M, Nadanovsky P. Avaliação dos serviços de saúde: avaliar o quê? Cad Saúde Pública. 1992;8(4):361-5. [ Links ]
4. George AK, Sanda MG. Measuring Patient Satisfaction. In: Penson DF, Wei JT, organizadores. Clinical Research Methods for Surgeons. Totowa, NJ: Humana Press; 2007. p. 253-65. [ Links ]
5. Sitzia J, Wood N. Patient satisfaction: A review of issues and concepts. Soc Sci Med. 1997;45(12):1829-43. [ Links ]
6. DuPree E, Anderson R, Nash IS. Improving Quality in Healthcare: Start With the Patient. Mt Sinai J Med J Transl Pers Med 2011;78(6):813- [ Links ]
7. Esperidião MA, Trad LAB. Avaliação de satisfação de usuários: considerações teórico-conceituais. Cad Saúde Pública. 2006;22(6):1267-76. [ Links ]
8. Baron-Epel O. Evaluation of the consumer model: relationship between patients’ expectations, perceptions and satisfaction with care. Int J Qual Health Care 2001;13(4):317-23. [ Links ]
9. Lima ACS de, Cabral ED, Vasconcelos MMVB. Satisfação dos usuários assistidos nos Centros de Especialidades Odontológicas do Município do Recife, Pernambuco, Brasil. Cad Saúde Pública. 2010;26(5):991-1002. [ Links ]
10. Magalhães BG, Oliveira RS de, Góes PSA de, Figueiredo N. Avaliação da qualidade dos serviços prestados pelos Centros de Especialidades Odontológicas: visão dos usuários. Cad Saúde Coletiva. 2015;23(1):76-85. [ Links ]
11. Costa EB da, Carneiro JDB, Oliveira AMG. Satisfação dos usuários assistidos em quatro centros regionais de especialidades odontológicas do Ceará, Brasil. Saúde Em Debate 2018;42(118):631-45. [ Links ]
12. Shizuê Kitamura E, Rocha Bastos R, Valente Palma P, Cristina Gonçalves Leite I. Avaliação da satisfação dos usuários dos Centros de Especialidades Odontológicas da macrorregião Sudeste de Minas Gerais, 2013. Epidemiol Serv Saúde. 2016;25(1):1-10. [ Links ]
13. Blendon RJ, Kim M, Benson JM. The Public Versus The World Health Organization On Health System Performance. Health Aff (Millwood) 2001;20(3):10-20. [ Links ]
14. Bordin D, Fadel CB, Moimaz SAS, Garbin CAS, Saliba NA. Estudo comparativo da satisfação de usuários e profissionais da saúde com o serviço público odontológico. Ciênc Saúde Coletiva. 2017;22(1):151-60. [ Links ]
15. Brasil, Ministério da Saúde. Portaria no 261. Institui, no âmbito da Política Nacional de Saúde Bucal, o Programa de Melhoria do Acesso e Qualidade dos Centros de Especialidades Odontológicas (PMAQ-CEO) e o Incentivo Financeiro (PMAQ-CEO), denominado Componente de Qualidade da Atenção Especializada em Saúde Bucal. Diário Oficial da União. 2013 [ Links ]
16. De Lucena EHG. Centros de Especialidades Odontológicas (CEO): análise a partir dos relatos de planejamento e resultados dos indicadores no Programa Nacional de Melhoria do Acesso e da Qualidade (PMAQ-CEO). 2017. Disponível em: http://repositorio.unb.br/handle/10482/22541 [ Links ]
17. Figueiredo N, Goes PSA, Martelli PJL, organizadores. Os caminhos da saúde bucal no Brasil: um olhar quali e quanti sobre os Centro de Especialidade Odontológicas (CEO) no Brasil. Recife: Editora UFPE; 2016 [ Links ]
18. Brandão AL da RB da S, Giovanella L, Campos CEA. Avaliação da atenção básica pela perspectiva dos usuários: adaptação do instrumento EUROPEP para grandes centros urbanos brasileiros. Ciênc Saúde Coletiva. 2013;18(1):103-14. [ Links ]
19 Carreiro DL, Oliveira RFR, Coutinho WLM, Martins AME de BL, Haikal DS. Avaliação da satisfação com a assistência odontológica na perspectiva de usuários brasileiros adultos: análise multinível. Ciênc Saúde Coletiva. 2018;23(12):4339-49. [ Links ]
20. Roberto LL, Martins AME de BL, Paula AMB de, Ferreira EF e, Haikal DSA. Insatisfação com os serviços odontológicos e fatores associados entre adultos. Ciênc Saúde Coletiva. 2017;22(5):1601-13. [ Links ]
21. Souza GC de A. Centros de especialidades odontológicas: avaliação da atenção de média complexidade na rede pública da Grande Natal. 2009; Disponível em: https://repositorio.ufrn.br/jspui/handle/123456789/17054 [ Links ]
22. Protasio APL, Gomes LB, Machado L dos S, Valença AMG. Factors associated with user satisfaction regarding treatment offered in Brazilian primary health care. Cad Saúde Pública. 2017; 33(2), e00184715 [ Links ]
23. Adhikary G, Shawon MSR, Ali MW, Shamsuzzaman M, Ahmed S, Shackelford KA, et al. Factors influencing patients’ satisfaction at different levels of health facilities in Bangladesh: Results from patient exit interviews. PLoS ONE 16;13(5):e0196643. [ Links ]
24. Dyer T, Owens J, Robinson PG. The acceptability of healthcare: from satisfaction to trust. Community Dent Health. 2016;33:1-10. [ Links ]
25. Vaitsman J, Andrade GRB de. Satisfação e responsividade: formas de medir a qualidade e a humanização da assistência à saúde. Ciênc Saúde Coletiva. 2005;10(3):599-613. [ Links ]
26. Batbaatar E, Dorjdagva J, Luvsannyam A, Savino MM, Amenta P. Determinants of patient satisfaction: a systematic review. Perspect Public Health. 2017;137(2):89-101. [ Links ]
27. Al-Harajin R, Al-Subaie S, Elzubair A. The association between waiting time and patient satisfaction in outpatient clinics: Findings from a tertiary care hospital in Saudi Arabia. J Fam Community Med. 2019;26(1):17. [ Links ]
28. Souza ECF de, Vilar RLA de, Rocha N de SPD, Uchoa A da C, Rocha P de M. Acesso e acolhimento na atenção básica: uma análise da percepção dos usuários e profissionais de saúde. Cad Saúde Pública. 2008;24(suppl 1):s100-10 [ Links ]
Associate editor: Bruno Pereira Nunes - orcid.org/0000-0002-4496-4122
Received: October 17, 2019; Accepted: April 01, 2020
 This is an Open Access article distributed under the terms of the Creative Commons Attribution Non-Commercial License, which permits unrestricted non-commercial use, distribution, and reproduction in any medium, provided the original work is properly cited.
