


Servicios Personalizados
Revista

Articulo
 texto en
  Inglés (pdf)
 Articulo en XML
 Referencias del artículo
 Enviar articulo por email
Indicadores
-
 Citado por SciELO
Links relacionados
-
 Similares en
SciELO
Similares en
SciELO
Compartir

 Permalink
Epidemiologia e Serviços de Saúde
versión impresa ISSN 1679-4974versión On-line ISSN 2237-9622
Epidemiol. Serv. Saúde vol.29 no.3 Brasília jun. 2020 Epub 25-Mayo-2020
http://dx.doi.org/10.5123/s1679-49742020000300007
Original article
COVID-19 in the city of Rio de Janeiro: spatial analysis of first confirmed cases and deaths
1Universidade do Estado do Rio de Janeiro, Instituto de Medicina Social, Rio de Janeiro, RJ, Brazil
2International Vaccine Institute, Seoul, South Korea
Objective
to describe the spatial distribution of the first confirmed COVID-19 cases and deaths in Rio de Janeiro.
Methods
this was an ecological study of confirmed SARS-CoV-2 cases and deaths between March 6thand April 10th, 2020. Incidence, mortality, lethality, excess risk and global and local Moran rates were calculated.
Results
1,808 confirmed cases and 92 confirmed deaths were recorded. The COVID-19 incidence rate was 26.8/100,000 inhab., the mortality rate was 1.36/100,000 inhab. and lethality rate 5%. The incidence rate in eight neighborhoods was 4-12 times higher than the overall rate for the municipality: Joá, in the city’s Western Zone; Cosme Velho, Gávea, Ipanema, Jardim Botânico, Lagoa, Leblon and São Conrado, in its Southern Zone.
Conclusion
high risk of COVID-19 infection and deaths was found in neighborhoods in the Southern Zone of the city of Rio de Janeiro. Neighborhoods in the Northern Zone of the city also stand out in relation to high risk of death.
Key words: Coronavirus; Spatial Analysis; Epidemiology; Brazil
Introduction
In December 2019, a new virus of the Coronaviridae family (initially called Novel Coronavirus 2019-nCoV, later renamed SARS-CoV-2), causing a severe acute respiratory syndrome (COVID-19), emerged in Wuhan, in Hubei Province, China.1 In all, seven human coronaviruses (HCoVs) have been identified thus far: HCoV-229E, HCoV-OC43, HCoV-NL63, HCoV-HKU1, SARS-CoV (which causes severe acute respiratory syndrome), MERS-CoV (which causes Middle East respiratory syndrome) and SARS-CoV-2.3
Transmission is mainly person-to-person by means of respiratory droplets.4 SARS-CoV-2 infection pattern in humans is similar to that of other coronaviruses, in particular severe acute respiratory syndrome coronavirus (SARS-CoV) and Middle East respiratory syndrome coronavirus (MERS-CoV).3
On January 30th2020, the World Health Organization (WHO) declared the novel coronavirus to be a Public Health Emergency of International Concern – the Organization’s highest level of alert, as provided for in the International Health Regulations. On March 11th2020, WHO declared COVID-19 to be a pandemic.4 By April 10th2020, 1,521,252 confirmed COVID-19 cases and 92,798 confirmed COVID-19 deaths had been recorded in 210 countries.6
The first COVID-19 case in Brazil, and in South America, was recorded on February 26th2020 in São Paulo.7 By April 10th2020, 19,638 cases and 1,056 deaths from the disease had been confirmed in Brazil, corresponding to 5.4% lethality.8 COVID-19 has spread rapidly through the country and community transmission was declared nationwide on March 20th2020.9
The city of Rio de Janeiro is one of Brazil’s largest urban centers and is the city with the second largest number of COVID-19 cases.10 The first COVID-19 case in the city of Rio e Janeiro was recorded on March 6th2020, just 11 days after Brazil’s first case.11 The city of Rio de Janeiro is highly connected with other urban centers in economic and social terms, contributing to it becoming a hub for dissemination of the disease to other territories and reinforcing the need to understand its transmission pattern in order to ensure better implementation of mitigation and control measures.13
Public Health spatial analysis methods are used principally in ecological studies for detecting spatial and temporal clusters for the purposes of health service planning and use evaluation. In outbreak and epidemic situations spatial analysis is an important tool for identifying areas of greater risk, serving to support control measure implementation.2
Understanding the spatial distribution of the disease is fundamental for forecasting local outbreaks and developing response strategies during the initial stages of the COVID-19 emergency.
The objective of this study was to describe the spatial distribution of the first confirmed COVID-19 cases and deaths in the city of Rio de Janeiro.
Methods
An ecological study was conducted, having the neighborhoods of the city of Rio de Janeiro as its units of analysis.
The city is divided into 160 neighborhoods, having an estimated population of 6,752,339 inhabitants in 2020.15 Rio de Janeiro has well-known social inequalities, due to the large number of people living in extreme poverty, most of whom live in the city’s 763 favelas , and who have difficulty in accessing quality health services.15
All confirmed COVID-19 cases and deaths in the city of Rio de Janeiro between March 6th(date of the first confirmed case) and April 10th2020 were included. City Health Department open access panel data on confirmed SARS-CoV-2 cases and deaths by place of residence were used.12
Confirmed COVID-19 cases were considered to be individuals with positive SARS-CoV-2 laboratory test results, regardless of signs and symptoms.16
The variables studied were sex (female, male, no information), age (average in years), age group (0-9, 10-19, 20-29, 30-39, 40-49, 50-59, 60-69, 70-79, 80-89, 90-100, no information) and neighborhood of residence. This variable was later classified by area (Northern Zone, Central Zone, Western Zone, Southern Zone).
Absolute and relative case and death frequencies were described by sex and age group.
The projected estimate of the number of inhabitants in each neighborhood in 2020 was calculated by means of interpolation based on 2000 and 2010 Census population data. Incidence and mortality rates per 100,000 inhabitants were calculated, as was lethality (proportion of infected people who die) and excess risk. This information was presented on thematic maps. Excess risk is calculated by determining the overall rates for the municipality, and interpreted by noting which neighborhoods have incidence and mortality rates under or over the overall rates.17
The incidence and mortality rates by city neighborhood were also used to calculate the Global Moran Index (Moran’s I), which analyzes global spatial autocorrelation, and the Local Indicator of Spatial Association (LISA), to identify local clusters in the city and their statistical significance.17 The objective of Moran’s global and local indices is to identify patterns in the spatial distribution of the indictors presented.17 The high-high, low-low, high-low and low-high quadrants were presented using scatter plots and cluster maps.17
R 3.5.3 software was used for data manipulation and analysis, and Quantum Geographic Information System (QGIS) software version 2.14.8 and GeoDa software version 1.14.0 were used for the spatial analyses.
This study used secondary and aggregated data and was conducted in keeping with research ethics guidelines.
Results
Between March 6thand April 10th2020, 1,808 confirmed COVID-19 cases and 92 confirmed COVID-19 deaths were recorded in the city of Rio de Janeiro. Of the total cases, 47.7% were male, 51.4% were female and 0.9% had no information as to sex. 56.5% of total deaths were male, 38,0% were female and there was no information as to sex for 5.5% ( Table 1 ). Average case age was 49 years, while average age for deaths was 68 years. Prevalence among cases was highest in the 30-59 years age group, while deaths were more frequent among individuals aged 60-89 years ( Table 1 ). The number of new cases per day can be seen in Figure 1 , with an increase in new cases being recorded daily with effect from March 23rd.
Table 1 – Absolute and relative frequencies of confirmed COVID-19 cases and deaths, by sex and age, in the city of Rio de Janeiro, between March 6th and April 10th 2020
| Variables | Cases (n) | Cases (%) | Deaths (n) | Deaths (%) | |
|---|---|---|---|---|---|
| Sex | Female | 929 | 51.4 | 35 | 38.0 |
| Male | 862 | 47.7 | 52 | 56.5 | |
| No information | 17 | 0.9 | 5 | 5.5 | |
|
| |||||
| Age (in years) | 0-9 | 15 | 0.8 | - | - |
| 10-19 | 12 | 0.7 | - | - | |
| 20-29 | 141 | 7.8 | 2 | 2.2 | |
| 30-39 | 404 | 22.3 | 1 | 1.1 | |
| 40-49 | 400 | 22.1 | 7 | 7.6 | |
| 50-59 | 294 | 16.3 | 10 | 10.9 | |
| 60-69 | 231 | 12.8 | 24 | 26.1 | |
| 70-79 | 141 | 7.8 | 23 | 25.0 | |
| 80-89 | 88 | 4.9 | 20 | 21.7 | |
| 90-100 | 6 | 0.3 | 1 | 1.1 | |
| No information | 76 | 4.2 | 4 | 4.3 | |
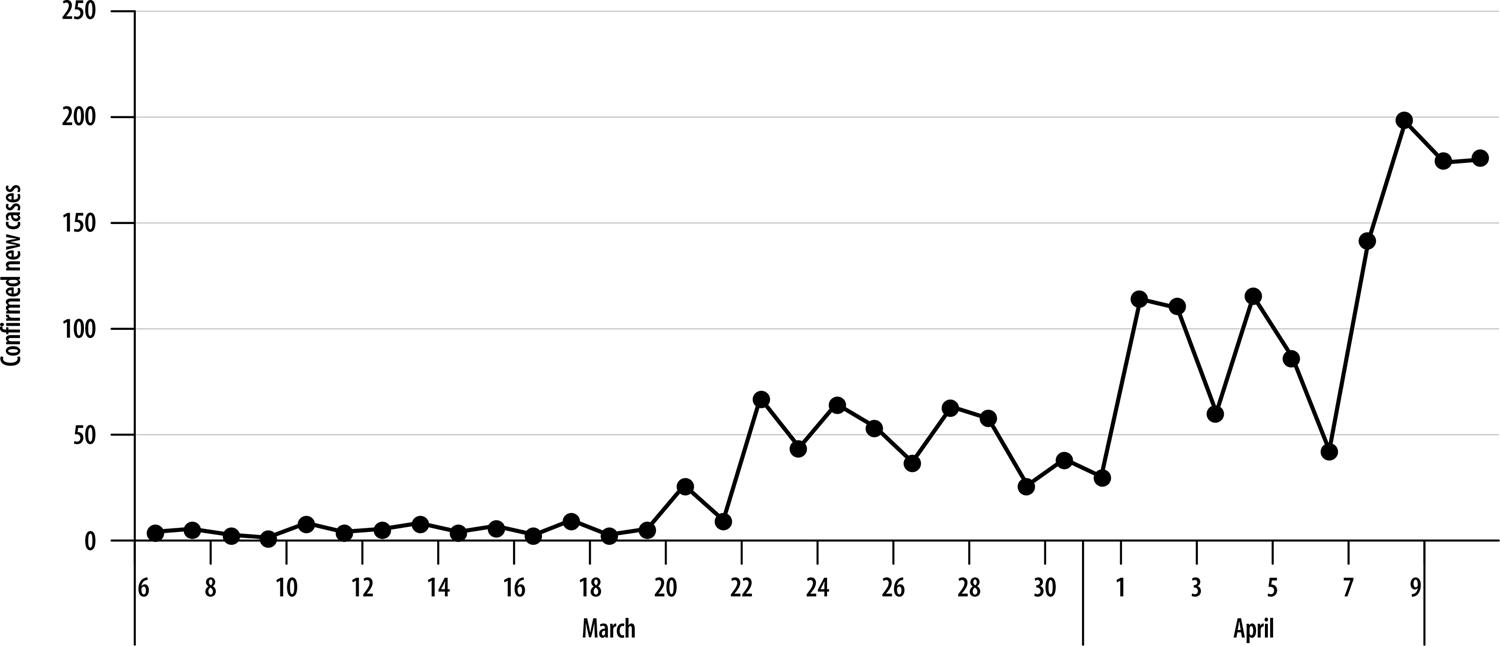
Figure 1 – New confirmed COVID-19 cases in the city of Rio de Janeiro, between March 6th and April 10th 2020 (N=1808)
The COVID-19 incidence rate for the city of Rio de Janeiro was 26.8/100,000 inhab., while the mortality rate was 1.36/100,000 inhab. There was 5.0% lethality as at April 10th. The city’s highest incidence rate was recorded in the Joá neighborhood (300.7/100,000 inhab.), followed by São Conrado (240.6/100,000 inhab.), Leblon (202.6/100,000 inhab.), Jardim Botânico (200.5/100,000 inhab.), Lagoa (193.9/100,000 inhab.), Ipanema (186.2/100,000 inhab.) and Gávea (123.9/100,000 inhab.). With the exception of the first neighborhood, the remainder are located in the Southern Zone of the city ( Figure 2A ).
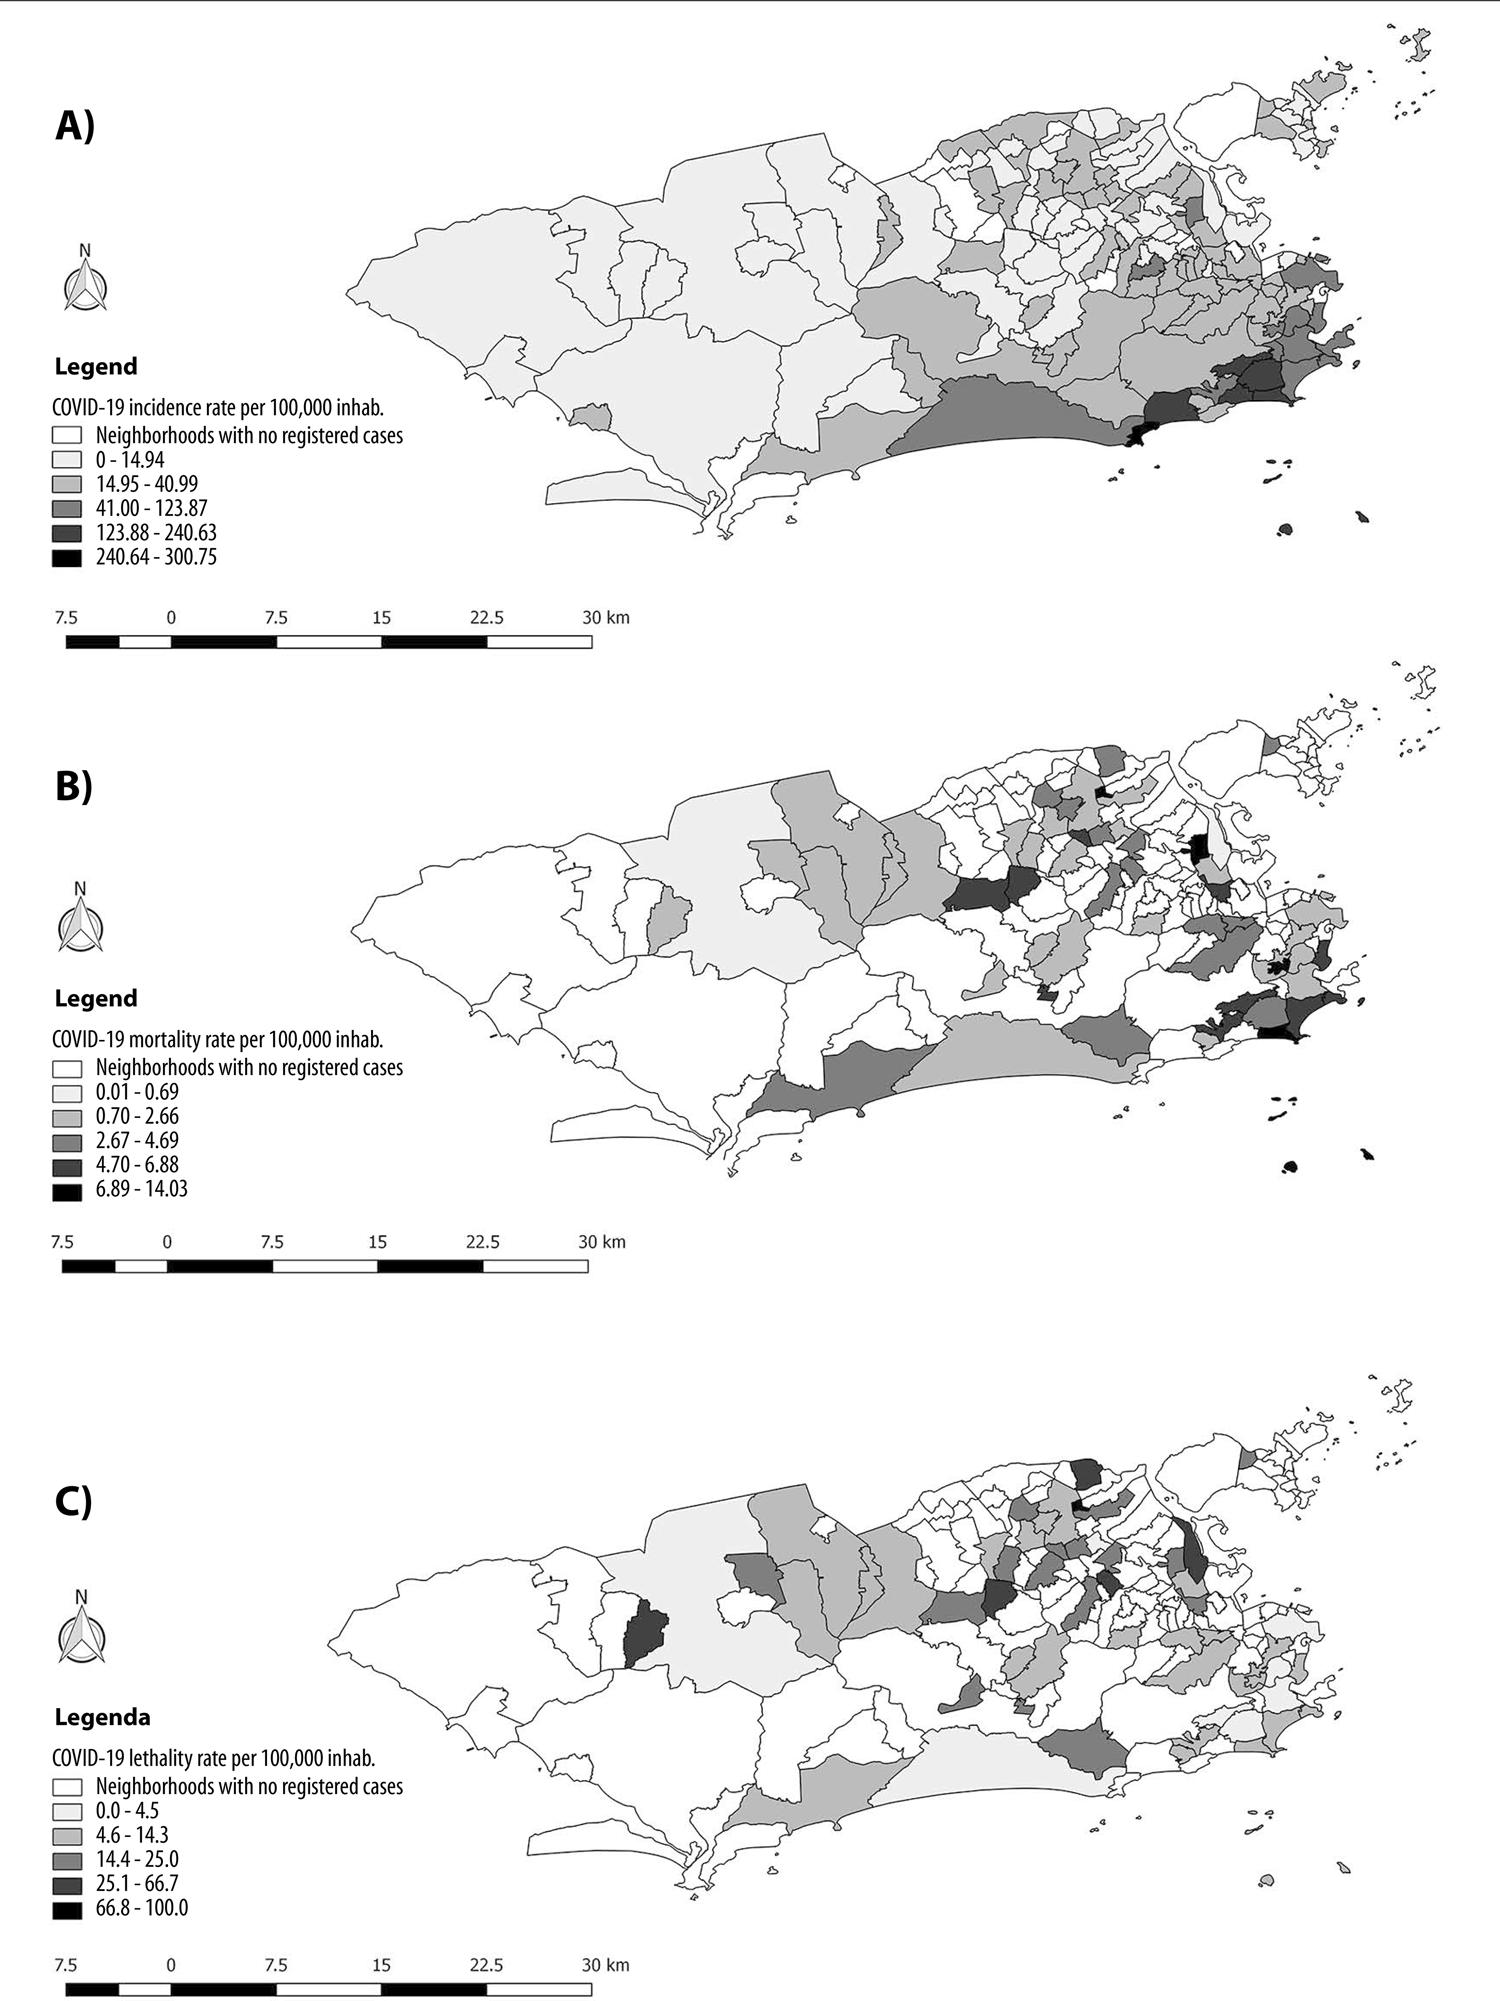
Figure 2 – Spatial distribution of COVID-19 indicators in the city of Rio de Janeiro, between March 6th and April 10th 2020
The city’s highest mortality rate was found in Cosme Velho (14.0/100,000 inhab.), followed by Ipanema (12.9/100,000 inhab.), both of which are located in the Southern Zone; and Vista Alegre (11.2/100,000 inhab.) and Bonsucesso (11.0/100,000 inhab.), both of which are located in the Northern Zone ( Figure 2B ).
Lethality was highest in Vista Alegre (100,0%), located in the Northern Zone, followed by Vila Valqueire (66.6%), located in the Western Zone; Pilares (50,0%), Maré (50,0%) and Vigário Geral, located in the Northern Zone (40,0%); and Inhoaíba (33.3%), located in the Western Zone ( Figure 2C ).
When applying the excess risk method, it was found that the Joá neighborhood in the Western Zone and Cosme Velho, Gávea, Ipanema, Jardim Botânico, Lagoa, Leblon and São Conrado in the Southern Zone had incidence rates between four and twelve times higher than the overall municipal rate ( Figure 3A ). In turn, Benfica, Bonsucesso, Vaz Lobo and Vista Alegre (in the Northern Zone), Copacabana, Leme, Cosme Velho, Flamengo, Gávea, Ipanema and Jardim Botânico (in the Southern Zone), and Vila Valqueire, Jardim Sulacap and Gardênia Azul (in the Western Zone) had mortality rates between four and ten times higher than the overall municipal rate ( Figure 3B ).
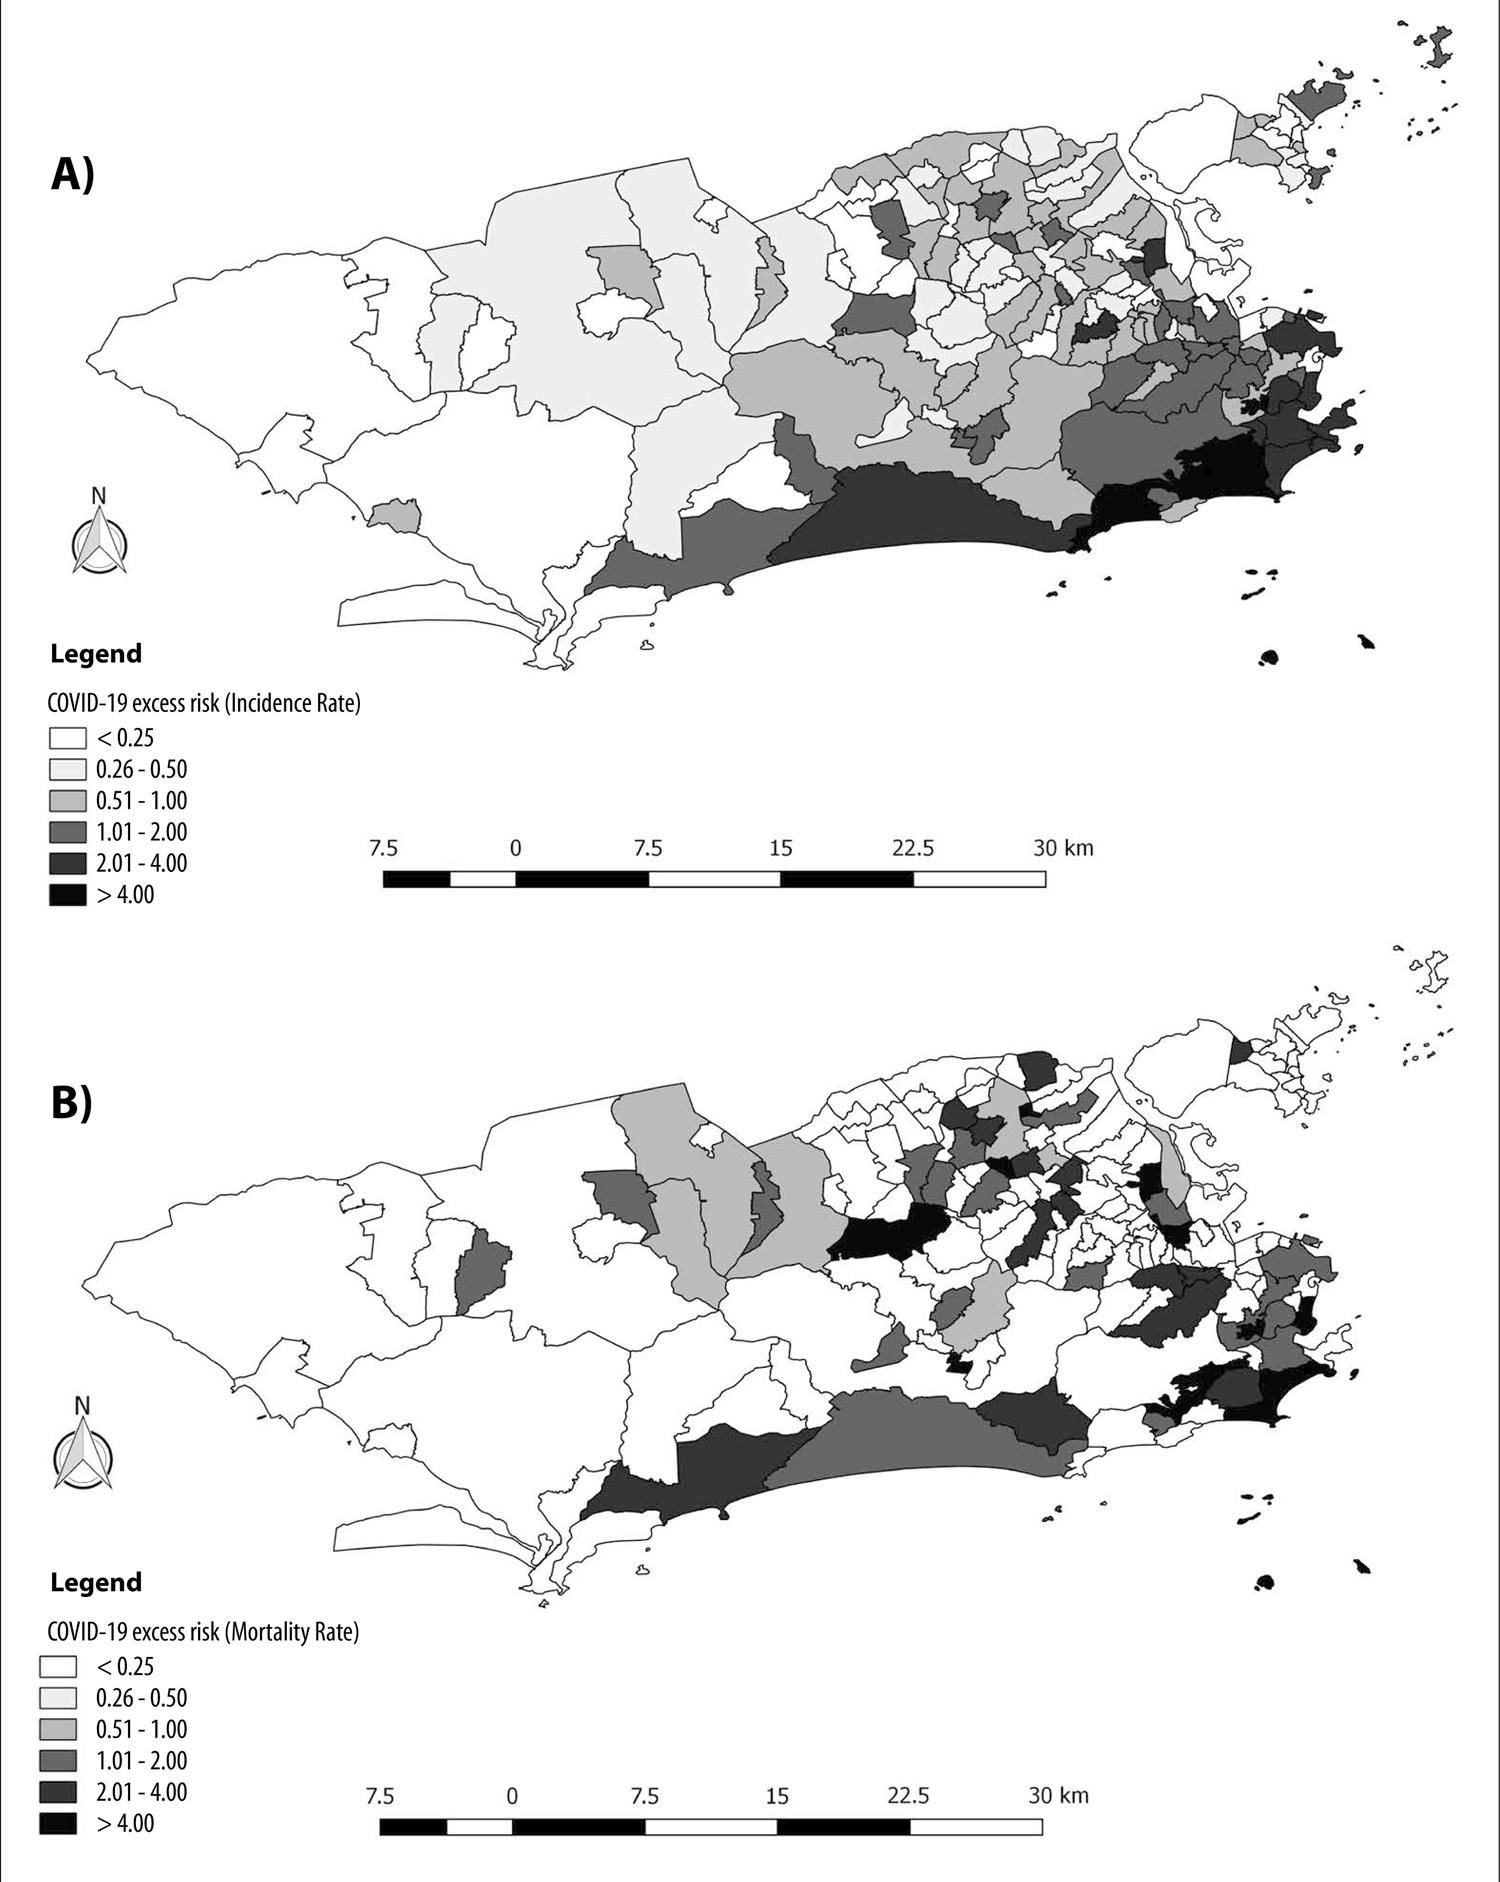
Figure 3 – Spatial distribution of COVID-19 indicators in the city of Rio de Janeiro, between March 6th and April 10th 2020
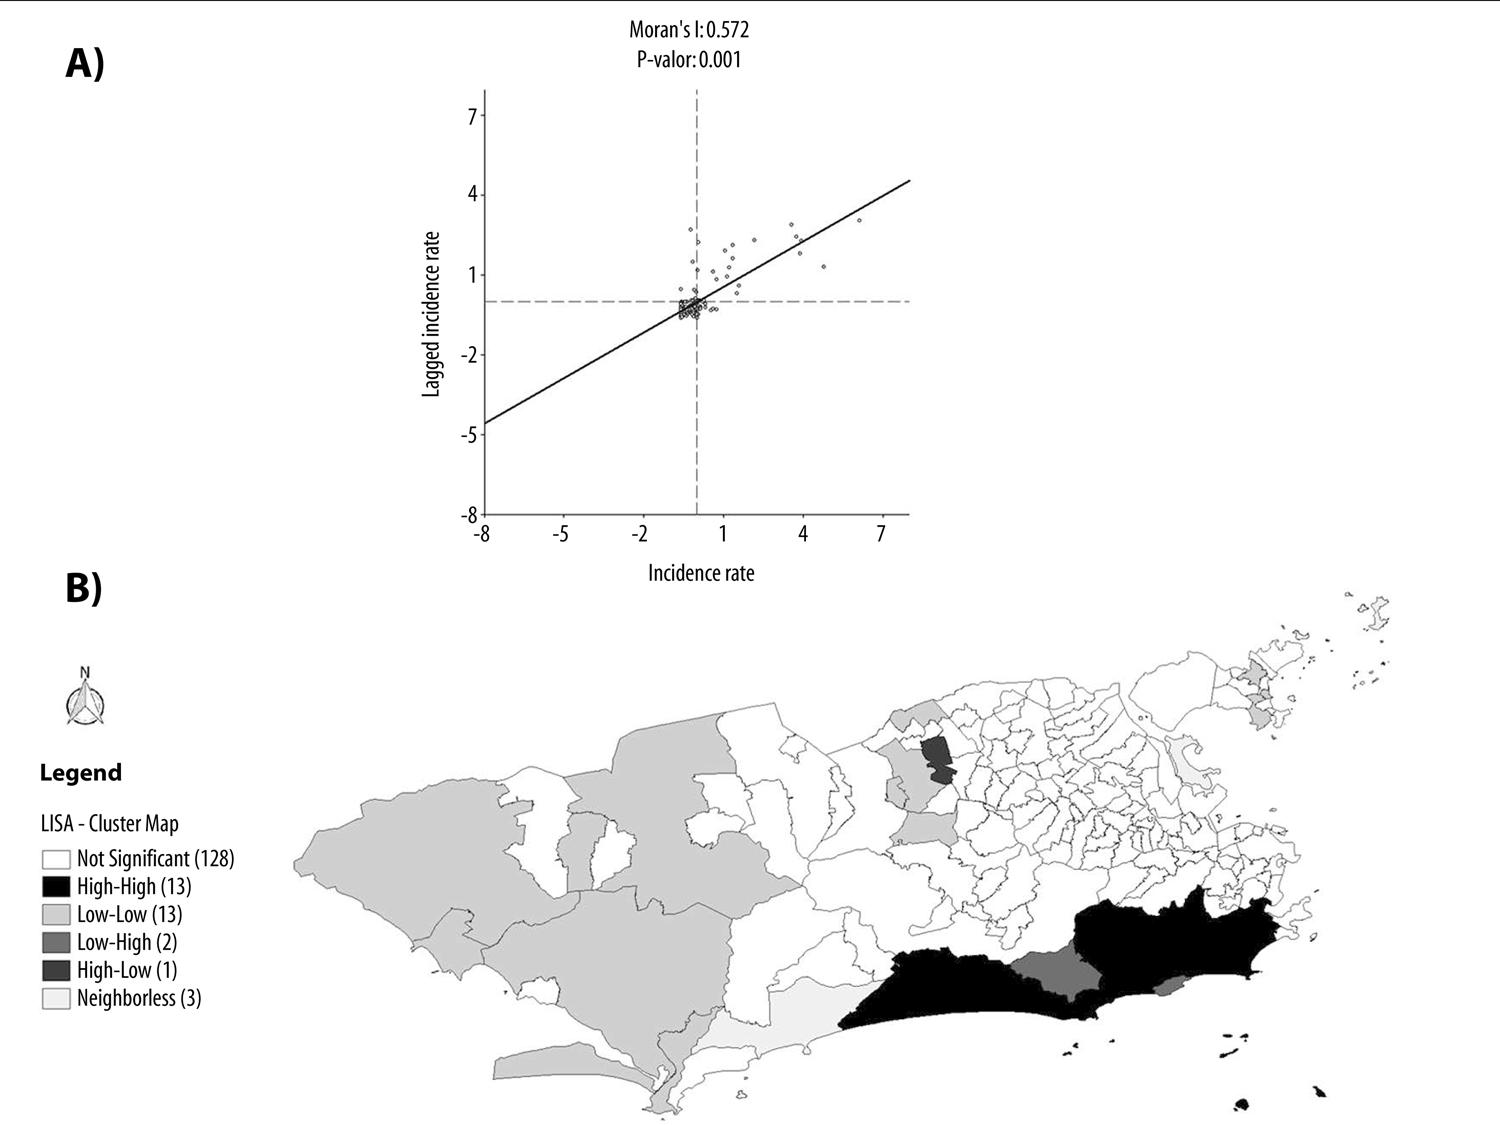
Finally, Moran’s I showed statistical difference (p-value=0.001) for COVID-19 global spatial autocorrelation in the city of Rio de Janeiro ( Figure 4A ). When applying the LISA method, local level autocorrelation and spatial clusters were found. The Alto da Boa Vista, Barra da Tijuca, Joá, Botafogo, Copacabana, Gávea, Humaitá, Ipanema, Jardim Botânico, Lagoa, Leblon, Rocinha and São Conrado neighborhoods were classified as high-high, i.e. where the situation is most serious and where incidence rates will rise increasingly in the following weeks ( Figure 4B ).
Discussion
This study analyzed COVID-19 spatial distribution in the city of Rio de Janeiro. The frequency measurements found for the municipality were higher than the national average. The mortality data we found follow the pattern of the national data, with greater risk of death for males and people over 60 years old.8
Differently to the national profile, females were predominant among the first cases reported in Rio de Janeiro. The most affected age range was that of young adults and this was similar to the national pattern.8 Similar patterns were found in the international1 and national literature, suggesting that COVID-19 infects economically active people more, but causes more deaths among the elderly, people with chronic diseases and individuals with a history of immunossuppression.18 The city of Rio de Janeiro is an important entry point for international travelers, being recognized worldwide as a tourist destination. This fact may have contributed to the virus being introduced in Brazil, since it was the country’s second city to register confirmed COVID-19 cases.19
The number of new cases per day in Rio de Janeiro has oscillated, as it has in the rest of the country, given that the network for distributing diagnosis tests to health services is still being implemented.18
Based on the spatial distribution of the incidence rate in the municipality, it can be seen that the Southern Zone neighborhoods were the most affected by the disease. Moreover, as the first confirmed cases were registered there, they were potentially the source of the disease spreading to the rest of the city.
Attention is drawn to the fact the neighborhoods in the city’s Northern Zone had a higher mortality rate, even when compared to neighborhoods in the Southern Zone where incidence was higher. This may be linked to access to health services and to the socio-economic and cultural behavior of the population.20
The same phenomenon was observed with regard to excess risk. The incidence rate in seven Southern Zone neighborhoods was above the average rate for the municipality. With regard to mortality rate excess risk, this was found in a further four Northern Zone neighborhoods and a further three Western Zone neighborhoods. These are places that concentrate a large agglomeration of middle and low-income people and areas of socially vulnerable populations.20
Moran’s I and LISA showed global and local spatial autocorrelation, suggesting the need to maintain and intensify control strategies, such as social distancing, in these regions of the city, in order to reduce the speed of SARS-CoV-2 transmission and, consequently, avoid an increase in deaths, given the possibility of health system collapse.18
This pattern draws attention to the need for a plan to mitigate or suppress the disease taking into consideration social contexts and realities. The areas of greatest social vulnerability in the city have already begun to suffer the first impacts of the disease, such as the occurrence of deaths in subnormal clusters ( favelas ),22 thus reinforcing the need for public health policies that incorporate socio-economic and cultural contexts.20
Certain limitations and considerations are important when interpreting the findings of this study. Firstly, the confirmed case definition is based on laboratory criteria. This fact is intrinsically related to potential underreporting, both for the city of Rio de Janeiro and for Brazil as a whole. The 2020 population used to calculate the rates was an estimate based on the 2000 and 2010 Censuses and, despite being close, they may be different to reality. The incidence and mortality rates, despite being the best way to make comparisons between one place and another, may not reflect well information for neighborhoods with small populations, such as Joá and Cosme Velho, which end up having very high rates. The same is true for lethality, given the neighborhoods with low numbers of cases and deaths end up having lethality above 50%, as is the case of Vista Alegre for instance.
Furthermore, 215 cases and 2 deaths had no information on neighborhood of residence or were not resident in the city of Rio de Janeiro, and were therefore not included in the spatial analysis. This fact is due to people from cities in the metropolitan region being referred to hospitals in the city of Rio de Janeiro.
This study assessed spatial distribution of the first COVID-19 cases and deaths in the city of Rio de Janeiro. The results of the analyses described high risk of infection and death from the disease in neighborhoods in the city’s Southern Zone. Neighborhoods in the Northern Zone also stood out with regard to high risk of death. We assume that this distribution may alter rapidly, due to the high transmissibility of COVID-19, alongside the strong social differences between neighborhoods in Rio de Janeiro. New studies using spatial analyses of deaths and recovered cases of the disease will contribute to understanding COVID-19 evolution in Rio de Janeiro.
Analyzing the spatial profile of a new disease in the territory is essential for understanding patterns and for adopting control measures. We suggest that COVID-19 emergency plans should be created taking into consideration the socio-economic and cultural characteristics of the different clusters in the territory in order to achieve greater control measure effectiveness.
REFERENCES
1. Heymann DL, Shindo N. COVID-19: what is next for public health? Lancet [Internet]. 2020 Feb [cited 2020 Apr 30];395(10224):542–5. Available from: https://doi.org/10.1016/S0140-6736(20)30374-3 [ Links ]
2. Kang D, Choi H, Kim J-H, Choi J. Spatial epidemic dynamics of the COVID-19 outbreak in China. Int J Infect Dis [Internet]. 2020 Apr [cited 2020 Apr 11]; Available from: http://doi.org/10.1016/j.ijid.2020.03.076 [ Links ]
3. Cheng ZJ, Shan J. 2019 Novel coronavirus: where we are and what we know. Infection [Internet]. 2020 Apr [cited 2020 Apr 30];48(2):155-63. Available from: https://doi.org/10.1007/s15010-020-01401-y [ Links ]
4. Organização Pan-Americana da Saúde. Folha informativa – COVID-19 (doença causada pelo novo coronavírus) [Internet]. Brasília: Organização Pan-Americana da Saúde; 2020 [citado 2020 abr 12]. Disponível em: https://www.paho.org/bra/index.php?option=com_content&view=article&id=6101:covid19&Itemid=875 [ Links ]
5. World Health Organization. WHO announces COVID-19 outbreak a pandemic [Internet]. Geneva: World Health Organization; 2020 [cited 2020 Apr 11]. Available from: http://www.euro.who.int/en/health-topics/health-emergencies/coronavirus-covid-19/news/news/2020/3/who-announces-covid-19-outbreak-a-pandemic [ Links ]
6. World Health Organization. Situation report-81: coronavirus disease 2019 (COVID-19) [Internet]. Geneva: World Health Organization; 2020 [cited 2020 Apr 30]. Available from: https://www.who.int/emergencies/diseases/novel-coronavirus-2019/situation-reports [ Links ]
7. United Nations. Latin America and the Caribbean and the COVID-19 pandemic. Economic and social effects. COVID-19 Special Report [Internet]. 2020 abr [cited 2020 Apr 11];1:1-13. Available from: https://repositorio.cepal.org/bitstream/handle/11362/45351/1/S2000263_en.pdf [ Links ]
8. Ministério da Saúde (BR). Centro de Operações de Emergência em Saúde Pública. Coronavírus COVID-19, 10 de abril de 2020. Bol Epidemiol Diário [Internet]. 2020 abr [citado 2020 abr 13];9. Disponível em: https://www.saude.gov.br/images/pdf/2020/April/10/10.04.2020-COVID.pdf [ Links ]
9. Brasil. Ministério da Saúde. Portaria MS/GM no454, de 20 de março de 2020. Declara, em todo o território nacional, o estado de transmissão comunitária do coronavírus (covid-19) [Internet]. Diário Oficial da União, Brasília (DF), 2020 mar 20 [citado 2020 abr 11];Seção 1 – Extra:1. Disponível em: http://www.in.gov.br/en/web/dou/-/portaria-n-454-de-20-de-marco-de-2020-249091587 [ Links ]
10. Costa E, Carvalho I, Neiva M, Sanches T. Análise – municípios Brasil – COVID-19 Brasil [Internet]. São Paulo: Universidade de São Paulo; 2020 [citado 2020 abr 12]. Disponível em: https://ciis.fmrp.usp.br/covid19/analise-municipios-br/ [ Links ]
11. Ministério da Saúde (BR). Coronavírus Brasil: painel coronavírus [Internet]. Brasília: Ministério da Saúde; 2020 [citado 2020 abr 12]. Disponível em: https://covid.saude.gov.br/ [ Links ]
12. Prefeitura da Cidade do Rio de Janeiro. Painel Rio COVID-19 [Internet]. Rio de Janeiro: Prefeitura da Cidade do Rio de Janeiro; 2020 [citado 2020 abr 12]. Disponível em: https://experience.arcgis.com/experience/38efc69787a346959c931568bd9e2cc4?fbclid=IwAR18uMQ907jKqUec7dDAjtl6l62iUeYZ9 RyAgWeLAjlQKkTfmKqN9ZDR6kQ [ Links ]
13. Kritski A, Alves D, Wenerck G, Zimmermann I, Sanchez M, Galliez R, et al. Panorama da COVID-19 [Internet]. Rio de janeiro: Universidade Federal do Rio de Janeiro; 2020 [citado 2020 abr 11]. Disponível em: https://ufrj.br/sites/default/files/img-noticia/2020/03/notatecnica25032020.pdf [ Links ]
14. Kamel Boulos MN, Geraghty EM. Geographical tracking and mapping of coronavirus disease COVID-19/severe acute respiratory syndrome coronavirus 2 (SARS-CoV-2) epidemic and associated events around the world: how 21st century GIS technologies are supporting the global fight against outbreaks and epidemics. Int J Health Geogr [Internet]. 2020 Mar [cited 2020 Apr 30];19(1):8. Available from: https://doi.org/10.1186/s12942-020-00202-8 [ Links ]
15. Prefeitura da Cidade do Rio de Janeiro. Instituto Pereira Passos. Data Rio [Internet]. Rio de Janeiro: Prefeitura da Cidade do Rio de Janeiro; 2020 [citado 2020 abr 24]. Disponível em: http://www.data.rio/search?groupIds=0f4009068ec74e17b25eb3e70891b95f&sort=-modified [ Links ]
16. Governo do Estado do Rio de Janeiro. Secretaria de Estado de Saúde. Plano de resposta de emergência ao Coronavírus no Estado do Rio de Janeiro [Internet]. Rio de Janeiro: Governo do Estado do Rio de Janeiro; 2020 [citado 2020 abr 11]. Disponível em: https://portalarquivos.saude.gov.br/images/pdf/2020/fevereiro/13/PLANO-DE-CONTINGENCIA-novo-coronavirus-RIO-DE-JANEIRO-EM-REVIS--O.pdf [ Links ]
17. Anselin L. GeoDa: an introduction to spatial data analysis [Internet]. Chicago: GeodaCenter; 2018 [cited 2018 Apr 24].Available from: https://geodacenter.github.io/workbook/3b_rates/lab3b.html#excess-risk [ Links ]
18. Croda J, Oliveira WK, Frutuoso RL, Mandetta LH, Baia-da-Silva DC, Brito-Sousa JD, et al. COVID-19 in Brazil: advantages of a socialized unified health system and preparation to contain cases. J Brazilian Soc Trop Med [Internet]. 2020 Apr [cited 2020 Apr 12];53:e20200167. Available from: https://doi.org/10.1590/0037-8682-0167-2020 [ Links ]
19. Candido DDS, Watts A, Abade L, Kraemer MUG, Pybus OG, Croda J, et al. Routes for COVID-19 importation in Brazil. J Travel Med [Internet]. 2020 Mar [cited 2020 Apr 30]. Available from: https://doi.org/10.1093/jtm/taaa042 [ Links ]
20. Ministério da Saúde (BR). Fundação Oswaldo Cruz. Fundação Getúlio Vargas. Núcleo de Métodos Analíticos para Vigilância em Epidemiologia. Relatórios técnicos - COVID-19 - boletins estaduais [Internet]. Brasília: Ministério da Saúde; 2020 [citado 2020 abr 13]. Disponível em: https://gitlab.procc.fiocruz.br/mave/repo/blob/master/Relatórios técnicos-COVID-19/relatório técnico3-boletinsestaduais/boletim_estadualRJ.pdf [ Links ]
21. Lana RM, Coelho FC, Gomes MFC, Cruz OG, Bastos LS, Villela DAM, et al. Emergência do novo coronavírus (SARS-CoV-2) e o papel de uma vigilância nacional em saúde oportuna e efetiva. Cad Saúde Pública [Internet]. 2020 mar [citado 2020 abr 30];36(3):e00019620. Disponível em: http://dx.doi.org/10.1590/0102-311x00019620 [ Links ]
22. Schmidt S. Coronavírus: das 106 mortes no estado, seis são em favelas do Rio. Jornal O Globo [Internet]. 2020 abr [citado 2020 abr 12]. Disponível em: https://oglobo.globo.com/rio/coronavirus-das-106-mortes-no-estado-seis-sao-em-favelas-do-rio-24360191 [ Links ]
Associate editor: Bárbara Reis Santos – orcid.org/0000-0001-6952-0352
Received: April 20, 2020; Accepted: April 29, 2020
 This is an Open Access article distributed under the terms of the Creative Commons Attribution Non-Commercial License, which permits unrestricted non-commercial use, distribution, and reproduction in any medium, provided the original work is properly cited.
