


Serviços Personalizados
Journal

Artigo
 texto em
  Inglês (pdf)
 Artigo em XML
 Referências do artigo
 Enviar este artigo por email
Indicadores
-
 Citado por SciELO
Links relacionados
-
 Similares em
SciELO
Similares em
SciELO
Compartilhar

 Permalink
Epidemiologia e Serviços de Saúde
versão impressa ISSN 1679-4974versão On-line ISSN 2237-9622
Epidemiol. Serv. Saúde vol.29 no.4 Brasília 2020 Epub 05-Ago-2020
http://dx.doi.org/10.5123/s1679-49742020000400010
Original article
COVID-19 in Brazil: evolution of the epidemic up until epidemiological week 20 of 2020
1Universidade do Estado do Rio de Janeiro, Instituto Medicina Social, Rio de Janeiro, RJ, Brazil
2Ministério da Saúde, Secretaria de Vigilância em Saúde, Brasília, DF, Brazil
Methods
this is an ecological study based on data and official documents from the Brazilian Ministry of Health and international organizations; comparisons were made between Brazil and other countries and incidence and mortality rates were calculated.
Results
by the end of epidemiological week 20, 233,142 cases, and 15,633 deaths had been confirmed for Brazil as a whole and 3,240 (58.2%) of the country’s municipalities had reported at least one case; Brazil was at an earlier phase of the pandemic when compared to other countries, except Russia and Turkey, regarding cumulative cases, and except Canada regarding cumulative deaths; the highest rates were found in Brazil’s Northern Region states, where Amazonas state had the highest incidence rates(4,474.6/1,000,000) and mortality rates (331.8/1,000,000).
Conclusion
Brazil is one of the countries with the highest number of confirmed cases and deaths, with marked regional differences.
Key words: Coronavirus Infections; Pandemics; Public Health Surveillance; Epidemiology; Brazil
Introduction
In December 2019, the city of Wuhan, located in Hubei Province, in China, experienced an outbreak of pneumonia with an unknown cause.1 In January 2020, Chinese researchers identified a novel coronavirus (SARS-CoV-2) as the etiological agent of a severe acute respiratory syndrome, named Coronavirus Disease 2019, or just COVID-19.3
At the beginning of the outbreak, all cases were related to a seafood and live animal market in Wuhan.5In the first 30 days, China recorded 11,821 cases and 259 deaths. Still in January, the disease was recorded in other countries in Asia, Europe and North America.6 On January 30th 2020, the World Health Organization (WHO) declared a Public Health Emergency of International Concern. In a scenario with more than 110,000 cases distributed over 114 countries, WHO declared pandemic status on March 11th 2020.8
People with COVID-19 can present coughing, breathing difficulty, sore throat, fever and other clinical manifestations. There are also asymptomatic cases, which are epidemiologically important as they are potential transmitters.9 SARS-CoV-2 has a high basic reproductive number (R0) when compared to other coronaviruses and reached 6.49 in Hubei Province.10
The experience of China showed that non-pharmaceutical interventions, which include several forms of social distancing, ranging from case and contact isolation to lockdown, can contain the epidemic.11 However, the applicability of these strategies is not the same in each country. Difficulties in adopting these measures may help to explain why globally 4,425,485 cases of COVID-19 and 302,059 deaths had been recorded as at May 16th 2020, with the Americas being the most affected continent, followed by Europe.12
In Brazil the first cases were confirmed in February and a variety of actions were implemented with the aim of containing and mitigating the advance of the disease. On February 3rd 2020, Brazil declared a Public Health Emergency of National Concern,13 even before the first case had been confirmed. The Brazilian Ministry of Health has been consolidating data on COVID-19 cases and deaths collected and provided by the State Health Departments since the beginning of the pandemic. This enables knowledge of the dynamics of the disease in the country and, consequently, the establishment of policies to slow down the increase in case numbers.
The objective of this study was to describe the evolution of COVID-19 in Brazil up until epidemiological week (EW) 20. This evolution was compared between the ten countries with the highest number of COVID-19 cases notified as at that week. A comparison was also made between the Brazilian Federative Units (UFs).
Methods
This is a descriptive ecological study. Its units of analysis were Brazil, the Brazilian macro-regions and UFs, as well as a further nine countries with the highest numbers of confirmed cases (United States, Russia, United Kingdom, Spain, Italy, Germany, Turkey, France and Iran) and nine countries with the highest numbers of confirmed COVID-19 deaths (United States, United Kingdom, Italy, France, Spain, Belgium, Germany, Iran and Canada) as at May 16th 2020, the last day of EW 20.
Brazil has 5,570 municipalities divided over 27 UFs, and these are grouped into five geographical macro-regions (Midwest, Northeast, North, Southeast and South) all of which have very different sociodemographic and health characteristics from each other.14
The epidemiological situation was obtained based on the period between February 26th, the date on which Brazil’s first case was confirmed, and May 16th (date of data retrieval). We used confirmed COVID-19 case and death data by place of residence and aggregated for Brazil as a whole, by geographic macro-region and UF, provided in grouped and non-nominal format by the public domain Ministry of Health COVID-19 Panel. Epidemiological reports provided by WHO and the Johns Hopkins University were used for comparison with the global situation.12
Regarding the number of confirmed COVID-19 cases in Brazil, it is important to highlight that the Ministry of Health has used different case definitions during the pandemic, namely:
January and February 2020 (released on January 23rd 2020): an individual with conclusive laboratory-confirmed COVID-19, regardless of signs and symptoms; even if the result were positive, health surveillance was to investigate whether the individual had been abroad in the last 14 days or had had contact with someone who had traveled internationally.16
March 2020 (released on March 4th 2020): after community transmission had been decreed in Brazil, the definition changed so as to also include the clinical-epidemiological criterion, in addition to the laboratory criterion: suspected or probable case with a history of close or household contact with a laboratory-confirmed COVID-19 case, presenting fever or at least one of the respiratory signs or symptoms, in the last 14 days following contact, and for which it was not possible to perform specific laboratory investigation.16
April and May 2020 (released on April 3rd 2020): the case definition adopted with effect from April considers that confirmed cases are individuals with laboratory-confirmed SARS-CoV-2, regardless of signs and symptoms, or SARS-CoV-2 confirmed by clinical-epidemiological criterion, when the individual has a history of close or household contact, in the seven days prior to onset of symptoms, with a laboratory-confirmed case, for which it was not possible to perform a laboratory test.14
Graphs were prepared of cumulative cases and deaths for the ten countries and for ten Brazilian UFs with the highest number of cases as at May 16th 2020, starting from confirmation of the 50th case or death, with the aim of describing in which phase of the epidemic Brazil and its UFs are and how the epidemic curves are behaving in each place. A histogram was also prepared of the number of cumulative cases in Brazil superimposed on a timeline, with the aim of showing the history of the pandemic, as well as facts relevant for national preparation in response to the emergency situation. The WHO website, specialized literature and official documents provided by the Brazilian Ministry of Health were consulted in order to obtain these historic facts.4
Finally, incidence rates and mortality rates were calculated for the countries and for Brazil, by macro-region and UF, obtained by dividing the number of cases and deaths, respectively, by the resident population and multiplying by 1 million. This multiplication factor was used to enable national and international comparisons. The population estimates used as global denominators were produced by the World Bank21 and the Brazilian population estimates were produced by the Brazilian Institute of Geography and Statistics (IBGE) for the Federal Audit Court (TCU), and refer to the year 2019.14 In order to calculate the rate by EW, the cumulative numbers of cases and deaths as at the last day of each week were considered.
Microsoft Excel and R 3.5.3 were used to treat and analyze the data and create graphs.
Results
Between December 31st 2019 and May 16th 2020, 4,425,485 confirmed COVID-19 cases and 302,059 confirmed COVID-19 deaths were recorded in 216 countries and territories. On May 16th 2020, the United States had the highest number of cases (1,443,397; 4,380.1 per 1 million inhab.), followed by Russia (262,843; 1,820.6 per 1 million inhab.), United Kingdom (236,711; 3,540.6 per 1 million inhab.) and Brazil (233,142; 1,109.4 per 1 million inhab.). On that date, Brazil was in 4th place in absolute numbers of confirmed cases, and in 6th place for confirmed deaths. The highest number of deaths were found in the United States (89,562; 271.8 deaths per 1 million inhab.), followed by the United Kingdom (34,636; 518.1 deaths per 1 million inhab.) e and Italy (31,908; 528.8 deaths per 1 million inhab.) (Figures 1A and 1B)
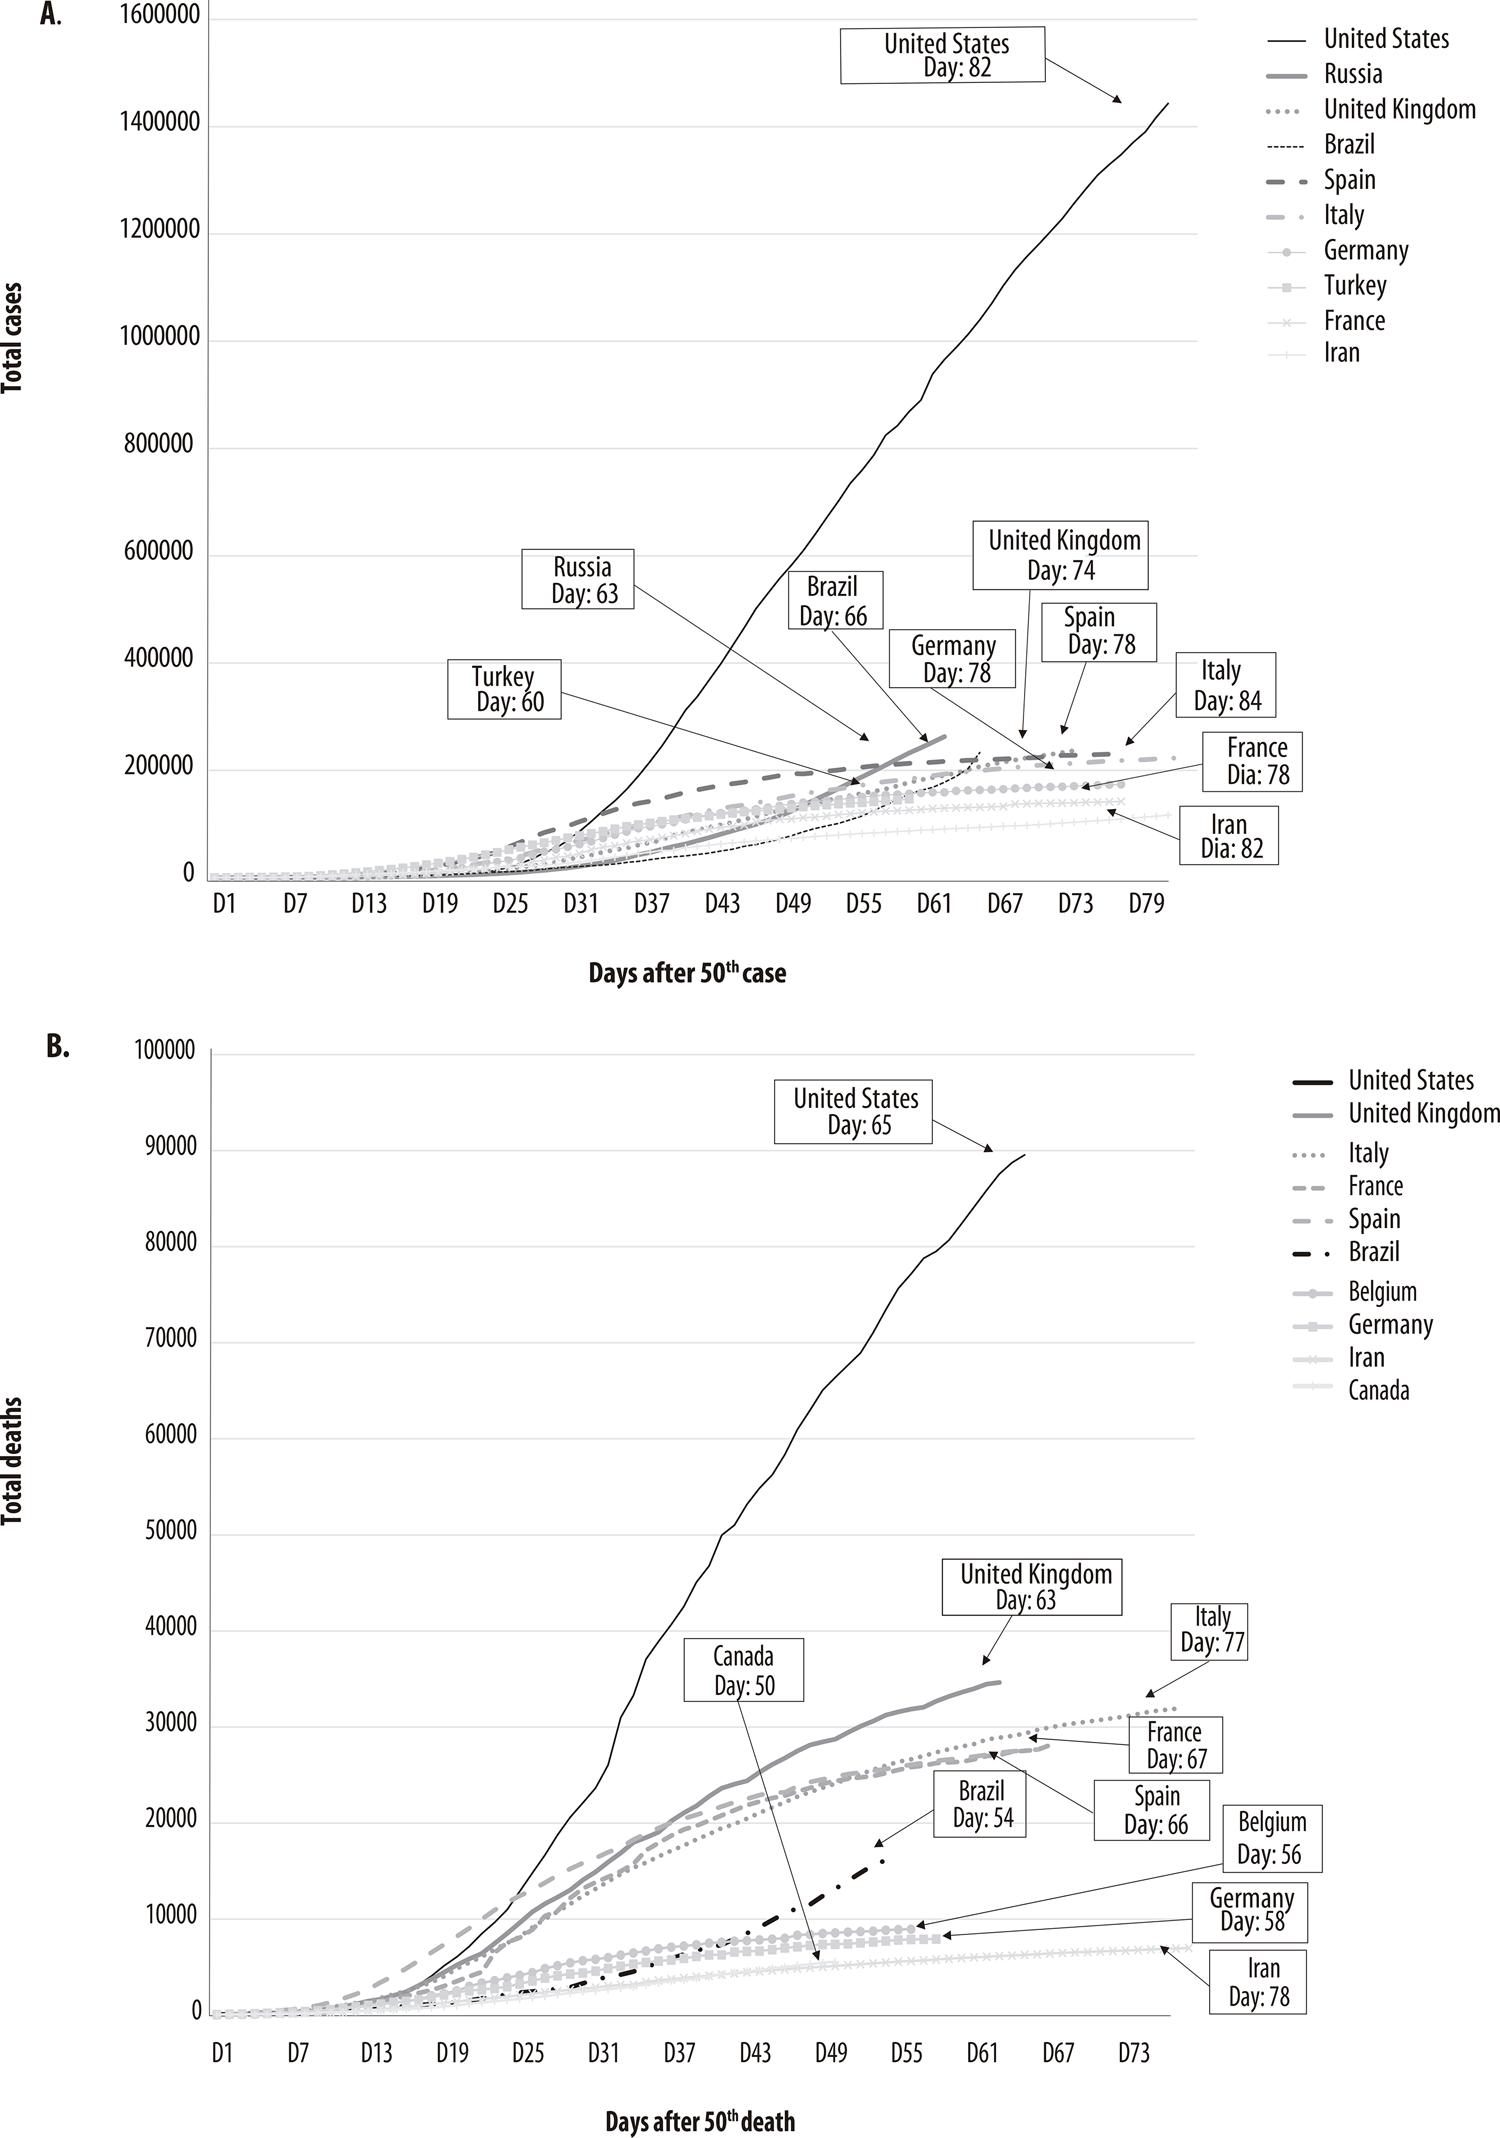
Figure 1 – Number of cumulative cases with effect from the 50th confirmed COVID-19 case (A) and cumulative deaths with effect from the 50th confirmed COVID-19 death (B), in the ten countries with the highest number of cases and death as at May 16th 2020
When comparing the curves of the ten countries with the largest number of cumulative cases after the 50th case, Brazil was found (at day 66) to be at an earlier stage of the pandemic when compared to the other countries, except Russia (day 63) and Turkey (day 60). With regard to the curves for daily cumulative deaths after the 50th death, Brazil was once again at an earlier stage (day 54) in the pandemic when compared to the other countries, except Canada (day 50). In both graphs, Brazil’s curves behave differently, showing increases in cases and deaths at different stages of the curve in comparison to the other countries (Figures 1A and 1B).
On February 26th Brazil’s first imported case was confirmed in the state of São Paulo: a 61-year-old male Brazilian who had returned from Italy. By March 22nd, 25 days after the first COVID-19 case was confirmed in Brazil, all the UFs had confirmed cases of the disease. Fifty-six days after the thousandth case, the number of cases had increased more than 200 times, reaching 233,142 cases at the end of EW 20. The first death was recorded on March 17th, 20 days after confirmation of the first case, also in the state of São Paulo, and once again it was an elderly man, although he had not traveled abroad. The state of Tocantins was the last to record its first death from the disease, 29 days after confirmation of the first death in Brazil. On March 20th, Brazil decreed community transmission throughout the entire national territory (Figure 2).
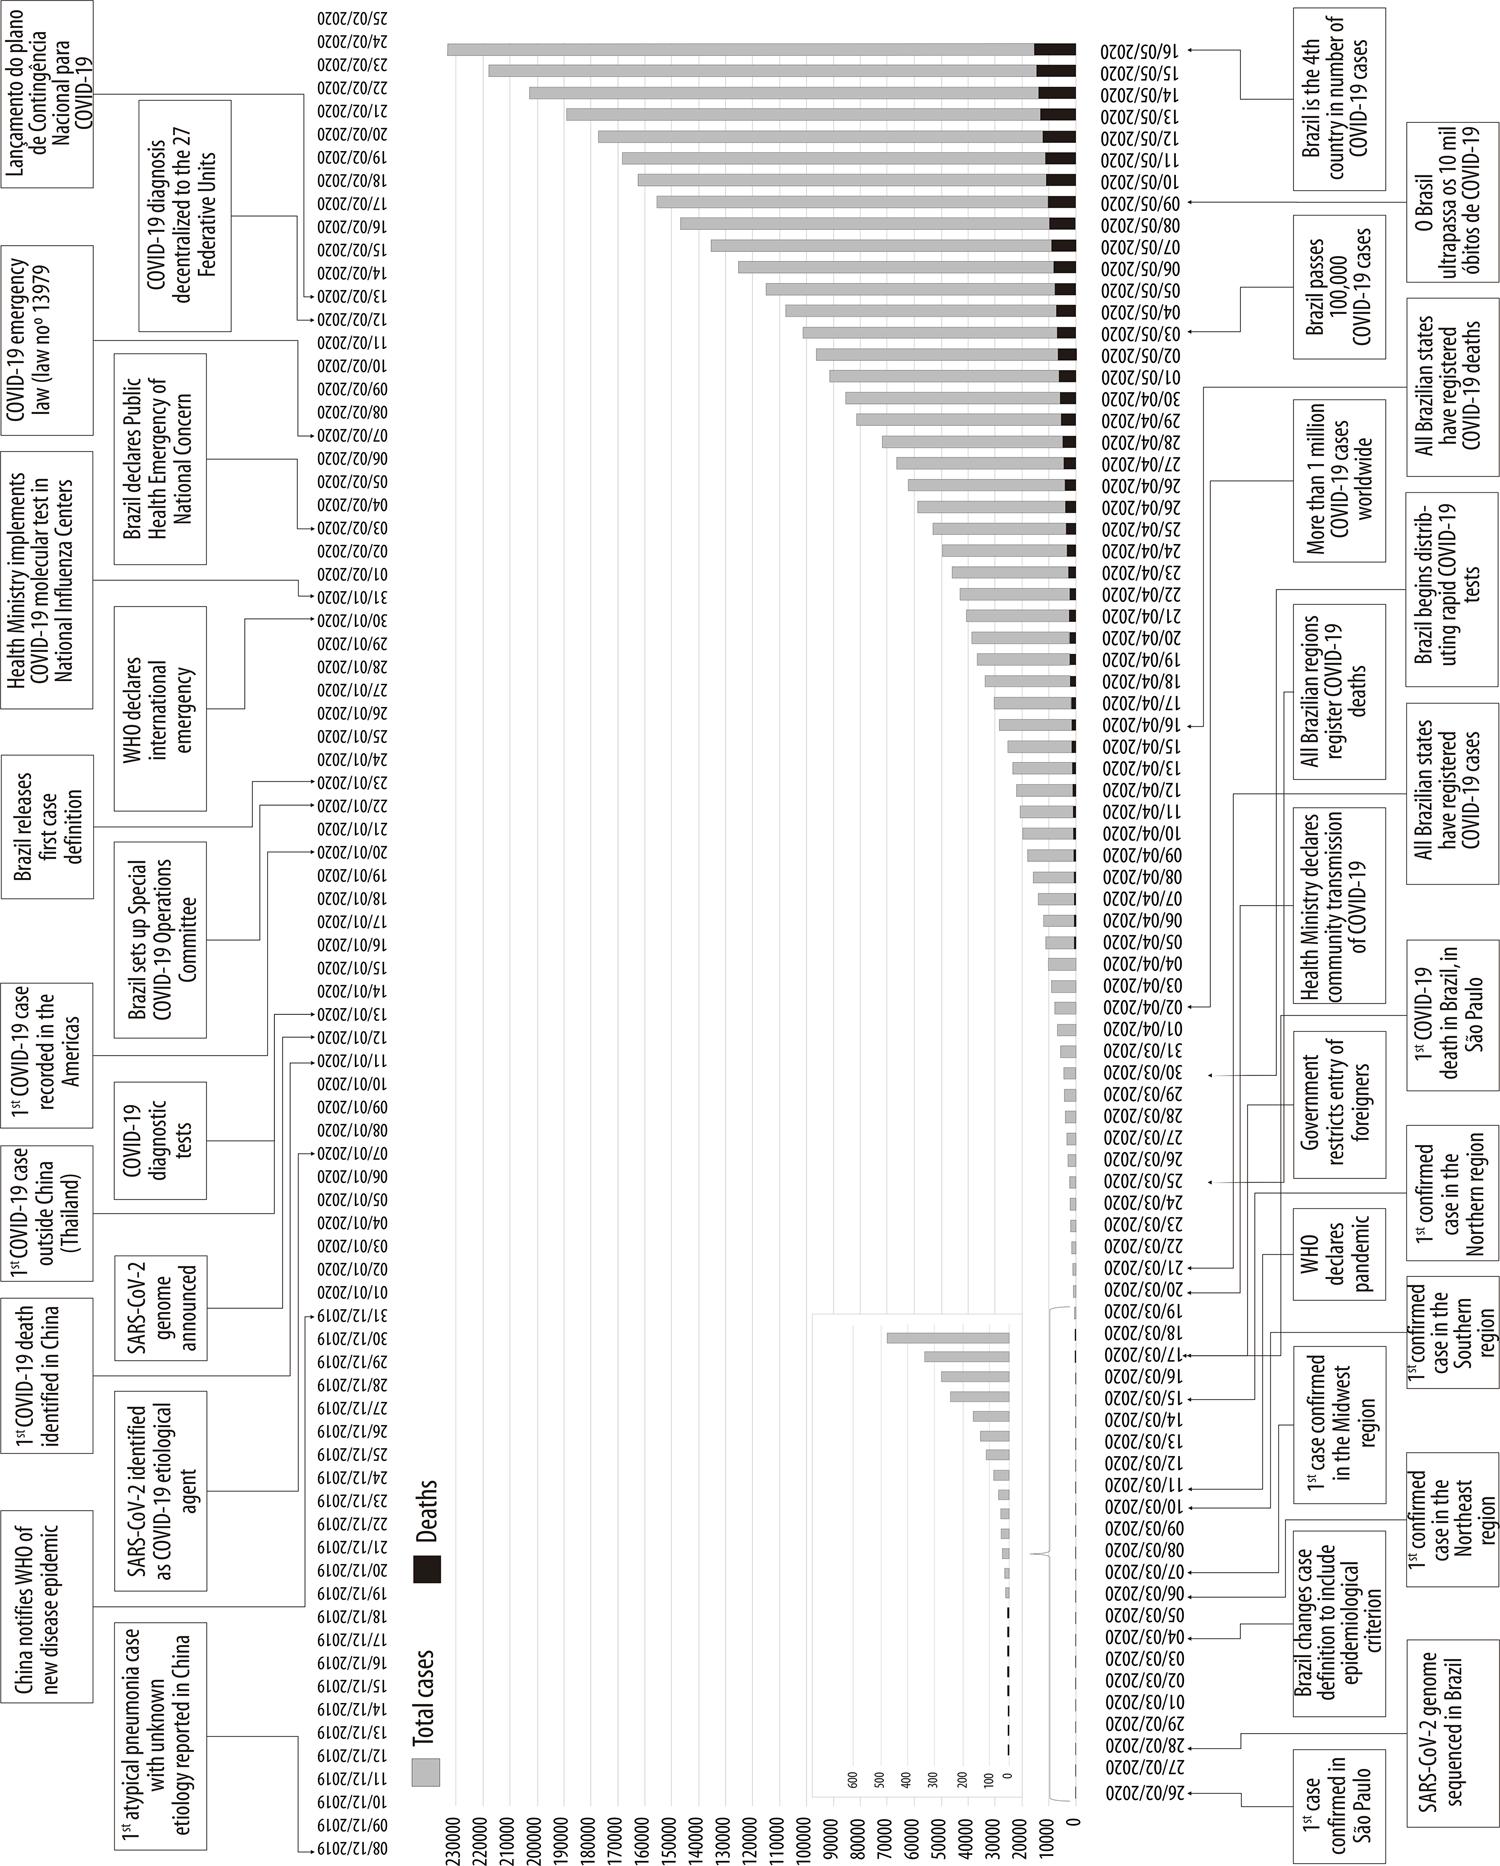
Figure 2 – Histogram of cumulative COVID-19 cases and timeline of main events, Brazil, December 8th 2019 to May 16th 2020
By the end of EW 20, Brazil had recorded 233,142 cases and 15,633 deaths. The Northern region had the highest incidence rates (2,358.3/1 million) and the highest mortality rates (156.6/1 million). The Northern region incidence rate overtook that of the Southeastern region after EW 16 (Figure 3A). The Northeastern region also ended the 20th EW with an incidence rate above the national rate. The Northern region also had the highest mortality rates with effect from the 18th EW, followed by the Southeastern and Northeastern regions, also with rates above the national rate (Figure 3B).
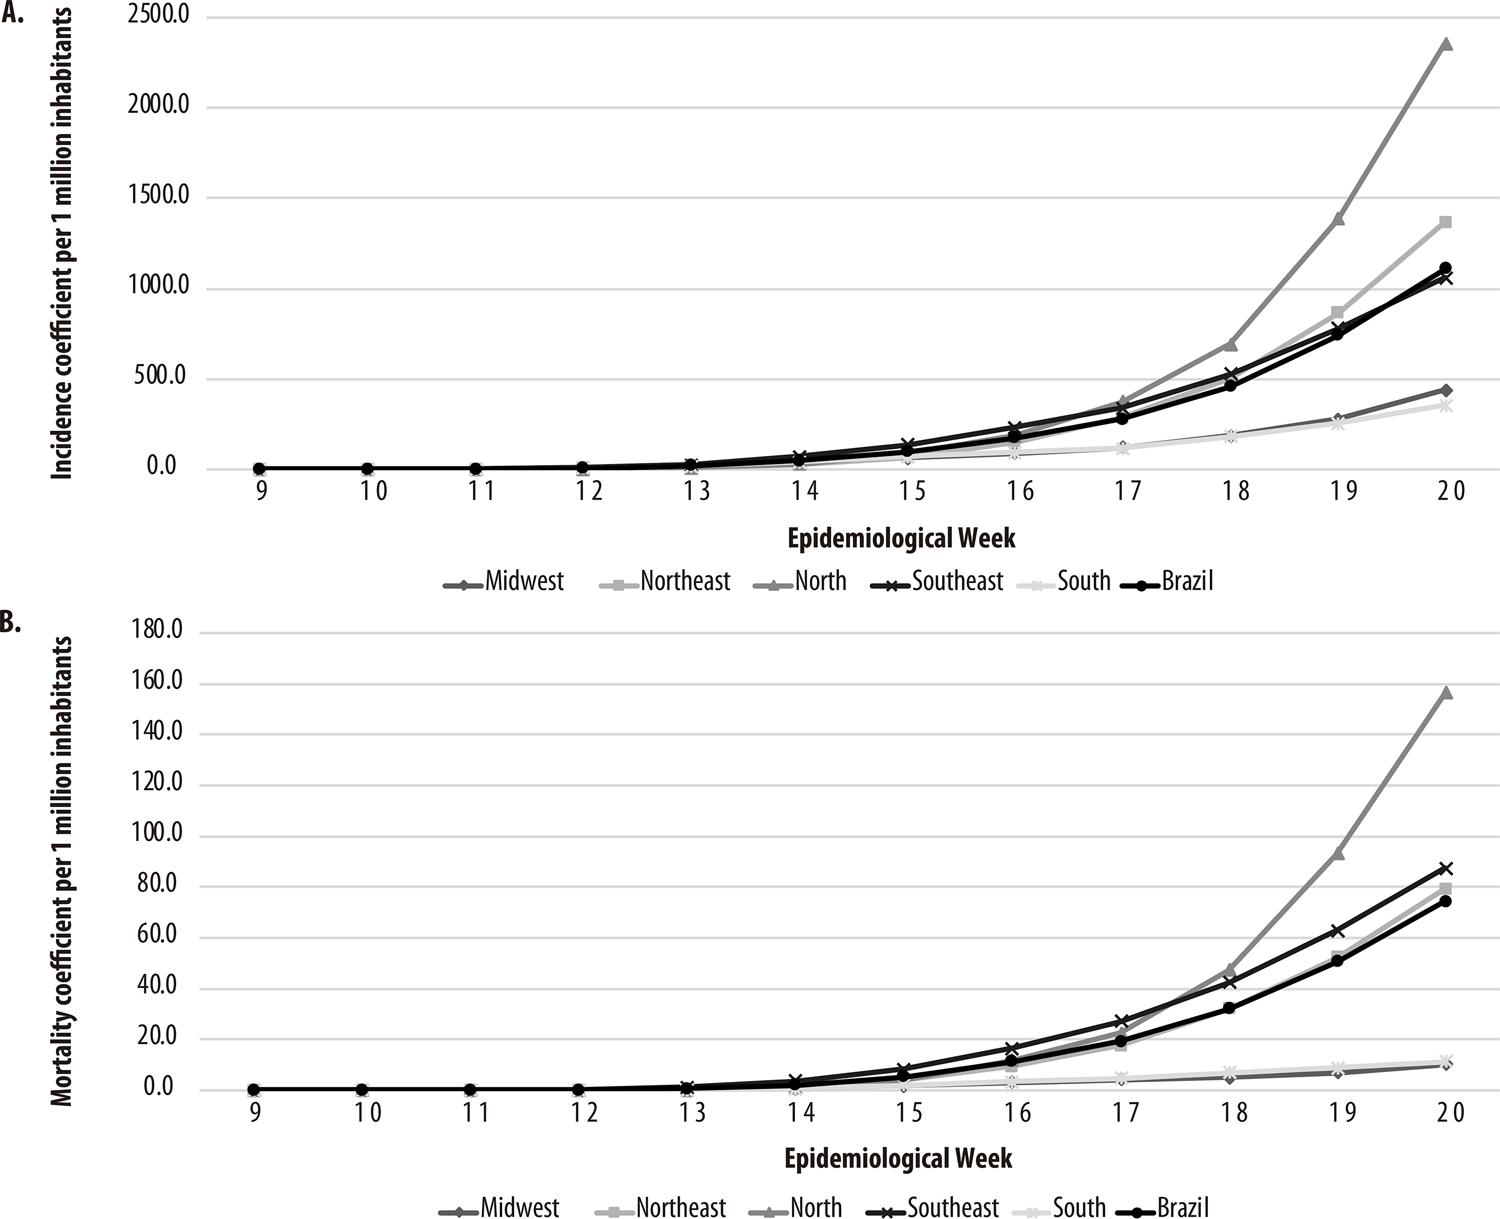
Figure 3 – COVID-19 incidence rates (A) and mortality rates (B) between epidemiological weeks 9 and 20, 2020, Brazil and macro-regions
Among the UFs, Amazonas had the highest incidence rate (4,747.6/1 million), followed by Amapá (4,533.4/1 million) and Roraima (2,816.3/1 million). Amazonas also had the highest mortality rate (331.8/1 million), followed by Ceará (176.7/1 million) and Pernambuco (152.9/1 million). Although São Paulo had the highest absolute number of confirmed cases and deaths, it had the 12th highest incidence rate (1,332.4/1 million) and the 7th highest mortality rate (102.1/1 million) (Table 1).
Table 1 – COVID-19 Indicators, Brazil, macro-regions and Federative Units as at Epidemiological Week 20/2020
| Region/ Federative Unit | Cases No | Deaths No | Incidence ratea | Mortality ratea | Number of days after first case | Number of days after first death | Total municipalities No | Municipalities with confirmed cases | Municipalities with confirmed deaths | ||
|---|---|---|---|---|---|---|---|---|---|---|---|
| No | % | No | % | ||||||||
| North | 43,466 | 2,886 | 2,358.3 | 156.6 | 63 | 53 | 450 | 338 | 75.1 | 177 | 39.3 |
| Rondônia | 1,919 | 69 | 1,079.8 | 38.8 | 58 | 47 | 52 | 34 | 65.4 | 9 | 17.3 |
| Acre | 1,867 | 59 | 2,116.9 | 66.9 | 59 | 40 | 22 | 19 | 86.4 | 5 | 22.7 |
| Amazonas | 19,677 | 1,375 | 4,747.6 | 331.8 | 63 | 53 | 62 | 60 | 96.8 | 44 | 71.0 |
| Roraima | 1,706 | 49 | 2,816.3 | 80.9 | 56 | 43 | 15 | 15 | 100.0 | 6 | 40.0 |
| Pará | 13,184 | 1,199 | 1,532.5 | 139.4 | 59 | 46 | 144 | 138 | 95.8 | 86 | 59.7 |
| Amapá | 3,834 | 108 | 4,533.4 | 127.7 | 58 | 43 | 16 | 16 | 100.0 | 12 | 75.0 |
| Tocantins | 1,279 | 27 | 813.2 | 17.2 | 59 | 32 | 139 | 56 | 40.3 | 15 | 10.8 |
| Northeast | 78,069 | 4,521 | 1,367.9 | 79.2 | 72 | 53 | 1,794 | 1,223 | 68.2 | 476 | 26.5 |
| Maranhão | 11,592 | 524 | 1,638.4 | 74.1 | 57 | 48 | 217 | 183 | 84.3 | 49 | 22.6 |
| Piauí | 2,085 | 65 | 637.0 | 19.9 | 58 | 50 | 224 | 105 | 46.9 | 28 | 12.5 |
| Ceará | 23,795 | 1,614 | 2,605.7 | 176.7 | 61 | 52 | 184 | 175 | 95.1 | 109 | 59.2 |
| Rio Grande do Norte | 3,004 | 136 | 856.6 | 38.8 | 65 | 49 | 167 | 110 | 65.9 | 35 | 21.0 |
| Paraíba | 4,063 | 183 | 1,011.2 | 45.5 | 59 | 46 | 223 | 135 | 60.5 | 35 | 15.7 |
| Pernambuco | 18,488 | 1,461 | 1,934.5 | 152.9 | 66 | 53 | 185 | 161 | 87.0 | 109 | 58.9 |
| Alagoas | 3,593 | 199 | 1,076.6 | 59.6 | 70 | 47 | 102 | 82 | 80.4 | 39 | 38.2 |
| Sergipe | 3,135 | 53 | 1,363.8 | 23.1 | 63 | 45 | 75 | 63 | 84.0 | 25 | 33.3 |
| Bahia | 8,314 | 286 | 559.0 | 19.2 | 72 | 49 | 417 | 209 | 50.1 | 47 | 11.3 |
| Southeast | 93,853 | 7,723 | 1,062.0 | 87.4 | 81 | 61 | 1,668 | 936 | 56.1 | 372 | 22.3 |
| Minas Gerais | 4,474 | 150 | 211.3 | 7.1 | 70 | 48 | 853 | 317 | 37.2 | 71 | 8.3 |
| Espírito Santo | 6,595 | 271 | 1,641.1 | 67.4 | 72 | 45 | 78 | 70 | 89.7 | 31 | 39.7 |
| Rio de Janeiro | 21,601 | 2,614 | 1,251.1 | 151.4 | 73 | 59 | 92 | 89 | 96.7 | 58 | 63.0 |
| São Paulo | 61,183 | 4,688 | 1,332.4 | 102.1 | 81 | 61 | 645 | 460 | 71.3 | 212 | 32.9 |
| South | 10,615 | 336 | 354.1 | 11.2 | 68 | 53 | 1,191 | 566 | 47.5 | 142 | 11.9 |
| Paraná | 2,242 | 123 | 196.1 | 10.8 | 66 | 51 | 399 | 176 | 44.1 | 46 | 11.5 |
| Santa Catarina | 4,678 | 81 | 652.9 | 11.3 | 65 | 52 | 295 | 167 | 56.6 | 40 | 13.6 |
| Rio Grande do Sul | 3,695 | 132 | 324.8 | 11.6 | 68 | 53 | 497 | 223 | 44.9 | 56 | 11.3 |
| Midwest | 7,139 | 167 | 438.1 | 10.2 | 71 | 52 | 467 | 177 | 37.9 | 49 | 10.5 |
| Mato Grosso do Sul | 508 | 15 | 182.8 | 5.4 | 62 | 47 | 79 | 36 | 45.6 | 7 | 8.9 |
| Mato Grosso | 851 | 27 | 244.2 | 7.7 | 58 | 44 | 141 | 58 | 41.1 | 14 | 9.9 |
| Goiás | 1,640 | 69 | 233.7 | 9.8 | 65 | 52 | 246 | 82 | 33.3 | 27 | 11.0 |
| Distrito Federal | 4,140 | 56 | 1,373.0 | 18.6 | 71 | 49 | 1 | 1 | 100.0 | 1 | 100.0 |
| Brazil | 233,142 | 15,633 | 1,109.4 | 74.4 | 81 | 61 | 5,570 | 3,240 | 58.2 | 1,216 | 21.8 |
a) Rates per 1 million inhabitants, calculated according to Federal Audit Court (TCU) projection, 2019.
By the end of the 20th EW, 3,240 municipalities (58.2% of total Brazilian municipalities) had at least one confirmed COVID-19 case, with the Northern region having the highest percentage of affected municipalities (75.1% of the region’s 450 municipalities). Among the UFs, the highest percentages were recorded in Amazonas (96.8% of its 60 municipalities), Rio de Janeiro (96.7% of its 92 municipalities) and Pará (95.8% of its 144 municipalities). With regard to deaths, 1,216 municipalities (21.8% of total Brazilian municipalities) had at least one death, with the highest percentage in the Northern region (39.3% of its 450 municipalities). Among the UFs, the highest percentages were recorded in Amapá (75%), Amazonas (71%) and Rio de Janeiro (63%) (Table 1).
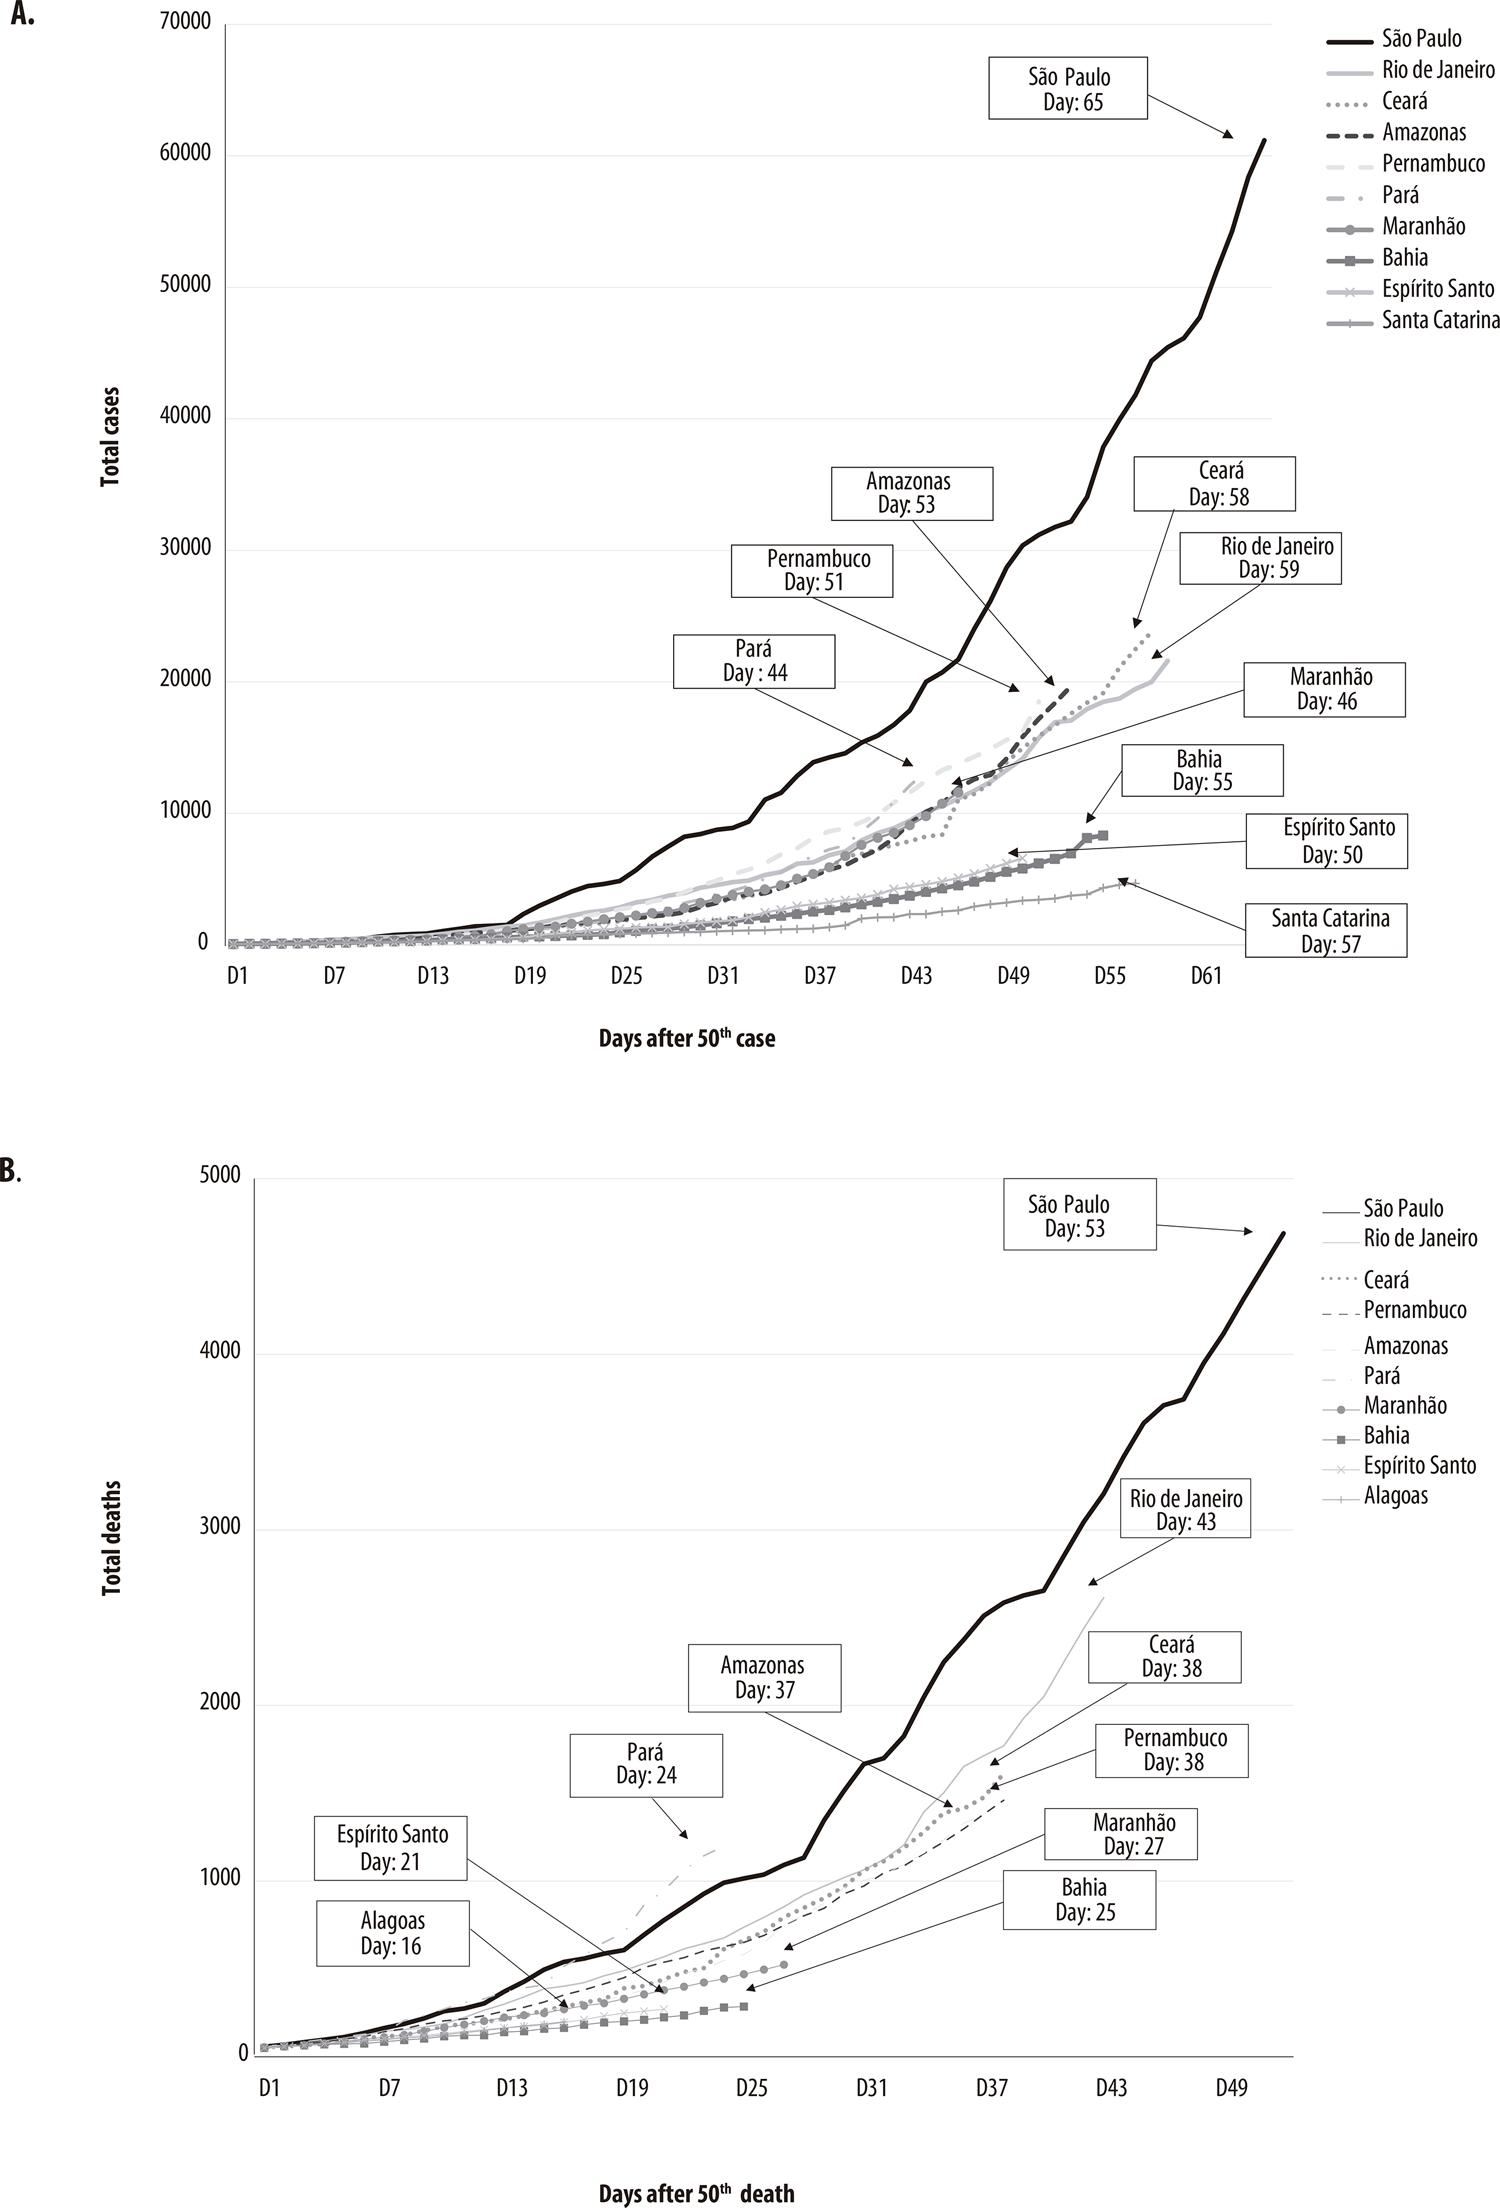
When comparing the curves of the Brazilian UFs with the highest number of cumulative cases after the 50th case, the states of Amazonas (day 53), Pernambuco (day 51), Espírito Santo (day 50), Maranhão (day 46) and Pará (day 44) were found to be at an earlier stage of the epidemic when compared to the states of São Paulo (day 65), Rio de Janeiro (day 59), Ceará (day 58), Santa Catarina (day 57) and Bahia (day 55). With regard to the curves for daily cumulative deaths after the 50th death, the states of Maranhão (day 27), Bahia (day 25), Pará (day 24), Espírito Santo (day 21) and Alagoas (day 16) were found to be at an earlier stage when compared to the states of São Paulo (day 53), Rio de Janeiro (day 43), Ceará (day 38), Pernambuco (day 38) and Amazonas (day 37) (Figures 4A and 4B).
Discussion
As at EW 20/2020, Brazil was at an earlier stage in the course of the COVID-19 epidemic, when compared to the other countries with the highest numbers of confirmed cases of the disease. Mitigation measures will be decisive for the country to have a favorable evolution of the epidemiological situation, with deceleration in the increase of cases and deaths.
Although Brazil was the first South American country to have a confirmed COVID-19 case, this happened several weeks later than in the majority of northern hemisphere countries.4For example, considering the number of days with effect from the 50th confirmed case or death in each country, Brazil is 16 days behind the United States in relation to cases and 11 days behind in relation to deaths. This is a measurement that has been used to enable a more reliable comparison of the situation of the pandemic in each country, considering the stage each one is at.
Brazil also has a territorial extension much larger than countries such as Spain, Italy, France, Germany and the United Kingdom, which hinders comparisons even more, since territorial dimension has direct influence on the spread of the disease. It was only on March 22nd, almost one month after the first case was confirmed in the state of São Paulo, that the state of Roraima confirmed its first COVID-19 case, being the last Brazilian state to confirm circulation of SARS-CoV-2.
Although the highest absolute number of cases was concentrated in the Southeast region, the country’s Northern region had the highest COVID-19 incidence rate as at EW 20. In the Northern region there were reports of diverse impediments to the population adhering to social isolation recommended by the health authorities.22 Another reason that may explain this result is that the Northern region’s hospital network is smaller when compared to the country’s other regions, with a lower number of hospital beds, which in the long term is incapable of meeting demand, both in the public and the private sector.23 The state of Amazonas, which had the highest incidence and mortality rates, reported health system collapse and funeral system crisis.24
In relation to the percentage of municipalities with COVID-19 cases in each UF, the state of Rio de Janeiro draws attention by having 89 of its 92 municipalities affected. It is a state with a small territorial extension, an extensive highway network and large circulation of people, enabling a considerable number of individuals to cross the state in a matter of hours. This high dispersion of people led the health authorities to adopt more restrictive measures, impeding the circulation of individuals between the municipalities and in 11 districts of the state capital.26
The case and death curves of the ten UFs with the highest number of cases, with effect from the 50th case or 50th death, show that the state of São Paulo is at a more advanced stage of the epidemic when compared to the other UFs. It is important to assess the effects of the measures applied by the state to combat the epidemic, considering that the experience gained can point the way for decisions to be taken by the other UFs, while not forgetting that the effect of the measures taken has a direct relationship with the characteristics of the place. Information about the population age structure, the percentage of people in situations of vulnerability, population mobility and access to health services are factors that need to be taken into account when making local decisions.
Certain limitations need to be taken into consideration when interpreting the data presented in this study. Underreporting of cases and deaths, both worldwide and in Brazil, implies that the indicators calculated are underestimated. In the majority of countries, as in Brazil, it has not yet been possible to estimate the magnitude of underreporting and its impact on estimates presented. However, there is a series of initiatives underway in Brazil for modeling underreporting, based on considerably robust assumptions. In addition, it is hoped that seroprevalence studies underway in Brazil can provide reliable estimates of the population already infected with SARS-CoV-2.
The changes in case definition for notifying and confirming COVID-19 in Brazil may also have altered identification of suspected cases and, consequently, final case classification. Studies that enable the sensitivity and specificity of these definitions to be known over time are needed, given that they would allow correction of the estimates and greater understanding of the true situation of the epidemic in the country.
The population levels for 2019 used to calculate the rates are estimates projected based on the 2000 and 2010 censuses, and may suffer alterations after the next census has been conducted. Given that the 2020 Demographic Census has been postponed and that population estimates for 2020 have not yet been released by IBGE, it is important to stress that the incidence and mortality rates may be overestimated, considering that an annual increase of the resident population is expected due to population growth.
It was not possible to standardize the incidence and mortality rates, given that case and death distribution by age range and sex in Brazil is not publicly available, thus making application of the direct method impossible. Moreover, there is no reference population for indirect standardization of the rates. We emphasize that incidence rates are directly influenced by the testing strategies adopted in each country and UF, whereas the mortality and lethality rates available thus far vary considerably between countries. As such, arbitrarily adopting one country as a reference could bias the true rates and lead to an erroneous interpretation of the estimates.
Finally, the results presented here show that Brazil is at an earlier stage of the epidemic when compared to other countries in the world, although it has high incidence and mortality rates when analyzing its macro-regional and state subdivisions. New studies are needed to monitor the behavior of the disease in the national territory in the long term, as well as the creation and implementation of emergency plans for municipalities that have not yet recorded cases and deaths. Local, social and demographic characteristics need to be taken into consideration in the strategies in response to the epidemic, given that Brazil has a large population distributed in a non-homogenous manner over its territory, with cultural and geographical differences that can influence adherence to non-pharmaceutical interventions, as well as having marked inequalities in social terms and in relation to access to health services.
Referências
1. Heymann DL, Shindo N, WHO Scientific and Technical Advisory Group for Infectious Hazards. COVID-19: what is next for public health? Lancet [Internet]. 2020 Feb [cited 2020 Apr 27];395(10224):542-5. Available from: https://doi.org/10.1016/s0140-6736(20)30374-3 [ Links ]
2. Kang D, Choi H, Kim J-H, Choi J. Spatial epidemic dynamics of the COVID-19 outbreak in China. Int J Infect Dis [Internet]. 2020 May [cited 2020 Apr 26];94:96-102. Available from: https://doi.org/10.1016/j.ijid.2020.03.076 [ Links ]
3. Cheng ZJ, Shan J. 2019 Novel coronavirus: where we are and what we know. Infection [Internet]. 2020 Apr [cited 2020 Apr 26];48(2):155-63. Available from: https://doi.org/10.1007/s15010-020-01401-y [ Links ]
4. World Health Organization - WHO. Novel coronavirus China: disease outbreak news [Internet]. Geneva: World Health Organization; 2020 [cited 2020 Apr 27]. Available from: https://www.who.int/csr/don/12-january-2020-novel-coronavirus-china/en/ [ Links ]
5. Bogoch II, Watts A, Thormas-Bachli A, Huber C, Kraemer MUG, Khan K. Pneumonia of unknown etiology in wuhan, China: potential for international spread via commercial air travel. J Travel Med [Internet]. 2020 Mar [cited 2020 Apr 27];27(2):taaa008. Available from: https://doi.org/10.1093/jtm/taaa008 [ Links ]
6. Wang W, Tang J, Wei F. Updated understanding of the outbreak of 2019 novel coronavirus (2019-nCoV) in Wuhan, China. J Med Virol [Internet]. 2020 Apr [cited 2020 Apr 27];92(4):441-7. Available from: https://dx.doi.org/10.1002%2Fjmv.25689 [ Links ]
7. World Health Organization - WHO. Coronavirus disease 2019 (COVID-19): situation report – 30 [Internet]. Geneva: World Health Organization; 2020 [cited 2020 Apr 27]. Available from: https://www.who.int/docs/default-source/coronaviruse/situation-reports/20200219-sitrep-30-covid-19.pdf?sfvrsn=3346b04f_2 [ Links ]
8. World Health Organization - WHO. WHO Director-Gernal’s opening remarks at the media briefing on COVID-19 [Internet]. Geneva: World Health Organization; 2020 [cited 2020 Apr 28]. Available from: https://www.who.int/dg/speeches/detail/who-director-general-s-opening-remarks-at-the-media-briefing-on-covid-19---11-march-2020 [ Links ]
9. The Novel Coronavirus Pneumonia Emergency Response Epidemiology Team. The epidemiological characteristics of an outbreak of 2019 novel coronavirus diseases (COVID-19). China CDC Weekly [Internet]. 2020 [cited 2020 Apr 28];2(8):113-22. Available from: http://weekly.chinacdc.cn/en/article/doi/10.46234/ccdcw2020.032 [ Links ]
10. Liu Y, Gayle AA, Wilder-Smith A, Rocklov J. The reproductive number of COVID-19 is higher compared to SARS coronavirus. J Travel Med [Internet]. 2020 Mar [cited 2020 Apr 27];27(2):taaa021. Available from: https://doi.org/10.1093/jtm/taaa021 [ Links ]
11. World Health Organization - WHO. Coronavirus disease 2019 (COVID-19): situation report – 44 [Internet]. Geneva: World Health Organization; 2020 [cited 2020 Apr 27]. Available from: https://www.who.int/docs/default-source/coronaviruse/situation-reports/20200304-sitrep-44-covid-19.pdf?sfvrsn=783b4c9d_2 [ Links ]
12. World Health Organization - WHO. Coronavirus disease 2019 (COVID-19): situation report – 118 [Internet]. Geneva: World Health Organization; 2020 [cited 2020 May 17]. Available from: https://www.who.int/docs/default-source/coronaviruse/situation-reports/20200517-covid-19-sitrep-118.pdf?sfvrsn=21c0dafe_10 [ Links ]
13. Brasil. Ministério da Saúde. Portaria MS/GM n. 188, de 3 de fevereiro de 2020. Declara Emergência em Saúde Pública de importância Nacional em decorrência da Infecção Humana pelo novo Coronavírus (2019-nCoV) [Internet]. Diário Oficial da União, Brasília (DF); 2020 fev 4 [citado 2020 Apr 27];Seção Extra:1. Disponível em http://www.planalto.gov.br/ccivil_03/portaria/prt188-20-ms.htm [ Links ]
14. Ministério da Saúde (BR). DATASUS: população residente - estimativas do TCU – Brasil [Internet]. Brasília: Ministério da Saúde; 2019 [citado 2020 abr 27]. Disponível em: http://tabnet.datasus.gov.br/cgi/deftohtm.exe?ibge/cnv/poptbr.def [ Links ]
15. Instituto Brasileiro de Geografia e Estatística - IBGE. Perfil dos municípios brasileiros: 2017 [Internet]. Rio de Janeiro: Instituto Brasileiro de Geografia e Estatística; 2017 [citado 2020 maio 18]. 106 p. Disponível em: https://agenciadenoticias.ibge.gov.br/media/com_mediaibge/arquivos/496bb4fbf305cca806aaa167aa4f6dc8.pdf [ Links ]
16. Ministério da Saúde (BR). Boletins Epidemiológicos da COVID-19 [Internet]. Brasília: Ministério da Saúde; 2020 [2020 abr 27]. Disponível em: https://www.saude.gov.br/boletins-epidemiologicos [ Links ]
17. Johns Hopkins University - JHU. Coronavirus Resource Center. World map [Internet]. Baltimore: Johns Hopkins University; 2020 [cited 2020 May 17]. Available from: https://coronavirus.jhu.edu/us-map [ Links ]
18. Ministério da Saúde (BR). Guia de vigilância em epidemiológica: emergência de saúde pública de importância nacional pela doença pelo coronavírus 2019 [Internet]. Brasília: Ministério da Saúde; 2020 [citado 2020 maio 18]. 34 p. Disponível em https://www.saude.gov.br/images/pdf/2020/April/06/GuiaDeVigiEp-final.pdf [ Links ]
19. Wu Z, McGoogan JM. Characteristics of and important lessons from the coronavirus disease 2019 (COVID-19) outbreak in China: summary of a report of 72 314 cases from the Chinese Center for Disease Control and Prevention. JAMA [Internet]. 2020 Feb [cited 2020 Apr 27]. Online ahead of print. Available from: https://doi.org/10.1001/jama.2020.2648 [ Links ]
20. Ministério da Saúde (BR). Coronavírus Brasil [Internet]. Brasília: Ministério da Saúde; 2020 [citado 2020 maio 16]. Disponível em: https://coronavirus.saude.gov.br/ [ Links ]
21. The World Bank – IBRD – IDA. Databank: world development indicators [Internet]. Washington, DC: The World Bank; 2020 [cited 2020 May 26]. Available from: https://databank.worldbank.org/reports.aspx?source=2&series=SP.POP.TOTL&country= [ Links ]
22. Universidade do Estado do Rio de Janeiro - UERJ. Estudo mostra eficiência do isolamento social contra o novo coronavírus [Internet]. Rio de Janeiro: UERJ; 2020 [citado 2020 maio 18]. Disponível em: https://www.uerj.br/noticia/11078/ [ Links ]
23. Ministério da Saúde (BR). Cadastro nacional de estabelecimentos de saúde (CNES) – recursos físicos – hospitalar – leitos de internação - Brasil [Internet]. Brasília: Ministério da Saúde; 2020 [citado 2020 maio 19]. Disponível em: http://tabnet.datasus.gov.br/cgi/tabcgi.exe?cnes/cnv/leiintbr.def [ Links ]
24. Carvalho R. Amazonas apresenta colapso no sistema de saúde por causa do coronavírus. Estadão [Internet]. 2020 abr [citado 2020 maio 19]. Disponível em: https://saude.estadao.com.br/noticias/geral,amazonas-apresenta-colapso-no-sistema-de-saude-por-causa-do-coronavirus,70003272136 [ Links ]
25. G1 AM Notícias. Com aumento de mortes cemitério em Manaus passa a ter enterros noturnos e caixões empilhados. G1 [Internet]. 2020 abr [citado 2020 maio 19]. Disponível em: https://g1.globo.com/am/amazonas/noticia/2020/04/28/com-aumento-de-mortes-cemiterio-em-manaus-passa-a-ter-enterros-noturnos-e-caixoes-empilhados-fotos.ghtml [ Links ]
26. Governo do Estado do Rio de Janeiro. Decreto n. 46.966, de 11 de março de 2020. Dispõe sobre as medidas para enfrentamento da Emergência de Saúde Pública de Importância Internacional decorrente do coronavírus, e dá outras providências [Internet]. Diário Oficial do Estado do Rio de Janeiro; Rio de Janeiro (RJ); 2020 mar 13 [citado 2020 maio 19]:46(47):parte I. Disponível em: https://pge.rj.gov.br/comum/code/MostrarArquivo.php?C=MTAyMTk%2C [ Links ]
27. Prefeitura Município do Rio de Janeiro. Decreto Rio n. 47.282, de 21 de março de 2020. Determina a adoção de medidas adicionais, pelo Município, para enfrentamento da pandemia do novo Coronavírus – COVID – 19, e dá outras providências [Internet]. Diário Oficial do Rio de Janeiro; Rio de Janeiro (RJ); 2020 mar 21 [citado 2020 maio 19]. Disponível em: http://prefeitura.rio/cidade/decreto-da-prefeitura-do-rio-determina-novas-medidas-para-o-combate-a-pandemia-do-novo-coronavirus/ [ Links ]
Received: June 03, 2020; Accepted: July 01, 2020
 This is an Open Access article distributed under the terms of the Creative Commons Attribution Non-Commercial License, which permits unrestricted non-commercial use, distribution, and reproduction in any medium, provided the original work is properly cited.
