


Serviços Personalizados
Journal

Artigo
 texto em
  Inglês (pdf)
 Artigo em XML
 Referências do artigo
 Enviar este artigo por email
Indicadores
-
 Citado por SciELO
Links relacionados
-
 Similares em
SciELO
Similares em
SciELO
Compartilhar

 Permalink
Epidemiologia e Serviços de Saúde
versão impressa ISSN 1679-4974versão On-line ISSN 2237-9622
Epidemiol. Serv. Saúde vol.29 no.4 Brasília 2020 Epub 21-Set-2020
http://dx.doi.org/10.5123/s1679-49742020000400023
HEALTH SURVEILLANCE MANAGEMENT TOOLS
Forecast UTI: application for predicting intensive care unit beds in the context of the COVID-19 pandemic*
1Universidade Federal de São Paulo, Instituto de Ciência e Tecnologia, São José dos Campos, SP, Brazil
2Universidade Federal de São Paulo, Escola Paulista de Medicina, São Paulo, SP, Brazil
In view of the need to manage and forecast the number of Intensive Care Unit (ICU) beds for critically ill COVID-19 patients, the Forecast UTI open access application was developed to enable hospital indicator monitoring based on past health data and the temporal dynamics of the Coronavirus epidemic. Forecast UTI also enables short-term forecasts of the number of beds occupied daily by COVID-19 patients and possible care scenarios to be established. This article presents the functions, mode of access and examples of uses of Forecast UTI, a computational tool intended to assist managers of public and private hospitals within the Brazilian National Health System by supporting quick, strategic and efficient decision-making.
Key words: Coronavirus Infections; Public Health Surveillance; Forecasting; Unified Health System; Intensive Care Units
Introduction
Since the beginning of the COVID-19 epidemic in Wuhan, capital of Hubei Province in China, in December 2019, up until June 30th 2020, the disease has infected more than 10 million people and caused approximately 500,000 deaths worldwide.(1) In Brazil, according to official data, as at June 20th 2020, more than 1 million cases and 50,000 deaths had been recorded.(2)
COVID-19 is known to be a highly transmissible disease, its prevention and control are restricted to non-pharmaceutical measures and there is no medication proven to be efficacious in curing the disease; vaccines to prevent it are still in the experimental stage. In addition to asymptomatic infection, SARS-CoV-2 virus, the disease’s etiological agent, is capable of producing acute respiratory syndrome, varying between mild cases (around 80%) to very severe cases (between 5% and 10%), which develop respiratory insufficiency and require medical care in hospital. COVID-19 lethality, defined as the proportion of cases that die, varies according to age range and comorbidities of affected individuals, and is also influenced by health service capacity to provide care.(3)
In this context, one of the main uncertainties of Brazilian National Health System (SUS) hospital managers lies in forecasting the number of intensive care unit (ICU) beds needed for severe cases of the disease, taking into consideration the epidemic’s temporal dynamics. With the aim of assisting Public Health decision-making, researchers have developed computerized tools(4)which, through the application of mathematical models, are able to estimate the daily number of new COVID-19 cases, based on distribution and severity of the disease, so as to be able to forecast its impact on capacity to provide ICU beds. In short, these methods make short-term forecasts based on official health data and, by means of online applications, enable users to adjust those data according to local needs.(6)
Considering the unequal distribution of SUS hospital beds over the national territory and the fact of the COVID-19 epidemic being at different stages in the Brazilian municipalities and states, managing ICU beds is a challenge to be faced according to the specificities and realities of each health service territory.(8)
This paper presents the functions, mode of access and use of the Forecast UTI application, a computer tool capable of assisting public and private hospital managers within SUS to forecast the number of ICU beds needed for severe COVID-19 cases over a given time period, based on past health service data.
The Forecast UTI application
Software development
The software was developed using the following programming languages:
SQL for developing the database,
Angular Framework for developing the user interface (front-end), and
C# for developing the algorithms (back-end).
In computer science, the terms front-end and back-end refer to the initial and final stages of the process, respectively.
Statistics and forecasts produced by the Forecast UTI application
Forecast UTI calculates average values and standard deviation for the ‘number of hospitalizations per day’ and ‘time of hospitalization’ (in days) variables. It calculates a percentage value for the ‘hospital lethality’ variable, defined as the proportion of COVID-19 cases that have died. The application provides graphic visualization for the ‘number of ICU beds occupied per day’, ‘number of new hospitalizations per day’, ‘cumulative number of hospitalizations’ and ‘number of deaths by age group’ variables, by means of bar plots. It provides boxplot graphs for ‘patients’ age’ (in years) and ‘time of hospitalization’. Finally, the ‘current patients’ situation’ variable, classified as ‘inpatient’, ‘discharged’ or ‘death’, is visualized by means of a donut chart.
Forecast UTI uses polynomial regression models(9) adjusted to the fifth degree, for forecasting the ‘number of COVID-19 occupied ICU beds’. For each model, the application calculates the forecast root mean square error (RMSE) and chooses the model with the lowest RMSE. The statistical analyses consider a equal to 5%.
Forecast UTI scenario simulation: ICU bed use
Based on the ‘total number of beds’, ‘number of planning days’, ‘average number of patients per day’, ‘time of hospitalization’ and ‘number of COVID-19 occupied beds’ variables, the application simulates hypothetical care scenarios. Based on data input by the user, parameters are generated randomly for each scenario. The daily number of new patients is calculated according to a Poisson distribution, while for the calculation of hospitalization times for new patients, a Uniform distribution is considered.
The simulations generate 1,000 different scenarios for the set of variables input to the application. Each scenario is planned with the aim of allocating the new patient to the first available ICU bed. If all the beds are occupied, the patient will not be admitted to the hospital. After simulating all the scenarios, the tool shows the worst possible scenario, i.e. the scenario with the highest number of patients when cannot be cared for because of maximum ICU bed occupation.
Accessing Forecast UTI
All SUS managers interested in the application should fill in the form available at https://www.forecastuti.unifesp.br/
They will later receive a username and a password to be used to access the application free of charge.
Importing files to Forecast UTI
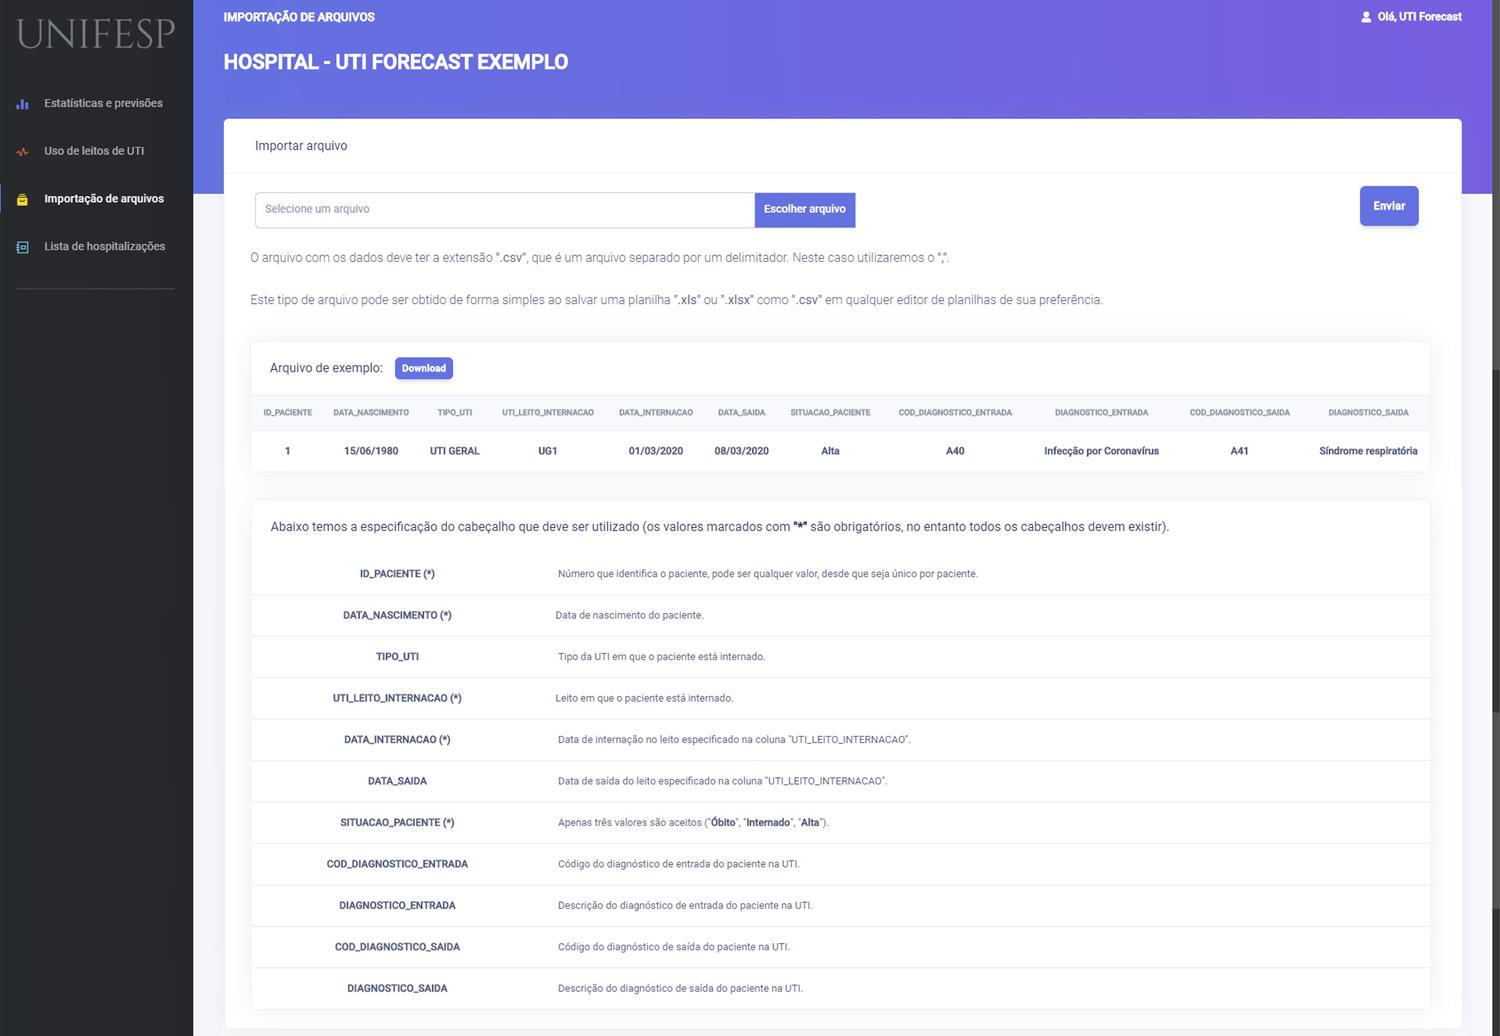
After accessing the application, the user should use the ‘Import Files’ tab to load the system with a file with a ‘.csv’ file extension containing the obligatory variables for their patients: ‘identification number’, ‘date of birth’, ‘inpatient bed’, ‘date of admission’ and ‘patient’s current status’. If necessary, the user can also include the following variables: patient ‘ICU type’, ‘ICD on admission’ and ‘ICD on discharge’ (Figure 1). Confidentiality of data loaded via the website is ensured as they are available only to the registered user.
Examples of Forecast UTI use
For illustration purposes, we have used artificial data to provide examples of Forecast UTI features. This login (exemplo@unifesp.br) and password (dadosexemplo) can be used to access the application website, if readers would like to reproduce the following examples.
The two main monitoring tabs are available: ‘Statistics and forecasts’ and ‘ICU bed use’, which enable ICU bed occupation by COVID-19 cases to be monitored and different scenarios to be simulated, respectively.
Selecting the ‘Statistics and forecasts’ tab, one can visualize average daily ICU bed occupation, average time of hospitalization in the ICU and COVID-19 lethality. Using this tab, one can see the distribution of the daily number of occupied ICU beds and make forecasts of up to 10 days. It is also possible to visualize the daily distribution of new COVID-19 admissions, the cumulative number of admissions, monitor number of deaths by age group, length of inpatient stat and current status (Figure 2).
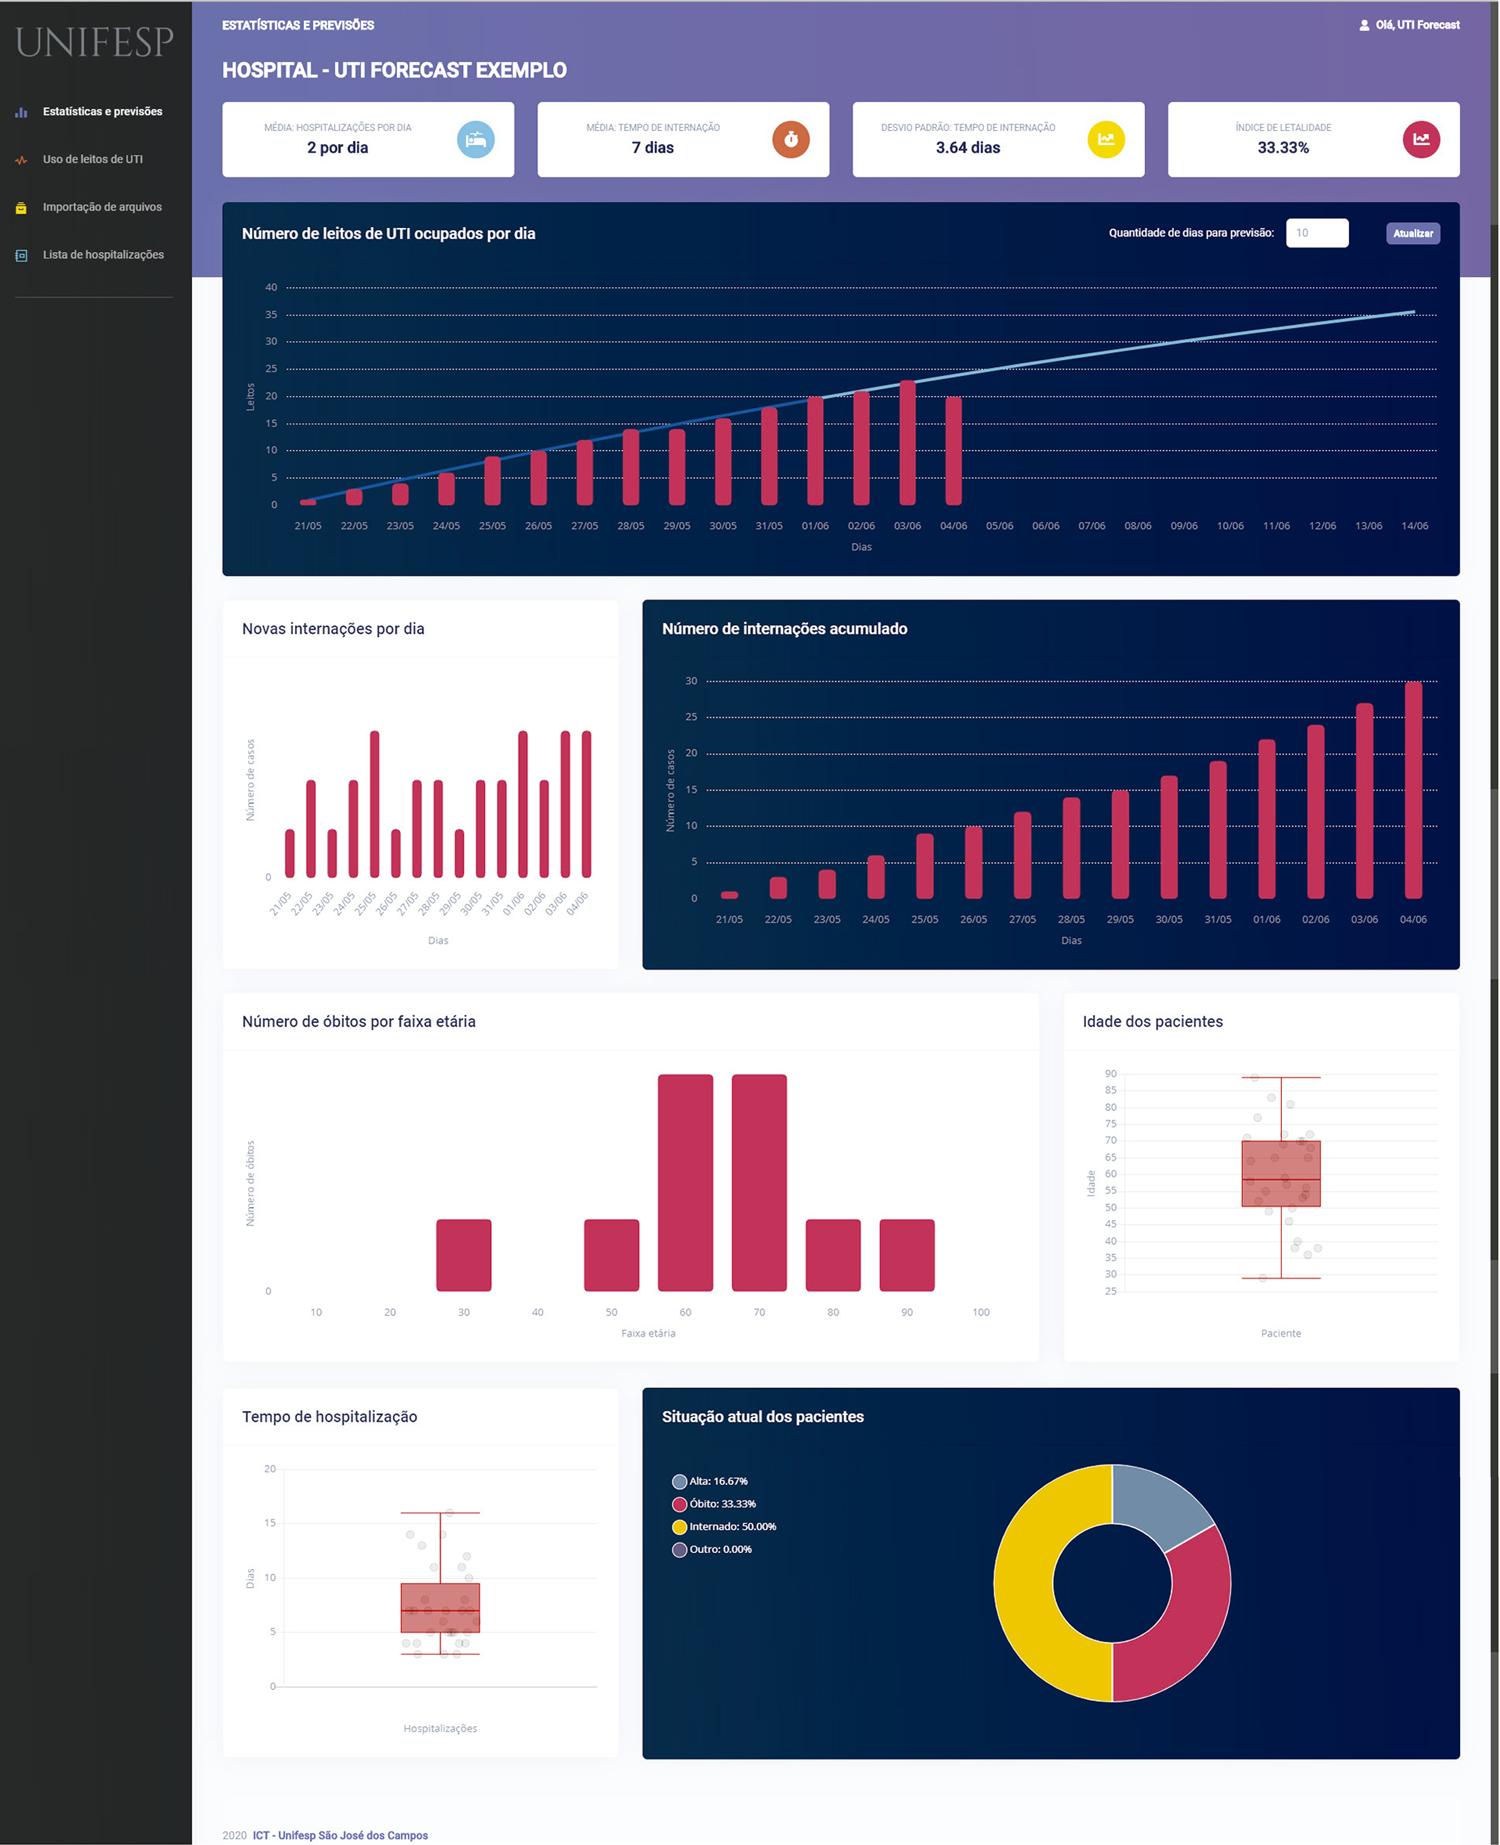
Figure 2 – Forecast UTI ‘Statistics and Forecasts’ tab, using artificial data: hospital indicators of interest and forecast number of occupied ICU beds per dayICU: Intensive Care Unit.
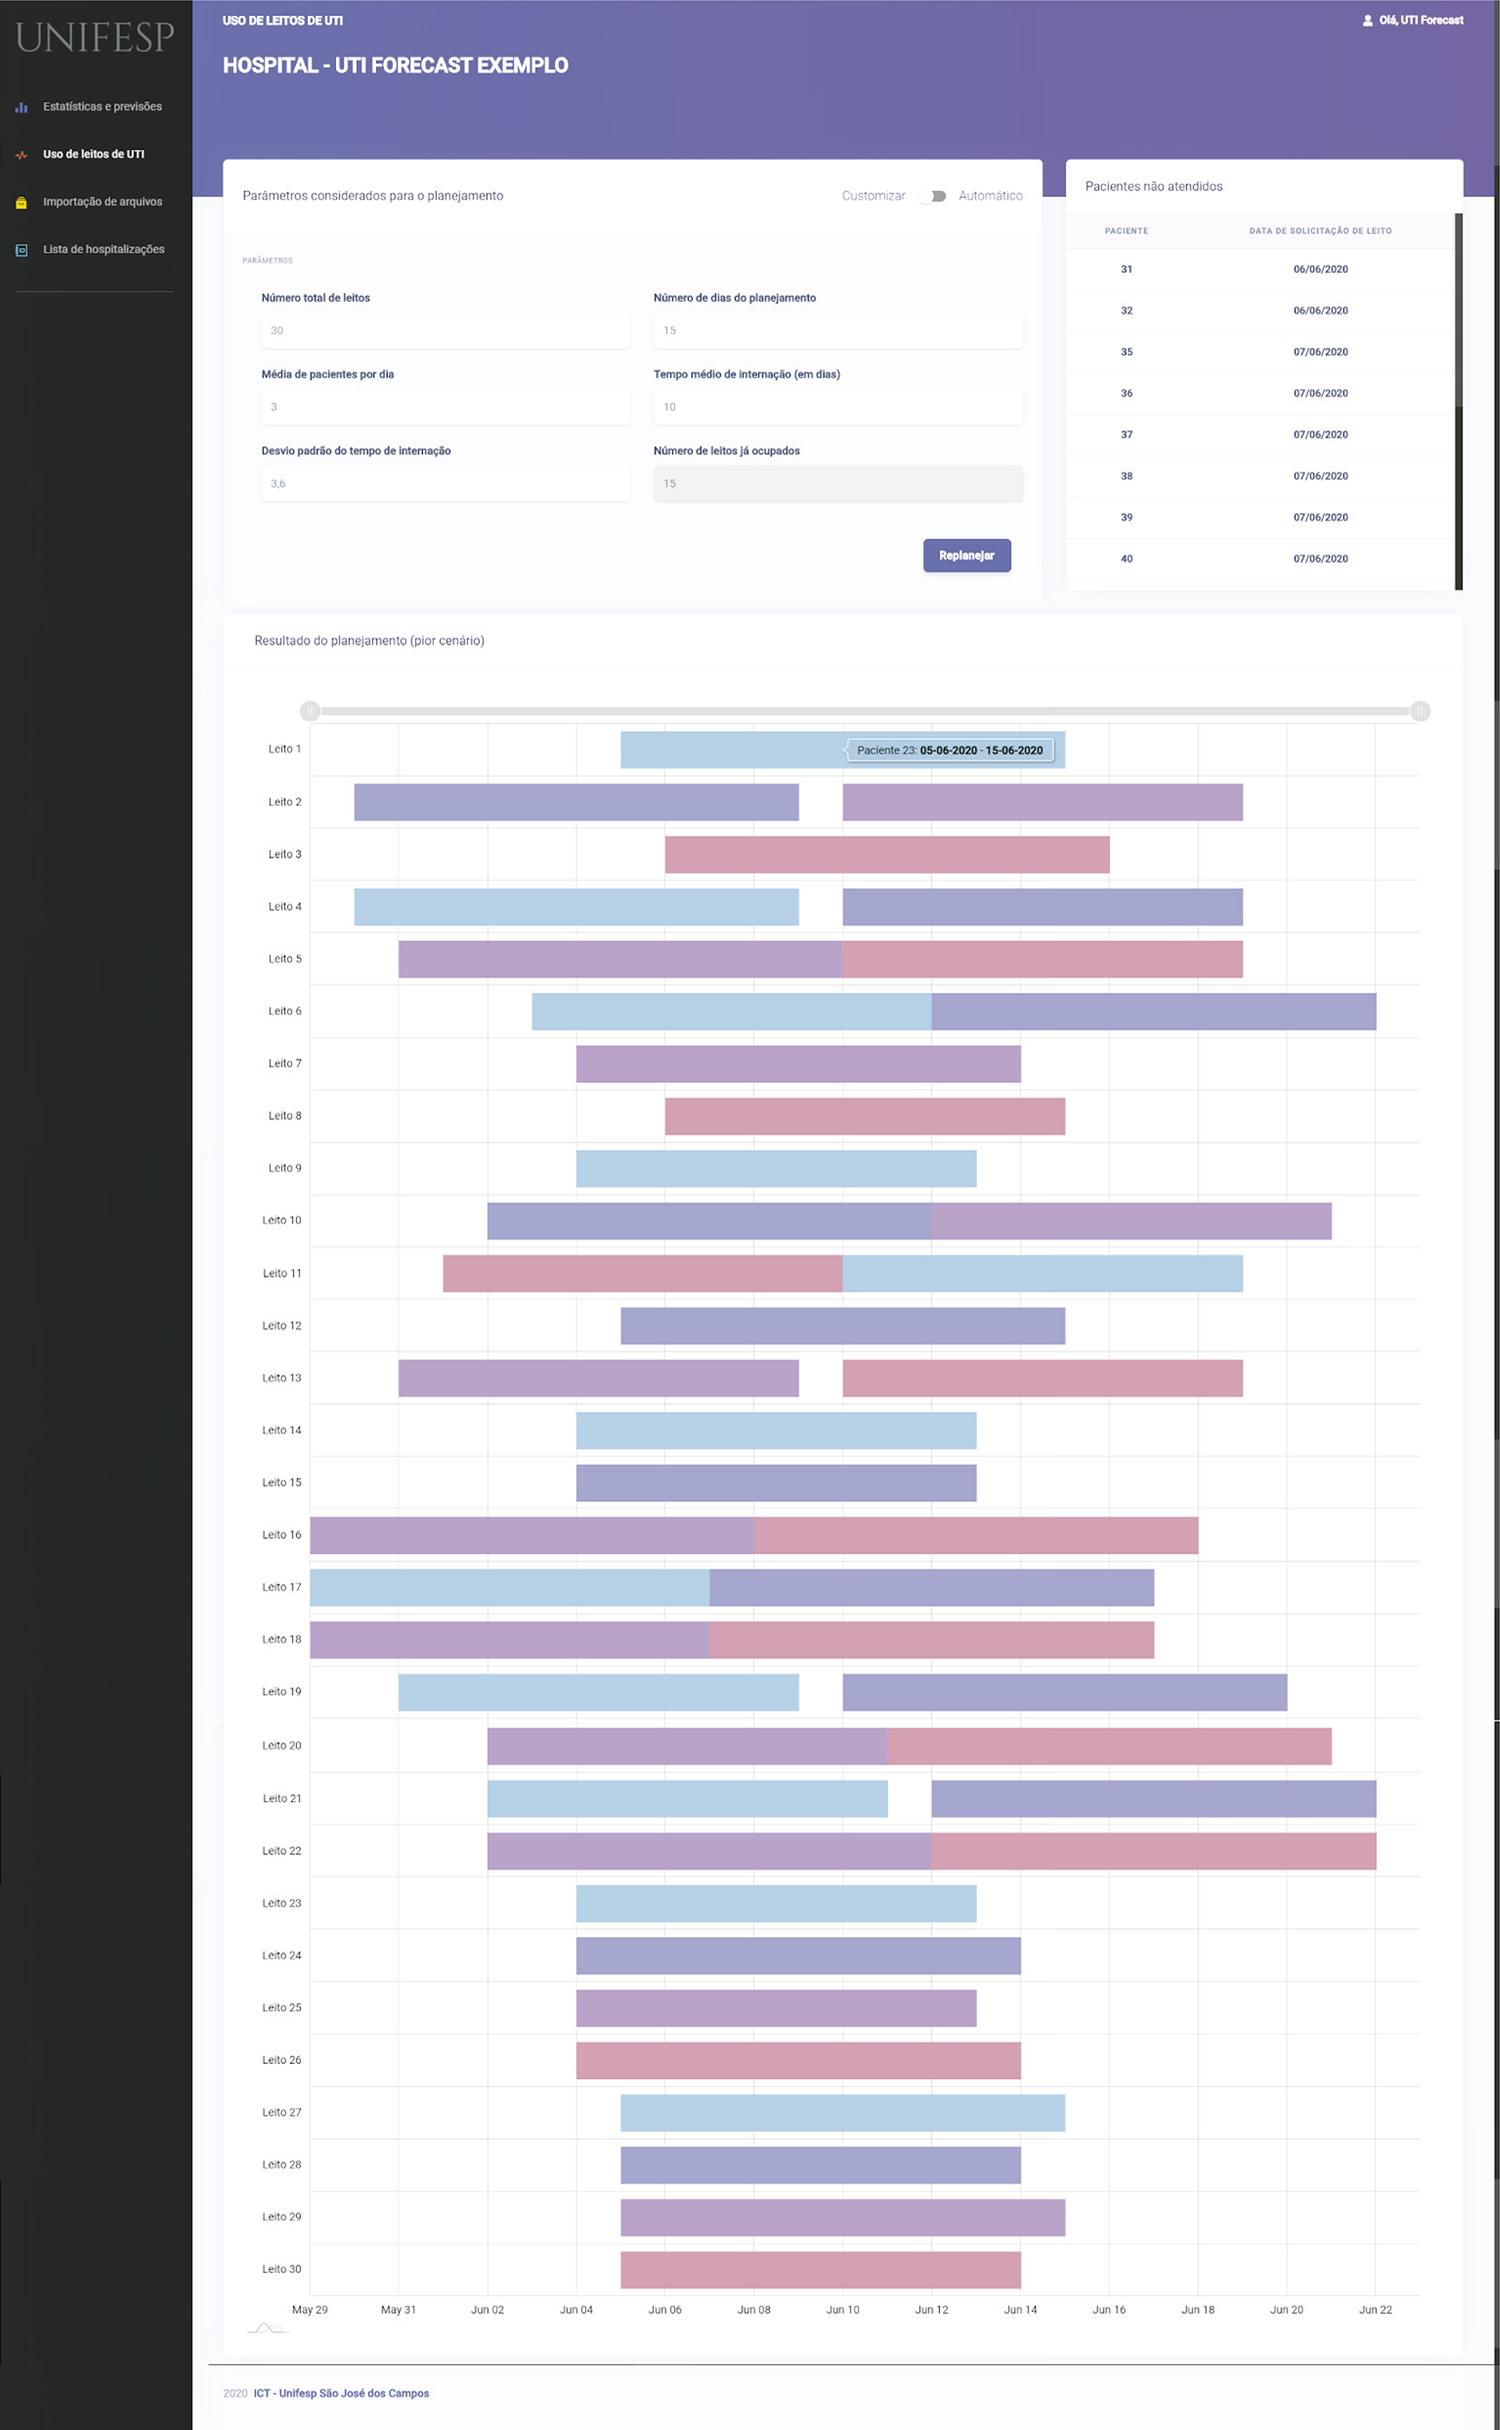
The ‘ICU bed use’ tab (Figure 3) enables different scenarios to be simulated in order to assist with ICU bed management. This simulation enables one to check what will happen with ICU bed occupation if there is a change in the daily number of new patients, average time of hospitalization and number of beds available. The application shows each ICU bed on a line on the graph, as well as hospitalized patients, in their respective beds, along the planning horizon. The bars on the graph represent each patient’s admission and discharge date. Information is also provided about patients who were not admitted because of lack of available ICU beds on the day they arrived at the hospital. Finally, Figure 3 shows in the form of a graph the situation under the worst simulation scenario achieved by using test data. The following values were used in this example: total number of beds = 30 beds; number of planning days = 15 days; average number of patients per day = 3 patients; average length of inpatient stay = 10 days; standard deviation of length of inpatient stay = 3.6 days; and number of occupied beds = 15 beds. Using this simulation, the worst scenario produced resulted in 16 patients who could not be admitted because of lack of beds.
Final considerations
This paper presented the Forecast UTI application and its features for managing SUS ICU beds. This tool has been developed to meet the need to monitor hospital beds during the COVID-19 pandemic and facilitate the management of public and private hospitals within the SUS network.
The ‘Statistics and forecasts’ tab enables information on patients with COVID-19 admitted to ICUs to be visualized and monitored, assisting with ICU bed management within the context of epidemics. The ‘ICU bed use’ tab enables different scenarios of patient allocation to be simulated, resulting in the scenario with the largest number of patients not admitted because of maximum ICU bed occupation.
The Forecast UTI tool is free, confidential, flexible and can be used by any interested health service manager. Given that the data are input by the user and that the platform updates them automatically, it will always be possible to have real-time access to basic patient statistics, forecasts and simulations. The application is user-friendly and intuitive, although enhancements and updates will always be possible, such as the possibility of (i) loading files with other file extensions, (ii) implementing other forecast models, such as fractional polynomial models and machine learning models, (iii) including new variables of interest, such as presence of comorbidities, for instance, as well as (iv) enabling the system to be integrated with the patient’s electronic medical records and (v) translating the language it uses into other languages. Finally, it is important to highlight that the accuracy of the statistics and forecasts produced depends on the quality of data input to the platform.
At the time of finalizing this manuscript, there are approximately 20 Forecast UTI users, including hospitals, Municipal and State Health Departments and researchers and, thus far, no problems have been reported with using this software.
We believe that tools such as Forecast UTI are useful for managing Brazilian National Health System public and private hospital services, since they inform decision-making in a rapid, strategic and efficient manner. We hope that this paper will contribute to enhancement and expansion of the use of technologies of this nature.
REFERENCES
1. Health Organization - WHO. Coronavirus disease: situation report – 162 [Internet]. Geneva: World Health Organization; 2020 [cited 2020 Jul 27]. Available from: https://www.who.int/docs/default-source/coronaviruse/20200630-covid-19-sitrep-162.pdf?sfvrsn=e00a5466_2 [ Links ]
2. Ministério da Saúde (BR). Secretaria de Vigilância em Saúde. Doença pelo coronavírus COVID-19. Bol Epidemiol [Internet]. 2020 jun [citado 2020 jul 27];19(especial). Disponível em: http://saude.gov.br/images/pdf/2020/June/25/Boletim-epidemiologico-COVID-19-2.pdf [ Links ]
3. Ministério da Saúde (BR). Guia de vigilância epidemiológica: emergência de saúde pública de importância nacional pela doença pelo coronavírus 2019 [Internet]. Brasília: Ministério da Saúde; 2020 [citado 2020 jul 27]. Disponível em: https://portalarquivos.saude.gov.br/images/pdf/2020/April/07/GuiaDeVigiEpidemC19-v2.pdf [ Links ]
4. Nedel FB. csapAIH: uma função para a classificação das condições sensíveis à atenção primária no programa estatístico R. Epidemiol Serv Saúde [Internet]. 2017 jan-mar [citado 2020 jul 27];26(1):199-209. Disponível em: http://dx.doi.org/10.5123/s1679-49742017000100021 [ Links ]
5. Saldanha RF, Bastos RR, Barcellos C. Microdatasus: pacote para download e pré-processamento de microdados do Departamento de Informática do SUS (DATASUS). Cad Saúde Pública [Internet]. 2019 [citado 2020 jul 27];35(9):e00032419. Disponível em: http://dx.doi.org/10.1590/0102-311x00032419 [ Links ]
6. Deasy J, Rocheteau E, Kohler K, Stubbs DJ, Barbiero P, Liò P, et al. Forecasting ultra-early intensive care strain from COVID-19 in England. MedRxiv [Internet]. 2020 Apr [cited 2020 Jul 27]. Available from: https://doi.org/10.1101/2020.03.19.20039057 [ Links ]
7. Giannakeas V, Bathia D, Warkentin MT, Bogosh I, Stall MN. Estimating the maximum daily number of incident COVID-19 cases manageable by a healthcare system. MedRxiv [Internet]. 2020 Mar [cited 2020 Jul 27]. Available from: https://doi.org/10.1101/2020.03.25.20043711 [ Links ]
8. Barcellos CC, Sabroza PC, Peiter P, Rojas LI. Organização espacial, saúde e qualidade de vida: análise espacial e uso de indicadores na avaliação de situações de saúde. Inf Epidemiol SUS [Internet]. 2002 set [citado 2020 jul 27];11(3):129-38. Disponível em: https://www.arca.fiocruz.br/handle/icict/713 [ Links ]
9. Lindley DV. Regression and correlation analysis. In: Eatwell J, Milgate M, Newman P, editors. Time series and statistics. London: Palgrave Macmillan; 1990 [ Links ]
* The study project ‘Estimated number of ICU beds needed per day and equipment management during the COVID-19 epidemic in diverse scenarios’ was approved by the Federal University of São Paulo and the São Paulo Hospital National Research Ethics Committee: Protocol No. 6403040420.
4
Erratum
In the article “Forecast UTI: application for predicting intensive care unit beds in the context of the COVID-19 pandemic”, doi: 10.5123/s1679-49742020000400023, published on Epidemiology and Health Services, 29(4):1-7, in the page 1:
Original text:
“doi: 10.5123/s1679-49742020000400023”
Corrected text:
“doi: 10.1590/s1679-49742020000400023”
Received: June 06, 2020; Accepted: July 22, 2020
 This is an Open Access article distributed under the terms of the Creative Commons Attribution Non-Commercial License, which permits unrestricted non-commercial use, distribution, and reproduction in any medium, provided the original work is properly cited.
