


Servicios Personalizados
Revista

Articulo
 texto en
  Inglés (pdf)
 Articulo en XML
 Referencias del artículo
 Enviar articulo por email
Indicadores
-
 Citado por SciELO
Links relacionados
-
 Similares en
SciELO
Similares en
SciELO
Compartir

 Permalink
Epidemiologia e Serviços de Saúde
versión impresa ISSN 1679-4974versión On-line ISSN 2237-9622
Epidemiol. Serv. Saúde vol.29 no.5 Brasília 2020 Epub 28-Oct-2020
http://dx.doi.org/10.1590/s1679-49742020000500005
Original Article
Transport accident mortality time trend and spatial distribution in Piauí, Brazil, 2000-2017
1Universidade Federal do Piauí, Programa de Pós-Graduação em Saúde e Comunidade, Teresina, PI, Brazil
Objective:
To analyze the time trend and spatial distribution of transport accident (TA) mortality in Piauí, from 2000 to 2017.
Methods:
An ecological time series study was conducted using Mortality Information System (SIM) data on TA mortality among people resident in the state of Piauí, according to sex, age group and municipality. Prais-Winsten regression was used.
Results:
14,396 deaths were recorded. The mortality rate per 100,000 inhabitants was 13.9 in 2000 and 30.6 in 2017. There was a significant increase in the TA mortality rate (annual percent change [APC] of 6.4% – 95%CI 4.3;8.7), being higher among motorcyclists (APC=14.7% – 95%CI 9.7;20.0) and among vehicle occupants (APC=15.2 – 95%CI 10.5;20.2).
Conclusion:
There was significant increase in TA mortality in Piauí, especially among motorcyclists and vehicle occupants. Actions are needed to promote road safety and to prevent road traffic deaths.
Keywords: Accidents, Traffic; Time Series Studies; Mortality; Health Information Systems
Introduction
Road traffic violence is a serious and complex Public Health problem. Despite the mortality rate having decreased globally, the annual number of deaths remains extremely high at around 1.35 million/year, with a considerable increase in road transport accident injuries.1,2
Transport accident mortality and incidence rates vary depending on regional and sociodemographic aspects. In 2016, low or middle-income countries accounted for approximately 93% of all road traffic deaths worldwide. Risk of injury and death due to transport accidents is greater among adolescents and young adults, as well as among people of the male sex.1,2
Between 1990 and 2015, a reduction in the transport accident mortality rate was identified in 26 of Brazil's 27 federative units, with Piauí being the only state showing an increase (9.7%).
In Brazil between 2000 and 2010, the number of deaths caused by transport accidents rose from 28,995 to 42.884, representing an increase of 32.3%.3 In 2017, these accidents were the second leading cause of death among all deaths from external causes (N=35,400), being more frequent among males (82.0%) and people between 20 and 39 years old (42.9%).4
Between 1990 and 2015, a reduction in the transport accident mortality rate was identified in 26 of Brazil's 27 federative units, with Piauí being the only state showing an increase (9.7%). Moreover, in 2015, the states of Piauí and Maranhão had the second highest mortality rate (36.3/100,000 inhabitants) after the state of Tocantins (41.7/100,000 inhab.).5 Despite its high transport accident mortality rate, Piauí has a ratio of 1 vehicle per 2.7 inhabitants, coming in 19th place among the country's 27 Federative Units in terms of registered vehicles in 2018.6 Even with one of the lowest volumes of registered vehicles, Piauí faces problems arising from having the highest incidence of road traffic deaths in Brazil and this requires epidemiological analyses to contribute to a better understanding of these events.
The objective of this article was to analyze the time trend and spatial analysis of transport accident mortality in Piauí from 2000 to 2017.
Methods
This was an ecological time series study of transport accident deaths between 2000 and 2017 involving people living in the state of Piauí.
The data for the study were retrieved from the Mortality Information System (SIM) via the Brazilian National Health System Information Technology Department (DATASUS).4 We selected deaths of people living in Piauí whose cause of death corresponded to codes V01 to V89 of chapter XX of the International Statistical Classification of Diseases and Related Health Problems, 10th Revision (ICD-10). Population information was retrieved from the Brazilian Institute of Geography and Statistics (IBGE), using its projections for the years analyzed by the study.
The following variables were analyzed:
Sex (male; female);
Age group (in years: up to 9; 10-19; 20-39; 40-59; 60 or over);
Race/skin color (Black [Black + brown]; White; yellow; indigenous);
Schooling (in years of study: none; 1-7; 8 or more);
Municipality of residence;
-
Type of victim
–. Pedestrian, V01-V09
–. Cyclist, V10-V19
–. Motorcyclist, V20-V39 (motorcycle and three-wheeled motor vehicle)
–. Vehicle occupant, V40-V79 (car, pick-up truck, heavy transport vehicle and bus)
–. Occupant of other types of transport, V80-V89 (animal-drawn vehicle, railway train, streetcar, special vehicles and non-specified vehicles).
The data were imported from the DATASUS website and organized using the Microsoft Excel Office 2016 computer program. The mortality rates were calculated by dividing the number of deaths (numerator) by the number of people resident in the state (denominator) in the initial and final year of the period (2000 and 2017), and then multiplying each result by 100,000 inhabitants. The rates were aggregated for each municipality. In order to visualize evolution of mortality in each municipality, we calculated three-year average transport accident mortality rates shown on maps prepared by the QGIS 2.18 computer program.
In order to analyze the time trend of the annual transport accident mortality rates, we used the Prais-Winsten linear regression model, which takes into account serial auto-correlation, i.e. the dependence of a serial measurement on its own values in previous periods. Annual percent change (APC) and its respective 95% confidence intervals (95%CI) were calculated. The mortality rate trend was interpreted as rising (p<0.05 and positive beta), falling (p<0.05 and negative beta) and stable (p≥0.05), in accordance with the conception of Antunes & Cardoso.7 Exploration of the explanatory variables and analysis of the time series were performed by the Stata computer program, version 14 (StataCorp LP, College Station, USA).
Results
Between 2000 and 2017, 14,396 deaths resulting from transport accidents were recorded in Piauí. The majority of deaths occurred among males (85.0%), in the 20-39 age group (47.3%), among those of Black race/skin color (80.9%) and among those who had 1-7 years of schooling (58.6%). Almost half (48.9%) the deaths resulted from motorcycle accidents (Table 1). There was an increase in the mortality rate, from 13.9 deaths/100,000 inhab. in 2000, to 30.6 deaths/100,000 inhab. in 2017 (Table 2).
Table 1 Transport accident deaths according to demographic characteristics and type of victim, by sex, Piauí, 2000-2017
| Características) | Totala | Male | Female | ||||
|---|---|---|---|---|---|---|---|
| N | % | N | % | N | % | ||
| Age (in years) | |||||||
| ≤9 | 383 | 2.7 | 219 | 1.8 | 163 | 7.6 | |
| 10-19 | 1,544 | 10.7 | 1,236 | 10.1 | 308 | 14.3 | |
| 20-39 | 6,796 | 47.3 | 6,009 | 49.2 | 785 | 36.4 | |
| 40-59 | 3,754 | 26.1 | 3,226 | 26.4 | 528 | 24.5 | |
| ≥60 | 1,898 | 13.2 | 1,526 | 12.5 | 371 | 17.2 | |
| Race/skin color | |||||||
| Black (black + brown) | 10,897 | 80.9 | 9,366 | 81.8 | 1,531 | 75.9 | |
| White | 2,539 | 18.8 | 2,059 | 18.0 | 480 | 23.8 | |
| Yellow | 32 | 0.2 | 28 | 0.2 | 4 | 0.2 | |
| Indigenous | 8 | 0.1 | 5 | 0.0 | 3 | 0.1 | |
| Schooling (in years) | |||||||
| None | 1,923 | 15.2 | 1,631 | 15.1 | 292 | 15.7 | |
| 1-7 | 7,426 | 58.6 | 6,495 | 60.1 | 931 | 50.1 | |
| ≥8 | 3,314 | 26.2 | 2,680 | 24.8 | 634 | 34.1 | |
| Type of victim | |||||||
| Pedestrian | 2,137 | 14.8 | 1,595 | 13.0 | 540 | 25.0 | |
| Cyclist | 684 | 4.8 | 620 | 5.1 | 64 | 3.0 | |
| Motorcyclist | 7,041 | 48.9 | 6,310 | 51.6 | 729 | 33.8 | |
| Vehicle occupant | 1,702 | 11.8 | 1,287 | 10.5 | 412 | 19.1 | |
| Occupant of other types of transportb | 2,832 | 20.0 | 2,416 | 19.8 | 413 | 19.1 | |
a)Includes 10 cases with no information on sex.
b)Includes animal-drawn vehicles, railway trains, streetcars, special vehicles and non-specified vehicles.
Note: Missing values were excluded for the following variables: age group (n=21), race/skin color (n=920) and schooling (n=1,733).
Table 2 Mortality rate trend (per 100,000 inhab.) for transport accidents, by type of victim and sex, Piauí, 2000-2017
| Type of victim and sex | Mortality rate | Annual percent change (%) | 95%CIa | p-valueb | Trend | ||
|---|---|---|---|---|---|---|---|
| 2000 | 2017 | ||||||
| Total | 13.9 | 30.6 | 6.4 | 4.3;8.7 | <0.001 | Rising | |
| Male (M) | 22.4 | 53.1 | 6.5 | 4.3;8.7 | <0.001 | Rising | |
| Female (F) | 5.6 | 9.0 | 3.9 | 1.9;6.0 | 0.001 | Rising | |
| M/F ratio | 4.0 | 5.9 | |||||
| Pedestrian | 3.3 | 2.7 | -0.9 | -4.9;3.4 | 0.667 | Stable | |
| Male (M) | 5.3 | 4.8 | 0.3 | -2.8;3.5 | 0.838 | Stable | |
| Female (F) | 1.4 | 0.8 | -1.8 | -6.9;3.5 | 0.471 | Stable | |
| M/F ratio | 3.7 | 6.1 | |||||
| Cyclist | 0.6 | 1.4 | 4.7 | 1.8;7.6 | 0.003 | Rising | |
| Male (M) | 1.1 | 2.5 | 5.4 | 1.2;9.7 | 0.014 | Rising | |
| Female (F) | 0.1 | 0.3 | 2.3 | -2.8;7.6 | 0.367 | Stable | |
| M/F ratio | 7.7 | 8.2 | |||||
| Motorcyclist | 2.1 | 19.6 | 14.7 | 9.7;20.0 | <0.001 | Rising | |
| Male (M) | 3.8 | 35.7 | 14.7 | 9.0;20.7 | <0.001 | Rising | |
| Female (F) | 0.5 | 4.2 | 13.3 | 10.3;16.4 | <0.001 | Rising | |
| M/F ratio | 7.9 | 8.4 | |||||
| Vehicle occupant | 0.3 | 5.1 | 15.2 | 10.5;20.2 | <0.001 | Rising | |
| Male (M) | 0.6 | 7.1 | 14.4 | 10.7;18.2 | <0.001 | Rising | |
| Female (F) | – | 3.0 | 13.6 | 8.1;19.4 | <0.001 | Rising | |
| M/F ratio | – | 2.4 | |||||
| Occupant of other types of transportc | 7.5 | 1.8 | -6.6 | -9.2;-4.1 | <0.001 | Falling | |
| Male (M) | 11.6 | 3.1 | -6.0 | -8.5;-3.5 | <0.001 | Falling | |
| Female (F) | 3.6 | 0.6 | -9.2 | -11.3;-7.0 | <0.001 | Falling | |
| M/F ratio | 3.2 | 4.9 | |||||
a)95%CI: 95% confidence interval.
b)Wald's test.
c)Includes animal-drawn vehicles, railway trains, streetcars, special vehicles and non-specified vehicles.
Motorcyclists were at greatest risk of transport accidentrelated death. In 2000, the mortality rate for motorcyclists was 2.1/100,000 inhab., rising to 19.6/100,000 inhab. in 2017 (rata ratio=9.3). Between the beginning and the end of the period analyzed, the vehicle occupant mortality rate rose (from 0.3 to 5.1/100,000 inhab.), while there was a fall in the mortality rate for other victim types – except motorcyclist deaths as mentioned above and a slight increase in the cyclist mortality rate (Figure 1).
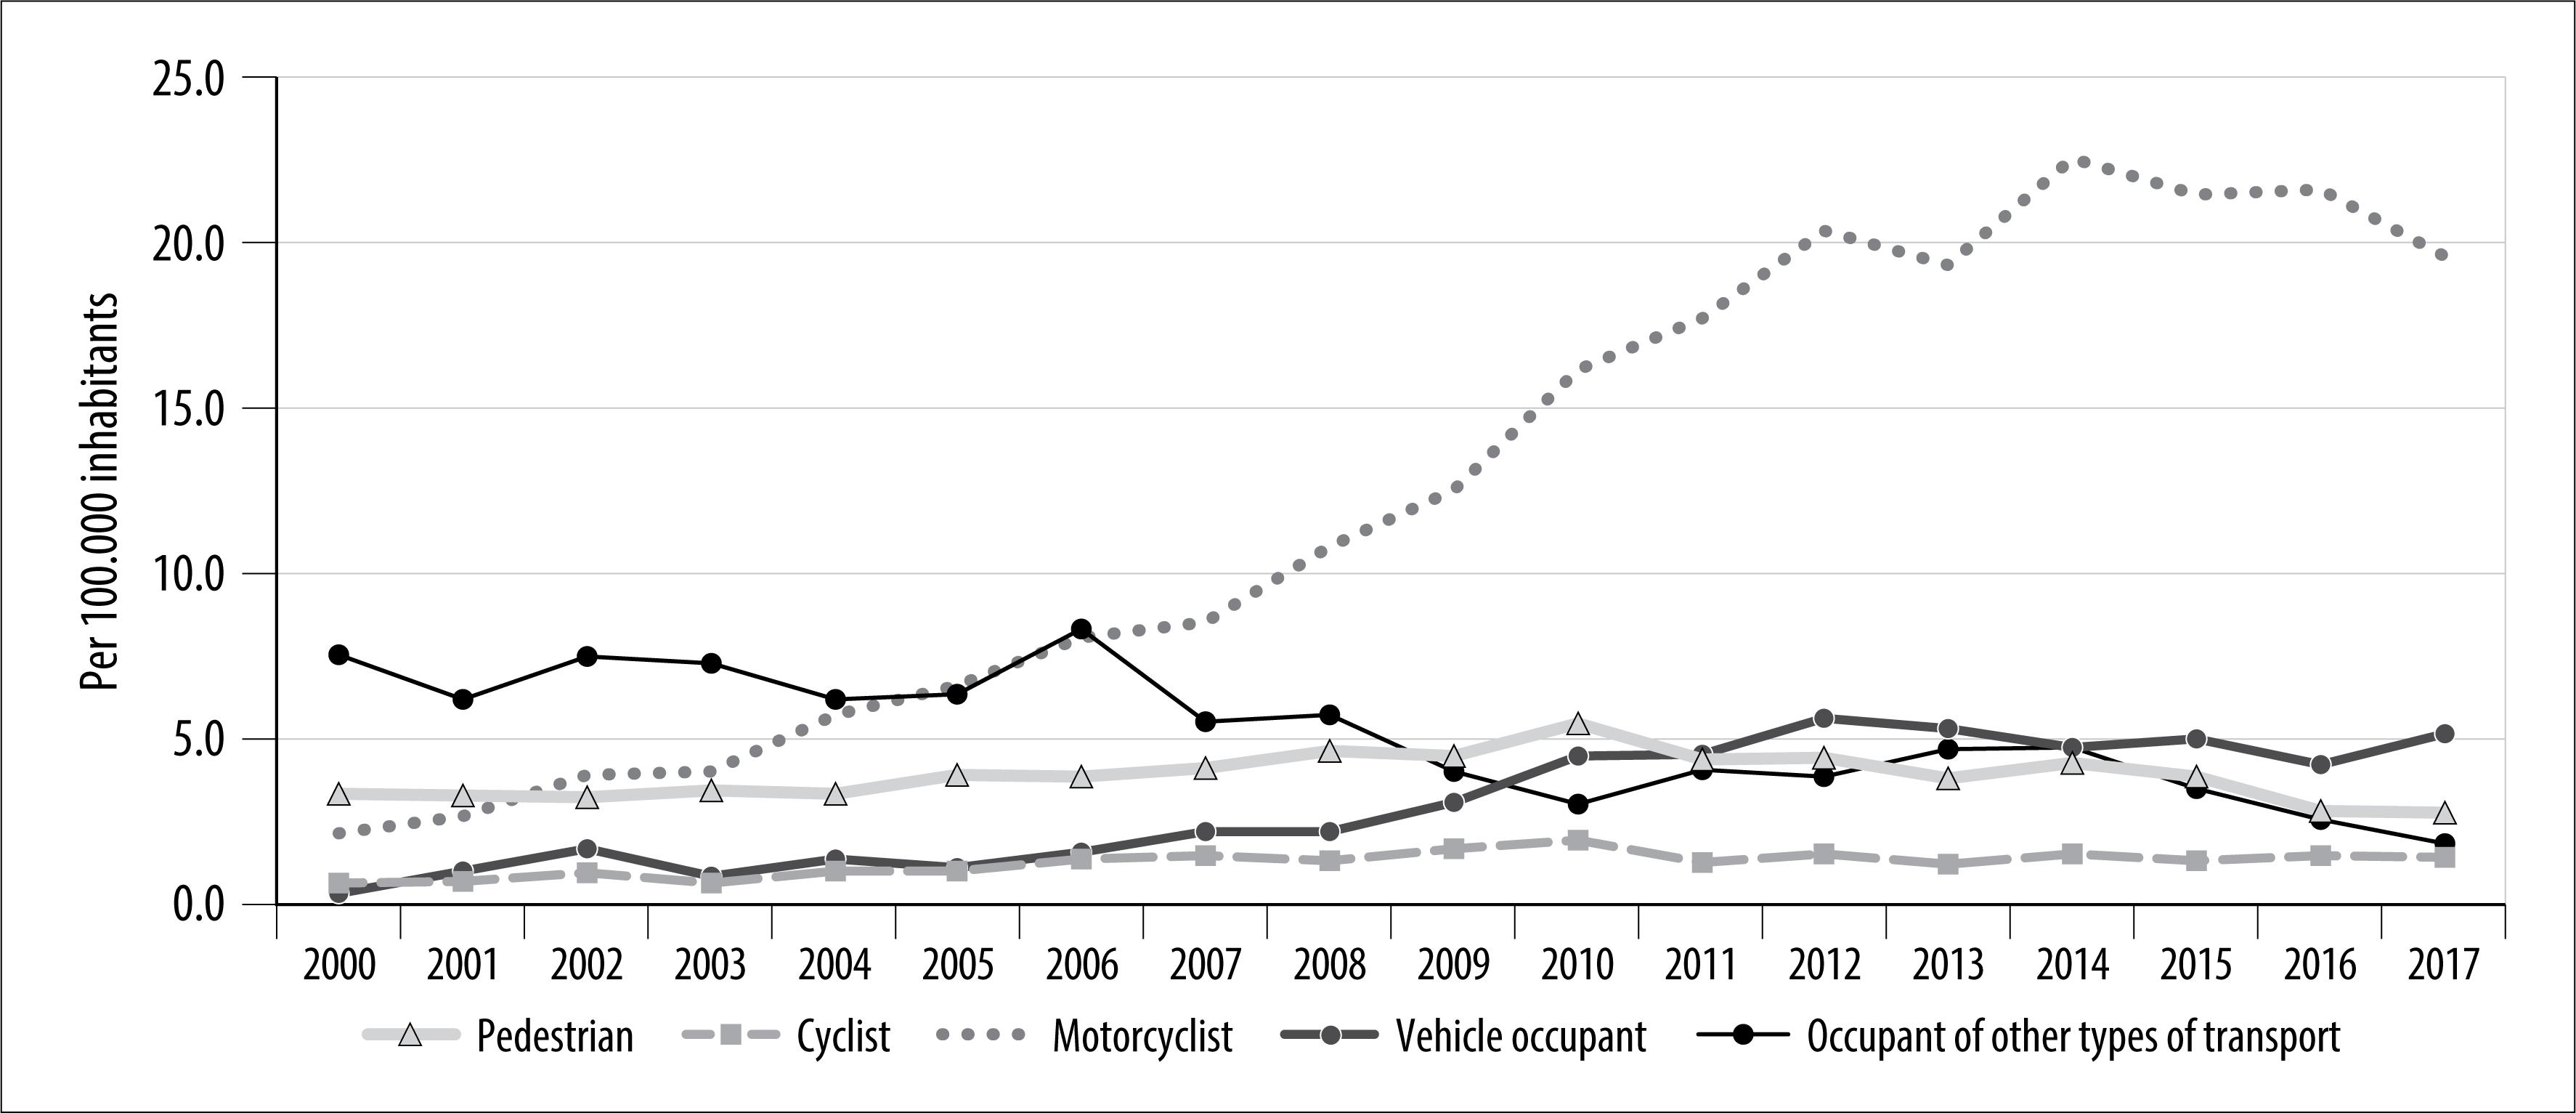
Figure 1 Mortality rate (per 100,000 inhab.) for transport accidents, by type of victim and year of death, Piauí, 2000-2017
Transport accident mortality increased significantly in the period analyzed (APC=6.4% −95%CI 4.3;8.7), both among males (APC=6.5% – 95%CI 4.3;8.7) and females (APC=3.9% – 95%CI 1.9;6.0). With regard to types of victim, there was an increase in vehicle occupants (APC=15.2% – 95%CI 10.5;20.2) and motorcyclists (APC=14.7% – 95%CI 9.7;20.0). Among males, the highest increase was among motorcyclists (APC=14.7% – 95%CI 9.0;20.7). Mortality remained stable for pedestrians and showed a falling trend (APC=-6.6% – 95%CI −9.2;-4.1) for occupants of other types of transport (Table 2).
The evolution of transport accident mortality rates over time, by age group, showed an increasing trend with effect from 10 years of age, in particular among those aged 60 or over (APC=5.8% – 95%CI 3.7;8.0). Motorcyclist mortality showed an average annual increase greater than 10.0% in all age ranges (Table 3).
Table 3 Mortality rate trend (per 100,000 inhab.) for transport accidents, by type of victim and age, Piauí, 2000-2017
| Type of victim and age | Mortality rate | Annual percent change (%) | 95%CIa | p-valorb | Trend | ||
|---|---|---|---|---|---|---|---|
| 2000 | 2017 | ||||||
| Age (in years) | 13.9 | 30.6 | 6.4 | 4.3;8.7 | <0.001 | Rising | |
| ≤9 | 4.7 | 3.3 | -1.5 | -3.6;0.6 | 0.140 | Stable | |
| 10-19 | 7.7 | 13.2 | 4.0 | 0.5;7.5 | 0.026 | Rising | |
| 20-39 | 20.1 | 41.9 | 5.6 | 3.2;7.9 | <0.001 | Rising | |
| 40-59 | 21.1 | 39.8 | 5.2 | 3.0;7.4 | <0.001 | Rising | |
| ≥60 | 19.9 | 45.5 | 5.8 | 3.7;8.0 | <0.001 | Rising | |
| Pedestrian | 3.3 | 2.7 | -0.9 | -4.9;3.4 | 0.667 | Stable | |
| ≤9 | 2.2 | 0.8 | -2.4 | -4.9;0.2 | 0.066 | Stable | |
| 10-19 | 1.9 | 0.5 | -6.6 | -11.5;-1.3 | 0.018 | Falling | |
| 20-39 | 3.1 | 1.7 | -3.4 | -7.8;1.1 | 0.130 | Stable | |
| 40-59 | 5.6 | 3.7 | -1.0 | -3.8;2.0 | 0.498 | Stable | |
| ≥60 | 6.9 | 10.6 | 3.1 | -0.4;6.7 | 0.080 | Stable | |
| Cyclist | 0.6 | 1.4 | 4.7 | 1.8;7.6 | 0.003 | Rising | |
| ≤9 | 0.3 | 0.2 | -5.7 | -10.0;-1.1 | 0.020 | Falling | |
| 10-19 | 0.1 | 0.7 | 3.1 | -1.7;8.2 | 0.189 | Stable | |
| 20-39 | 0.8 | 0.9 | 1.2 | -4.4;7.2 | 0.659 | Stable | |
| 40-59 | 1.1 | 1.9 | 3.9 | -0.7;8.7 | 0.090 | Stable | |
| ≥60 | 0.9 | 4.6 | 13.6 | 10.0;17.5 | <0.001 | Rising | |
| Motorcyclist | 2.1 | 19.6 | 14.7 | 9.7;20. 0 | <0.001 | Rising | |
| ≤9 | 0.0 | 0.6 | 10.1 | 4.5;15.9 | 0.001 | Rising | |
| 10-19 | 1.7 | 9.1 | 12.5 | 7.0;18.3 | <0.001 | Rising | |
| 20-39 | 4.5 | 32.0 | 12.5 | 8.4;16.8 | <0.001 | Rising | |
| 40-59 | 1.9 | 23.1 | 16.1 | 10.7;21.8 | <0.001 | Rising | |
| ≥60 | 0.4 | 19.7 | 21.0 | 13.7;28.7 | <0.001 | Rising | |
| Vehicle occupant | 0.3 | 5.1 | 15.2 | 10.5;20.2 | <0.001 | Rising | |
| ≤9 | 0.0 | 1.4 | 6.0 | -1.6;14.0 | 0.112 | Stable | |
| 10-19 | 0.0 | 2.0 | 9.4 | 2.0;17.3 | 0.015 | Rising | |
| 20-39 | 0.6 | 5.3 | 12.5 | 7.2;18.0 | <0.001 | Rising | |
| 40-59 | 0.6 | 8.4 | 13.2 | 8.3;18.4 | <0.001 | Rising | |
| ≥60 | 0.4 | 7.7 | 18.3 | 13.9;22.9 | <0.001 | Rising | |
| Occupant of other types of transportc | 7.5 | 1.8 | -6.6 | -9.2;-4.1 | <0.001 | Falling | |
| ≤9 | 2.1 | 0.4 | -12.3 | -16.3;-8.2 | <0.001 | Falling | |
| 10-19 | 4.0 | 0.8 | -8.8 | -14.4;-2.7 | 0.008 | Falling | |
| 20-39 | 11.1 | 2.0 | -7.4 | -10.6;-4.1 | <0.001 | Falling | |
| 40-59 | 11.8 | 2.7 | -7.4 | -10.0;-4.7 | <0.001 | Falling | |
| ≥60 | 11.2 | 2.9 | -5.6 | -8.5;-2.6 | 0.001 | Falling | |
a)95%CI: 95% confidence interval.
b)Wald's test.
c)Includes animal-drawn vehicles, railway trains, streetcars, special vehicles and non-specified vehicles.
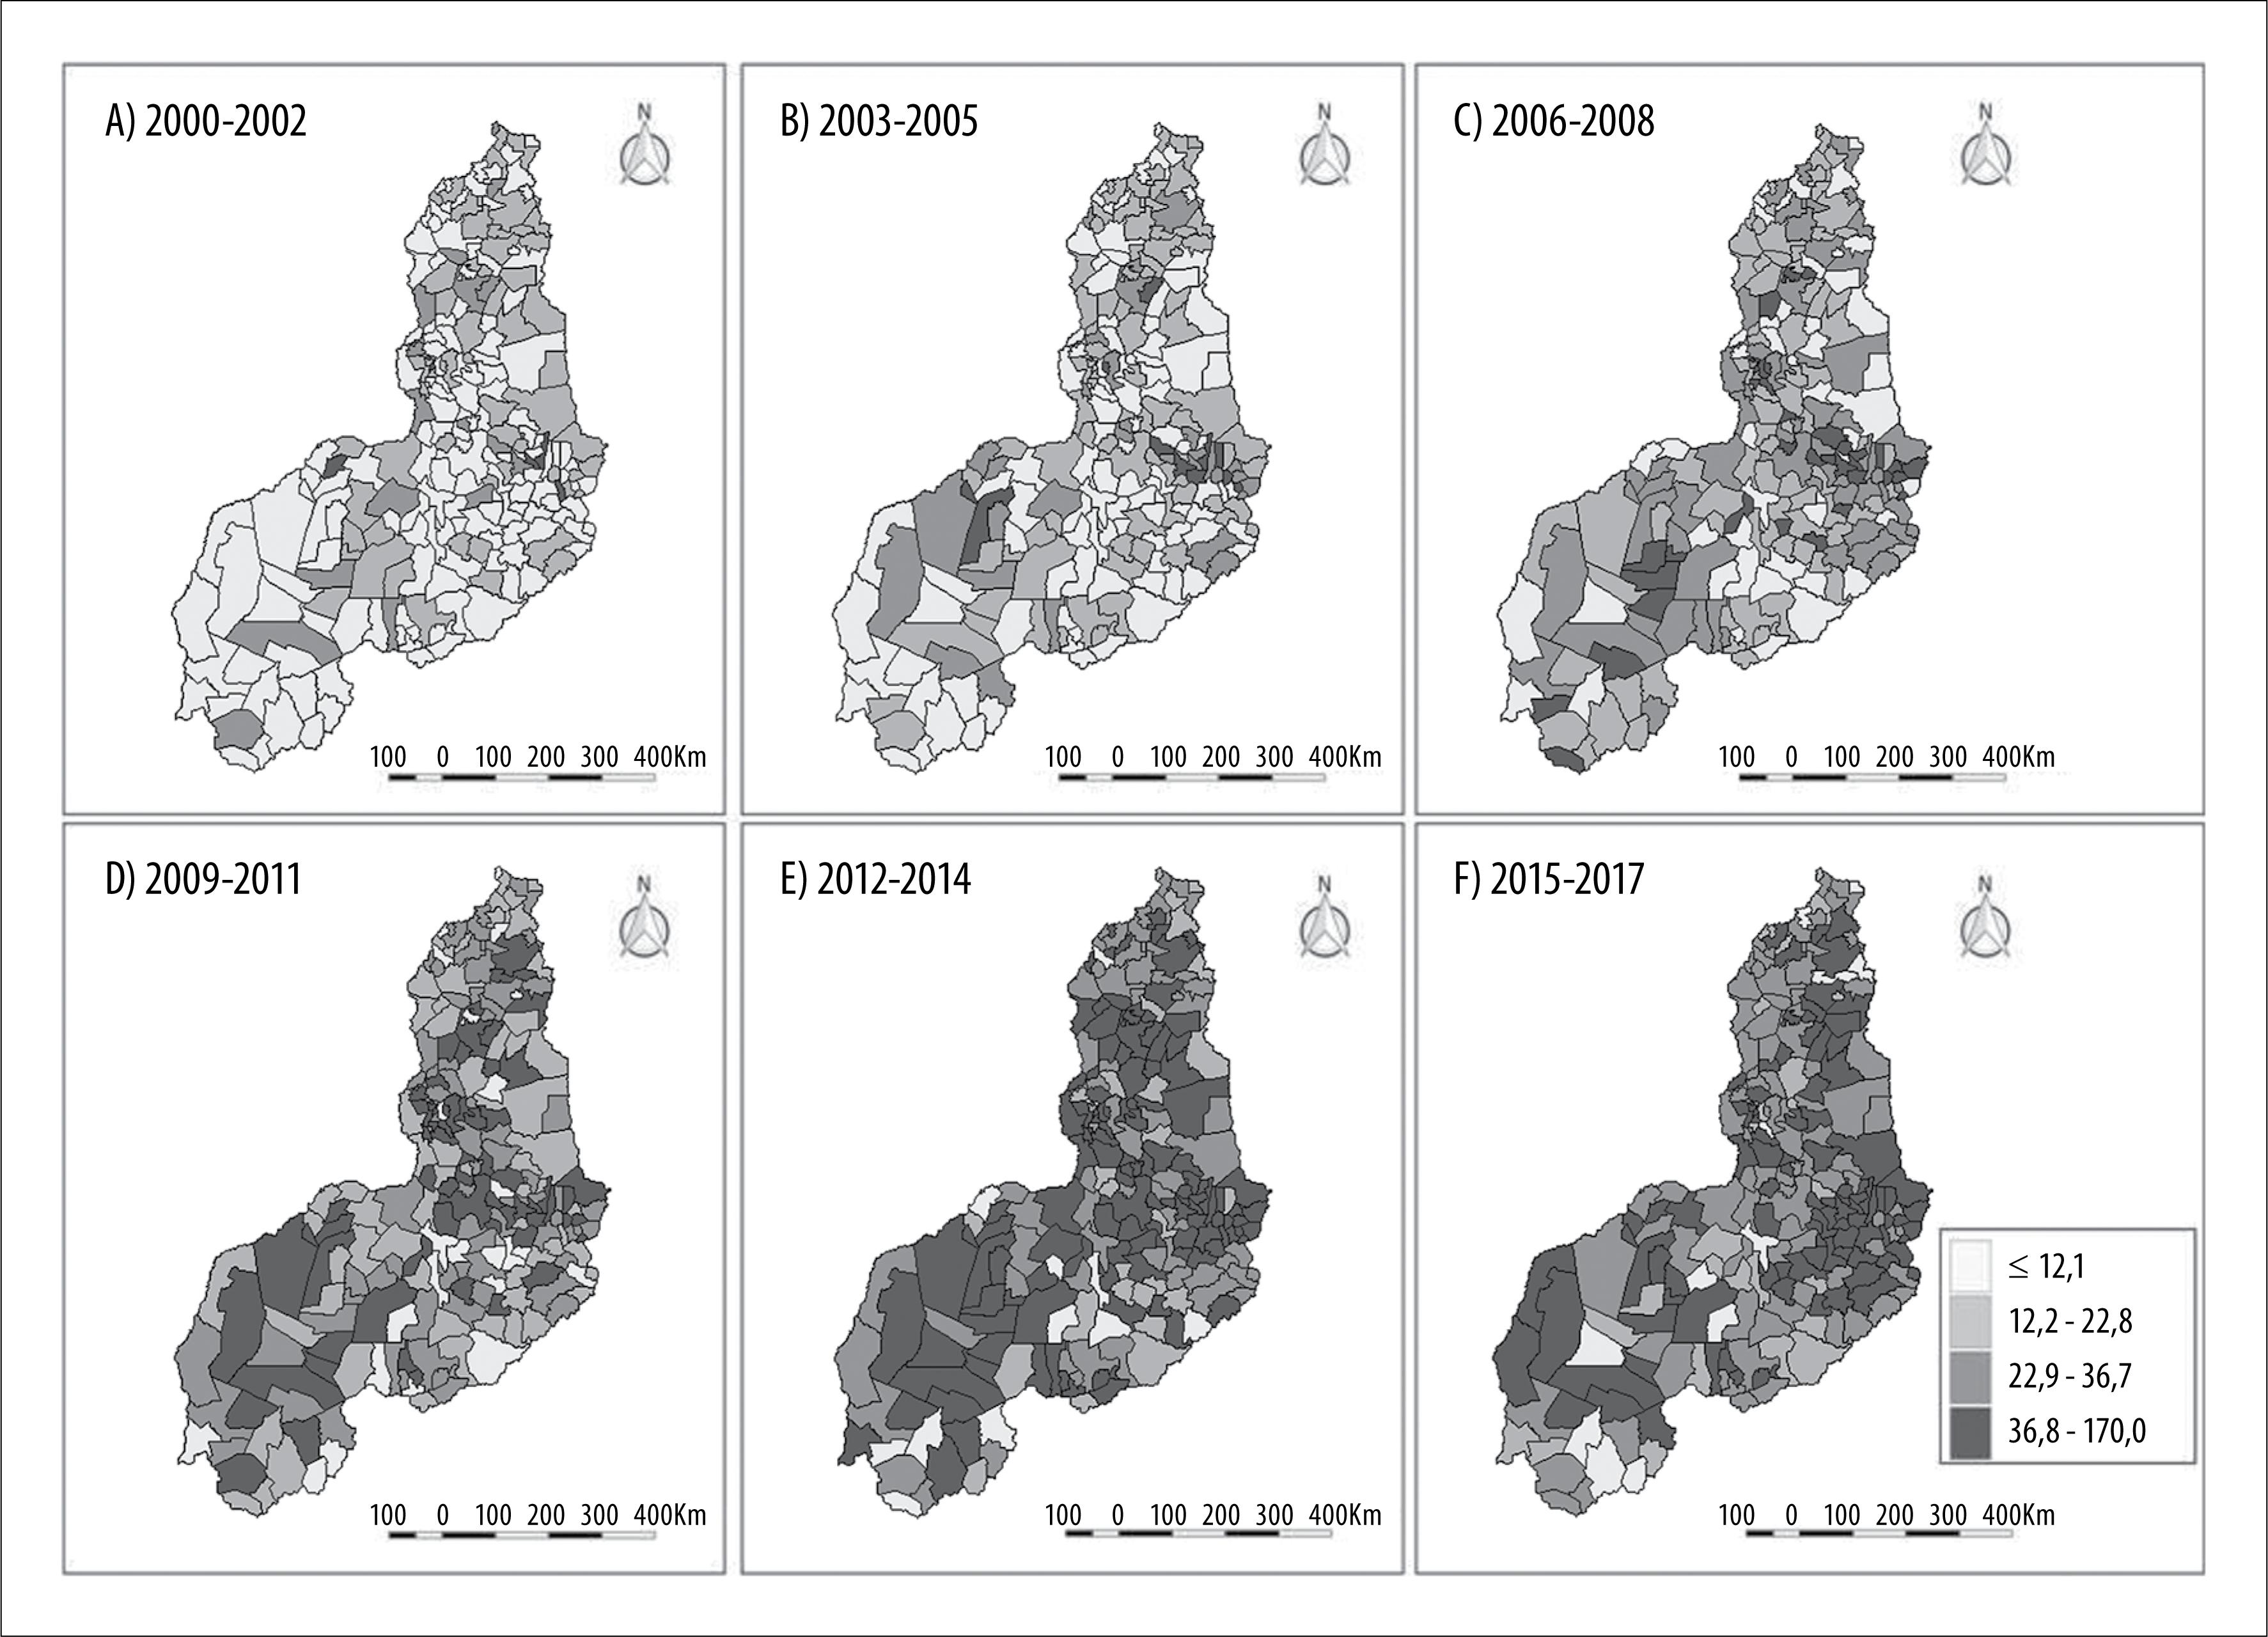
Figure 2 illustrates the geographic distribution and evolution of the average three-yearly transport accident mortality rates according to the 224 municipalities in which those who died resided. There was steep and heterogeneous growth in transport accident deaths in the state. In the 2000-2002 three-year period, only 2.3% of the municipalities had mortality rates above 36.7/100,000 inhab. (Figure 2A), increasing to 54.9% in the 2012-2014 three-year period (Figure 2E). In the last three-year period, 43.3% of municipalities had transport accident mortality rates above 36.7/100,000 inhab. (Figure 2F).
Discussion
In Piauí, transport accident mortality rates increased significantly over the time series analyzed. Male, young adult, motorcyclist and vehicle occupant victims predominated. Risk of death from transport accidents was higher among vehicle occupants and motorcyclists, compared to the other types of victim, especially among the elderly in relation to those who were younger.
The groups socially vulnerable to transport accident mortality identified in this study are similar to those found by other studies.8–11 The World Health Organization12 has highlighted that approximately 73.0% of deaths due to transport accidents occur among males and younger age groups.
Greater occurrence of death being found more frequently among males is explained by their social, cultural and risk-exposure behavior, such as driving at high speed, getting involved in traffic disagreements and abusive alcohol consumption.13
In younger age groups, road transport risk behaviors can be associated with peer group pressure, emotional immaturity, little experience and lack of driving skill. Moreover, impulsiveness found in younger age groups is an important risk factor for getting involved in dangerous situations. Although it is a controversial issue, some studies report that traits of impulsiveness are linked to traffic-related risk behaviors, such as excess speed as an adventure, making wrong decisions, a variety of breaches of the highway code and a variety of transport accidents.14–17
Although deaths from transport accidents were more frequent among the 20-39 age group, this study found a greater increase in annual percent change among the elderly (≥65 years), especially in accidents involving motorcyclists and vehicle occupants. Increased life expectancy in Brazil, together with independence and autonomy of their social and political role, enables more elderly people to spend more time on public thoroughfares. As a result of physiological and organic changes, appearance of chronic diseases and limitations intrinsic to age, elderly people need more time to carry out cognitive and motor tasks which, when associated with stress, worry, irritation and haste, increases risk of involvement in transport accidents, especially as pedestrians and drivers.18 In view of the results found for this population group, there is a need for urgent interventions to reduce transport accident deaths among the elderly.
The State and society should guarantee less violent, more collaborative and supportive traffic for all groups of road users. Longer crossing times for pedestrians at traffic lights, especially in regions with heavy traffic, with accessible pedestrian signals, improvements to the quality and safety of public transport, creation and application of enforcement and educational strategies are effective alternatives for protecting the elderly in relation to road traffic.18
The study also found greater frequency of transport accident deaths among individuals with up to seven years of schooling and of Black race/skin color, similar to the findings of Andrade & Mello-Jorge.19 This reveals social vulnerabilities and inequities. Black and less educated people form the greater part of vulnerable users in the road traffic environment.20
Motorcyclists stand out among the types of victim because of the large number of deaths and their increasing trend. Motorcycles are considered to be a vulnerable means of transport, with direct exposure to impact during accidents: their small size and structure and few protection devices, when compared to cars, for example, or when compared to more resistant forms of urban transport, mean that their occupants are more vulnerable to multiple and serious injuries.21,22
Associated with this, certain political, economic and social aspects need to be mentioned: the political option for individual transport and tax incentives for motorcycle assembly plants; the unemployment situation faced by a large part of the population who have seen the motorcycle as an opportunity to earn income; the increase in the number of jobs that use this means of transport because of its quickness, cheapness and productivity-based payment; as well ease of purchasing motorcycles and their lower maintenance cost.20 The result of the increase in the motorcycle fleet has been the considerable increase in fatal victims of transport accidents.
Other factors need to be considered when studying transport accidents, such as structural shortcomings of public thoroughfares, lack of inspection of driving licenses and safety equipment, as well as speeding, especially in poorer outskirts and rural areas of cities.21 Moreover, law-breaking behavior of motorcyclists, consumption of alcoholic drinks and vulnerability of motorcycles themselves are possible reasons for the intensification of transport accidents involving motorcycles.23
The study made clear the increase and heterogeneity of transport accident mortality rates in no Piauí from 2000 to 2017, similar to findings on the national scenario.3,24 Nevertheless, we found a reduction in risk of transport accident deaths in the last three-year period (2015-2017). A study of the possible effect of the economic crisis and austerity policies in Brazil on outcomes related to external causes,25 suggests that as unemployment and poverty have increased and use of personal vehicles has decreased due to the economic recession, this may have had a substantial impact on the reduction in transport accidents in the 2014-2017 three-year period. This reduction may also have resulted from important strategies and public policies adopted over the course of time. Standing out are laws to restrict drink-driving, especially with the implementation of the so-called Dry Law in 2008 and its enhancement in 2012 including more severe measures, other forms of witness evidence and increased penalties that have enabled progress in reducing alcohol consumption.26–28
Another action that has contributed to the reduction in road transport accidents is the Life in the Traffic Project (Projeto Vida no Trânsito). Implemented by the Ministry of Health in 2011 in several Brazilian state capitals, including Teresina, the capital of Piauí, this project consists of a set of strategies for analyzing and preventing road transport injuries and deaths in partnership with Health and Transport authorities. Some of the project's positive results include the high percentage of achievement of its performance targets, increased speeding control, road blocks to perform breath tests, with a larger number of tests performed and corresponding reduction in the number of positive tests and, as a probable consequence, reduction in mortality per 100,000 inhabitants in some cities.29
Transport accidents are complex events, although the majority of their causes are potentially avoidable through prevention actions and health promotion actions. For this reason, formulating and enforcing legislation in relation to risk factors are important for reducing the occurrence and severity of these events. Reduction of the maximum speed limit and reduced drink-driving, obligatory use of crash helmets, safety belts and safety seats for children, installation and maintenance of adequate road infrastructure, the existence of obligatory safety devices in cars and the rapid and adequate response of health services following accidents are fundamental actions for addressing transport accidents.30
It must be noted that this study has limitations and, therefore, caution must be taken when interpreting its results. Although the coverage and quality of Mortality Information System death records has improved over the years, which certainly explains the reduction of mortality in the ‘occupant of other types of transport’ category, the system still has problems with regard to underreporting and filling in and coding of data.14
Notwithstanding these limitations, this is the first study to analyze the time trend of transport accident mortality in Piauí, presenting the most affected groups and those most exposed to this kind of fatality – Black people, those with little schooling and the elderly –, as well as using spatial analysis to enable visualization of the evolution of road transport mortality in each of the state's municipalities. As such, the information produced by this study enables identification of priority groups and areas for developing strategies to prevent these events, strengthening actions to protect the most vulnerable and to promote safe transport in the state, as well as serving to inform the enhancement of existing policies and assist with the process of preparing, building and applying new means and instruments aimed at promoting safe environments and better quality of life for its population.
Referências
1. James SL, Lucchesi LR, Bisignano C, Castle CD, Dingels ZV, Fox JT, et al. Morbidity and mortality from road injuries: results from the Global Burden of Disease Study 2017. Inj prev [Internet]. 2020 Jan [cited 2020 May 8]:1-11. Available from: https://doi.org/10.1136/injuryprev-2019-043302 [ Links ]
2. World Health Organization - WHO. Death on the roads. Global status report on road safety 2018 [Internet]. Geneva: World Health Organization; 2018 [cited 11 May 2020]. Available from: https://extranet.who.int/roadsafety/death-on-the-roads [ Links ]
3. Morais Neto OL, Montenegro MMS, Monteiro RA, Siqueira Júnior JB, Silva MMA, Lima CM, et al. Mortalidade por acidentes de transporte terrestre no Brasil na última década: tendência e aglomerados de risco. Ciênc Saúde Coletiva [Internet]. 2012 set [citado 2019 jul 03];17(9):2223-36. Disponível em: https://doi.org/10.1590/S1413-81232012000900002 [ Links ]
4. Ministério da Saúde (BR). Departamento de Informática do Sistema Único de Saúde - Datasus. Informações de saúde: sistemas e aplicativos [Internet]. Brasília: Ministério da Saúde; 2019 [citado 2019 jul 02]. Disponível em: http://www.datasus.gov.br [ Links ]
5. Ladeira RM, Malta DC, Morais Neto OL, Montenegro MMS, Soares Filho AM, Vasconcelos CH, et al. Acidentes de transporte terrestre: estudo Carga Global de Doenças, Brasil e unidades federadas, 1990 e 2015. Rev Bras Epidemiol [Internet]. 2017 maio [citado 2019 jul 02];20(Suppl 1):157-70. Disponível em: https://doi.org/10.1590/1980-5497201700050013 [ Links ]
6. Instituto Brasileiro de Geografia e Estatística - IBGE. Cidades@: Piauí [internet]. Rio de Janeiro: Instituto Brasileiro de Geografia e Estatística; 2019 [citado 2020 fev 03]. Disponível em: https://cidades.ibge.gov.br/brasil/pi/panorama [ Links ]
7. Antunes JLF, Cardoso MRA. Uso da análise de séries temporais em estudos epidemiológicos. Epidemiol Serv Saude [Internet]. 2015 jul-set [citado 2019 jun 01];24(3):565-76. Disponível em: https://doi.org/10.5123/S1679-49742015000300024 [ Links ]
8. Silva JK, Rios MA, Amaral TFS, Silva PL. Profile of road transport accidents met by the mobile urgency attendance service. Rev Enferm UFPE On line [Internet]. 2016 Jan [cited 2019 Jul 16];10(1):9-17. Available from: https://doi.org/10.5205/1981-8963-v10i1a10915p9-17-2016 [ Links ]
9. Andrade SSCA, Jorge MHPM. Estimativa de sequelas físicas em vítimas de acidentes de transporte terrestre internadas em hospitais do Sistema Único de Saúde. Rev Bras Epidemiol [Internet]. 2016 mar [citado 2019 jul 20];19(1):100-11. Disponível em: https://doi.org/10.1590/1980-5497201600010009 [ Links ]
10. Mendonça MFS, Silva APSC, Castro CCL. Análise espacial dos acidentes de trânsito urbano atendidos pelo Serviço de Atendimento Móvel de Urgência: um recorte no espaço e no tempo. Rev Bras Epidemiol [Internet]. 2017 dez [citado 2019 jul 16];20(4):727-41. Disponível em: https://doi.org/10.1590/1980-5497201700040014 [ Links ]
11. Mandacarú PMP, Rabelo IVM, Silva MAA, Tobias GC, Morais Neto OL. Óbitos e feridos graves por acidentes de trânsito em Goiânia, Brasil - 2013: magnitude e fatores associados. Epidemiol Serv Saúde [Internet]. 2018 maio [citado 2019 jul 16];27(2):e2017295. Disponível em: https://doi.org/10.5123/s1679-49742018000200001 [ Links ]
12. World Health Organization - WHO. Road traffic injuries [internet]. Geneva: World Health Organization; 2020 [cited 2020 May 17]. Available from: https://www.who.int/news-room/fact-sheets/detail/road-traffic-injuries [ Links ]
13. Preis LC, Lessa G, Tourinho FSV, Santos JLG. Epidemiologia da mortalidade por causas externas no período de 2004 a 2013. Rev Enferm UFPE On Line [Internet]. 2018 mar [citado 2019 jul 15];12(3):716-28. Disponível em: https://doi.org/10.5205/1981-8963-v12i3a230886p716-728-2018 [ Links ]
14. Rocha GG, Nunes BP, Silva EF, Wehrmeister FC. Análise temporal da mortalidade por homicídios e acidentes de trânsito em Foz do Iguaçu, 2000-2010. Epidemiol Serv Saúde [Internet]. 2016 abr-jun [citado 2019 jul 16];25(2):323-30. Disponível em: https://doi.org/10.5123/s1679-49742016000200011 [ Links ]
15. Sauer MTN, Wagner MB. Acidentes de trânsito fatais e sua associação com a taxa de mortalidade infantil e adolescência. Cad Saúde Pública [internet]. 2003 out [citado 2020 maio 17];19(5):1519-26. Disponível em: http://dx.doi.org/10.1590/S0102-311X2003000500030 [ Links ]
16. Araújo MM, Malloy-Diniz LF, Rocha FL. Impulsividade e acidentes de trânsito. Rev Psiquiatr Clín [Internet]. 2009 [citado 2020 maio 09];36(2):60-8. Disponível em: https://doi.org/10.1590/S0101-60832009000200004 [ Links ]
17. Romer D. Adolescent risk taking, impulsivity, and brain development: implications for prevention. Dev Psychobiol [Internet]. 2010 Apr [citado 2020 May 10];52(3):263-76. Available from: https://dx.doi.org/10.1002%2Fdev.20442 [ Links ]
18. Santos AMR, Avelino FVSD, Claudino MAD, Figueiredo MLF, Rocha SSR, Silva TCA. Acidentes de trânsito com idosos: demandas e responsabilidades sociais e governamentais. REME [Internet]. 2018 jun [citado 2019 jul 20];22:e-1108. Disponível em: http://www.dx.doi.org/10.5935/1415-2762.20180036 [ Links ]
19. Andrade SSCA, Mello-Jorge MLP. Mortality and potential years of life lost by road traffic injuries in Brazil, 2013. Rev Saúde Pública [Internet]. 2016 Dec [cited 2019 Aug 1];50:59. Available from: https://doi.org/10.1590/S1518-8787.2016050006465 [ Links ]
20. Rios PAA, Mota ELA, Ferreira LN, Cardoso JP, Ribeiro VM, Souza BS. Fatores associados a acidentes de trânsito entre condutores de veículos: achados de um estudo de base populacional. Ciênc Saúde Coletiva [Internet]. 2020 mar [citado 2020 maio 19];25(3):943-55. Disponível em: https://doi.org/10.1590/1413-81232020253.1192201 [ Links ]
21. Martins ET, Boing AF, Peres MA. Mortalidade por acidentes de motocicleta no Brasil: análise de tendência temporal, 1996-2009. Rev Saúde Pública [Internet]. 2013 out [citado 2019 ago 01];47(5):931-41. Disponível em: https://doi.org/10.1590/S0034-8910.2013047004227 [ Links ]
22. Mascarenhas MDM, Souto RMCV, Malta DC, Silva MMA, Lima CM, Montenegro MMS. Características de motociclistas envolvidos em acidentes de transporte atendidos em serviços públicos de urgência e emergência. Ciênc Saúde Coletiva [Intenet]. 2016 dez [citado 2019 ago 02];21(12):2661-3671. Disponível em: https://doi.org/10.1590/1413-812320152112.24332016 [ Links ]
23. Lima MLC, Cesse EAP, Abath MB, Oliveira Júnior FJM. Tendência de mortalidade por acidentes de motocicleta no Estado de Pernambuco, no período de 1998 a 2009. Epidemiol Serv Saúde [Internet]. 2013 jul-set [citado 2019 ago 05];22(3):395-402. Disponível em: http://dx.doi.org/10.5123/S1679-49742013000300004 [ Links ]
24. Mascarenhas MDM, Monteiro RA, Sá NNB, Gonzaga LAA, Neves ACM, Roza DL, et al. Epidemiologia das causas externas no Brasil: mortalidade por acidentes e violências no período de 2000 a 2009. In: Ministério da Saúde (BR). Secretaria de Vigilância em Saúde. In: Ministério da Saúde (BR). Secretaria de Vigilância em Saúde. Saúde Brasil 2010: uma análise da situação de saúde e de evidências selecionadas de impacto de ações de vigilância em saúde [Internet]. Brasília: Ministério da Saúde; 2011 [citado 2020 ago 11]. p. 225-249. Disponível em: https://pt.slideshare.net/nadiaecb/sade-brasil-2010 [ Links ]
25. Machado DB, Pescarini JM, Araújo LFSC, Barreto ML. Austerity policies in Brazil may affect violence related outcomes. Ciênc Saúde Coletiva [Internet]. 2019 Dec [cited 2020 May 09];24(12):4385-94. Available from: https://doi.org/10.1590/1413-812320182412.07422019 [ Links ]
26. Brasil. Casa Civil. Lei n° 11.705, de junho de 2008. Altera a Lei no 9.503, de 23 de setembro de 1997, que ‘institui o Código de Trânsito Brasileiro’, e a Lei no 9.294, de 15 de julho de 1996, que dispõe sobre as restrições ao uso e à propaganda de produtos fumígeros, bebidas alcoólicas, medicamentos, terapias e defensivos agrícolas, nos termos do § 4o do art. 220 da Constituição Federal, para inibir o consumo de bebida alcoólica por condutor de veículo automotor, e dá outras providências [Internet]. Diário Oficial da União, Brasília (DF), 2008 jun 20 [citado 2020 ago 11];Seção 1. Disponível em: http://www.planalto.gov.br/ccivil_03/_ato2007-2010/2008/lei/l11705.htm [ Links ]
27. Brasil. Casa Civil. Lei n° 12.760, de 20 de dezembro de 2012. Altera a Lei n° 9.503, de 23 de setembro de 1997, que institui o Código de Trânsito Brasileiro [Internet]. Diário Oficial da União, Brasília (DF), 2012 dez 21 [citado 2020 ago 11]. Disponível em: http://www.planalto.gov.br/ccivil_03/_Ato2011-2014/2012/Lei/L12760.htm [ Links ]
28. Malta DC, Berna RTI, Silva MMA, Silva Júnior JB, Reis AAC. Consumo de bebidas alcoólicas e direção de veículos, balanço da lei seca, Brasil 2007 a 2013. Rev Saúde Pública [Internet]. 2014 ago [citado 2019 ago 07];48(4):692-966. Disponível em: http://dx.doi.org/10.1590/S0034-8910.2014048005633 [ Links ]
29. Morais Neto OL, Silva MMA, Lima CM, Malta DC, Silva Junior JB. Projeto Vida no Trânsito: avaliação das ações em cinco capitais brasileiras, 2011-2012. Epidemiol Serv Saúde [Internet]. 2013 set [citado 2020 maio 19];22(3):373-82. Disponível em: http://dx.doi.org/10.5123/S1679-49742013000300002 [ Links ]
30. World Health Organization - WHO. Global status report on road safety 2018: summary [Internet]. Geneva: World Health Organization; 2018 [cited 2020 Aug 11]. 16 p. Available from: https://www.who.int/violence_injury_prevention/road_safety_status/2018/en/ [ Links ]
Received: February 08, 2020; Accepted: July 09, 2020
 This content is licensed under a Creative Commons Attribution 4.0 International License.
