


Servicios Personalizados
Revista

Articulo
 texto en
  Inglés (pdf)
 Articulo en XML
 Referencias del artículo
 Curriculum ScienTI
 Enviar articulo por email
Indicadores
-
 Citado por SciELO
Links relacionados
-
 Similares en
SciELO
Similares en
SciELO
Compartir

 Permalink
Epidemiologia e Serviços de Saúde
versión impresa ISSN 1679-4974versión On-line ISSN 2237-9622
Epidemiol. Serv. Saúde vol.29 no.5 Brasília 2020 Epub 02-Nov-2020
http://dx.doi.org/10.1590/s1679-49742020000500018
Original Article
Adherence to physical contact restriction measures and the spread of COVID-19 in Brazil
1Fundação Instituto Oswaldo Cruz, Instituto de Comunicação e Informação Científica e Tecnológica em Saúde, Rio de Janeiro, RJ, Brazil
2Universidade Federal de Minas Gerais, Escola de Enfermagem, Belo Horizonte, MG, Brazil
3Universidade Estadual de Campinas, Faculdade de Ciências Médicas, Campinas, SP, Brazil
4Universidade Federal de Ouro Preto, Escola de Medicina, Saúde Mental e Coletiva, Ouro Preto, MG, Brazil
5Universidade Federal de Minas Gerais, Faculdade de Medicina, Belo Horizonte, MG, Brazil
6Universidade de São Paulo, Escola de Saúde Pública, São Paulo, SP, Brazil
7Universidade Federal de Sergipe, Departamento de Educação Física, São Cristóvão, SE, Brazil
Objective:
To analyze the adherence of the population to physical contact restriction measures and the spread of COVID-19 in Brazil.
Methods:
This was a web-based health survey carried out from April 24 to May 24 2020 using a chain sampling procedure. Intensity of adherence to physical contact restriction measures was analyzed according to sociodemographic characteristics, using logistic regression models to investigate associations with ‘No/little adherence’.
Results:
Of the 45,161 participants, 74.2% (73.8;74.6%) reported intense adherence to the measures. The group that did not adhere to the measures was characterized by men (31.7%), those aged 30 to 49 (36.4%), those with low education levels (33.0%), those who worked during the pandemic (81.3%), those resident in the North (28.1%) and Midwest (28.5%) regions of the country. In Brazil as a whole, there was a decrease in COVID-19 daily growth rates, from 45.4% to 5.0%.
Conclusion:
A large part of the Brazilian population adhered to physical contact restriction measures, which possibly contributed to decreasing the spread of COVID-19.
Keywords: Coronavirus; Quarantine; Pandemic; Epidemiology; Brazil
Introduction
A COVID-19 outbreak which began in Wuhan, the capital and largest city of Hubei Province, China, in December 2019, spread rapidly all over the world. The explosive increase in cases had affected 5,934,936 people and led to 376,166 deaths worldwide between December 2019 and the end of May 2020.1 Brazil's first COVID-19 case was identified on February 26th and by the end of May 514,200 cases and 29,310 deaths had been recorded nationwide.2
On January 30th 2020, the World Health Organization (WHO) declared the COVID-19 epidemic to be a ‘public health emergency of international concern’ (PHEIC), and on March 11th it was declared to be a pandemic.3 Noting that strategies adopted thus far were not sufficient to contain the spread of the disease, WHO recommended the countries to put more severe Public Health measures in place, including timely diagnosis, case isolation and community quarantine.4
Interventions aiming to restrict contact with other people and hold back the spread of the epidemic are known as physical or social contact restriction measures.
Quarantine had been adopted previously to control severe acute respiratory syndrome (SARS) and Middle East respiratory syndrome (MERS) epidemics, while entire villages in many West African countries were placed in quarantine during the Ebola PHEIC in 2014.5
In order to avoid health system overloading6 and delay the spread of COVID-19, several countries have implemented physical or social contact restriction measures, ranging from closing schools and commercial establishments to national quarantine.7 The first physical contact restriction measures were adopted in China and were massive, imposing quarantine on entire cities.8 By May 2020, a large part of the global population was under some form of restriction with the aim of avoiding gatherings of people and crowding.9
Interventions aiming to restrict contact with other people and hold back the spread of the epidemic are known as physical or social contact restriction measures. ‘Quarantine’ consists of isolating healthy individuals who have had contact with infected patients or have been in regions with outbreaks of the disease, and lasts for the maximum COVID-19 incubation period. Lockdown is the most rigorous measure, imposed by the State, and consists of restricting the circulation of the population in public places to the maximum, whereby people are only allowed to go out of their homes for essential reasons, such as going to a medical appointment, a drugstore or a supermarket.10
In February 2020, the advent of the COVID-19 pandemic in Brazil also led to a series of initiatives and recommendations for protecting people. As soon as the first COVID-19 deaths were recorded, schools and unessential businesses were closed, workers were advised to work from home, and some cities and states closed their city limits and borders, respectively.
In April 2020, a web-based survey called ‘ConVid – Behavior Survey’ was prepared with the aim of describing changes in the lives of Brazilians during the novel coronavirus pandemic. The objective of this article was to analyze the population's adherence to physical contact restriction measures and to analyze the spread of COVID-19 in Brazil.
Methods
The ‘ConVid – Behavior Survey’11 was conducted nationally by the Fundação Instituto Oswaldo Cruz (Fiocruz) in partnership with the Federal University of Minas Gerais (UFMG) and the Campinas State University (Unicamp), between April 24th and May 24th 2020. It was a health survey, using a self-administered online questionnaire filled in via cell phone or computer with internet access (https://convid.fiocruz.br/),11 to assess changes in the lives of Brazilians following the arrival of the COVID-19 pandemic in the country.
The questions referred to sociodemographic characteristics and changes in lifestyle, routine activities, state of mind, health status and access to health services during the pandemic. We used questions that had been validated in health surveys conducted previously in Brazil, such as the World Health Survey,12 the National Health Survey13 and the study on the ‘Quality of Life of Patients on Antiretroviral Therapy in Brazil’.14
The questionnaire was prepared using the Research Electronic Data Capture (RedCap) application.15 The survey information was gathered daily, via internet, and stored on a server at the Fiocruz Institute of Health Communication and Scientific and Technological Information. The inclusion criteria for taking part in the survey were being 18 years old or over and living in Brazil during the COVID-19 pandemic. Further information about the ‘ConVid – Behavior Survey’, as well as the full questionnaire proposed, can be found on the survey website (https://convid.fiocruz.br/).11
Participants were invited by means of a chain sampling procedure. In the first stage of this process, the study researchers chose a further 200 researchers from different Brazilian states. In addition, each study researcher selected 20 people from their social network, totaling around 500. The people chosen in the first stage were called “seeds”, i.e. they were responsible for unfolding the network of invited participants. After answering the questionnaire, the “seeds” formed the first wave of the recruitment chain. The “seeds” then sent the survey link to at least 12 people from their social networks, using stratification by sex, age group (in years: 18-39; 40-59; 60 or over) and level of schooling (incomplete high school education or less; complete high school education or above); i.e. they invited at least 3 people from each of the 12 strata. The people invited by the “seeds” comprised the second wave of the recruitment chain. Each person in the second wave was requested to invite at least a further three people from their social networks, and so on. By the end of the information collection period – April 24th to May 24th 2020 –, the total sample was comprised of 45,161 people.
The study outcome was defined by the following question contained in the questionnaire:
During the COVID-19 pandemic, with what intensity have you had (or are you still having) restricted contact with other people?
This question had the following (excluding) answer options:
I didn't change anything, I led life as usual.
I sought to take care, to keep my distance from people, to reduce contact a little, I sought not to visit elderly people, but I carried on working and going out.
I stayed at home and only went out to shop at the supermarket and drugstore.
I stayed strictly at home and only went out if I needed health care.
Intensity of physical contact restriction was classified into the following categories: (1) no restriction, (2) little restriction, (3) intense restriction or (4) total restriction, corresponding to answer options 1 to 4 as described above. In order to characterize people who did not adhere to physical contact restriction measures, the outcome was considered to be answer options 1 and 2 together, i.e., ‘No or little physical contact restriction’.
The independent variables taken into consideration were:
sex (male; female);
age group (in years: 18-29; 30-39; 40-49; 50-59; 60 or over);
race/skin color (White; non-White);
schooling (incomplete high school education; complete high school education; complete higher education);
work situation during the pandemic (did not work; worked; worked from home); and
Brazilian macro-region.
The data were checked for duplication (when all answers were exactly the same) and for missing data. Duplicated questionnaires and questionnaires with data missing for the variables used for calibration (4.3%), i.e., with no information about the Federative Unit, sex, age, race/skin color or schooling, were excluded from the database.
The sample was calibrated taking as a reference data from the 2019 National Household Sample Survey,16 conducted by the Brazilian Institute of Geography and Statistics (IBGE), in order to obtain the same proportional distribution by Federative Unit, sex, age group, race/skin color and schooling for the Brazilian population.
In order to test association with the ‘No or little physical contact restriction’ outcome, we estimated odds ratios (OR) and respective 95% confidence intervals (95%CI), using logistic regression. The effects of the covariate categories were verified by the OR statistical test taking a 5% significance level. The analyses were performed using the Statistical Package for the Social Sciences (SPSS) computer program, version 2.17
In order to verify the increase in the number of cases in Brazil, we described the cumulative number of COVID-19 cases recorded in Brazil with effect from February 26th 2020, the date on which the country's first infected case was notified, until the end of May 2020. The source of this information was the MonitoraCovid-19 system.2
Logarithmic scale graphs were prepared for the time series of the cumulative number of recorded COVID-19 cases per day, from February 26th to May 30th 2020, for Brazil as a whole and for each of the country's macro-regions. Logarithmic transformation enables the slowing down of the spread of the epidemic to be visualized. If it does not slow down, the logarithmic curve is linear, represented by a straight line. If the rate does slow down, the epidemic curve becomes inclined or “flattened”.
The percentage growth rate of the number of cumulative daily COVID-19 cases for each week from March 4th to May 26th 2020 was also calculated. In order to do this, we estimated the angular coefficient (β) of the linear regression between the logarithm of the cumulative number of cases and the day of the week (varying from 1 to 7). The percentage growth rate per day, week after week, was calculated as follows:
The study project was approved by the National Health Council National Research Ethics Commission on April 19th 2020: Opinion No. 3.980.277. All the answers to the questionnaire were anonymous and participants were not identified in any way. After reading the Free and Informed Consent advice, potential participants answered whether or not they agreed to taking part in the survey. Access to the MonitoraCovid-19 System data is unrestricted.2
Results
In all, 47,184 people agreed to take part in the survey. After excluding questionnaires with data missing in the variables used for calibration (4.3%), a total of 45,161 questionnaires were apt for analysis.
Table 1 shows the results relating to the intensity of restriction of contact with other people, by sex and age group. Out of the total sample, 1.5% led their lives as usual, with no physical contact restrictions, while 24.2% had little restriction, 59.2% had intense restriction and 15.1% had total restriction of contact with other people. Greater adherence was found among females, when compared to males; and among younger people (18-29 years old) and the elderly (60 years old or over), regardless of sex, when compared to individuals in the in-between age groups. The highest percentage of total physical contact restriction (going out only when health care was needed) was found among elderly women (39.1%), while the lowest percentage was found among men aged 30-39 (8.2%). Intense adherence to physical contact restriction reached a higher proportion among women aged 18-29 (71.3%). The highest percentages of those who had no or little contact restriction with other people corresponded to men aged 30-49, for whom the estimates were greater than 40.0%.
Table 1 Distribution (%) of study participants by sex and age group, according to intensity of physical contact restriction during the COVID-19 pandemic, Brazil, April 24th – May 24th 2020*
| Sex | Age group (in years) | n | Intensity of physical contact restriction (%) | |||
|---|---|---|---|---|---|---|
| No restrictiona | Little restrictionb | Intense restrictionc | Total restrictiond | |||
| Total of the sample | 44,914 | 1.5 | 24.2 | 59.2 | 15.1 | |
| Male | 18-29 | 5,511 | 2.8 | 19.5 | 64.8 | 12.9 |
| 30-39 | 4,383 | 2.8 | 40.0 | 49.0 | 8.2 | |
| 40-49 | 3,782 | 1.7 | 43.2 | 46.5 | 8.6 | |
| 50-59 | 3,207 | 2.0 | 30.8 | 57.3 | 9.9 | |
| ≥60 | 3,960 | 2.8 | 16.2 | 60.7 | 20.3 | |
| Female | 18-29 | 5,601 | 0.4 | 16.3 | 71.3 | 12.0 |
| 30-39 | 5,006 | 0.4 | 30.5 | 59.8 | 9.3 | |
| 40-49 | 4,373 | 1.3 | 27.6 | 60.2 | 10.9 | |
| 50-59 | 3,950 | 0.9 | 21.0 | 62.0 | 16.1 | |
| ≥60 | 5,142 | 0.8 | 6.1 | 54.0 | 39.1 | |
| Total | 18-29 | 11,112 | 1.6 | 17.9 | 68.1 | 12.4 |
| 30-39 | 9,389 | 1.5 | 34.9 | 54.8 | 8.8 | |
| 40-49 | 8,154 | 1.5 | 34.8 | 53.9 | 9.8 | |
| 50-59 | 7,157 | 1.4 | 25.4 | 59.9 | 13.3 | |
| ≥60 | 9,102 | 1.7 | 10.5 | 56.9 | 30.9 | |
a)No restriction: changed nothing, led life as usual.
b)Little restriction: sought to take care, to keep distance from people, reduced contact a little, sought not to visit elderly people, but continued to go out.
c)Intense restriction: stayed at home, only going out to shop at the supermarket or drugstore.
d)Total restriction: stayed strictly at home, only going out if needed health care.
*Cases with missing data were excluded.
Table 2 shows the differences in adherence to physical contact restriction measures according to the country's regions. When considering intense restriction and total restriction of contacts with other people, the highest proportions related to the Southeast region, with 60.1% (59.4;60.8) and 15.7% (15.2;16.2), respectively. Taking all the macro-regions, the highest proportions related to people who had intense physical contact restriction, varying from 57.0% (55.3;58.6), in the Northern region, to 60.1% (59.4;60.8) in the Southeast region. The highest percentage of total physical contact restriction was found in the Midwest region: 12.3% (11.1;13.5).
Table 2 Distribution (%) of study participants according to intensity of physical contact restriction during the COVID-19 pandemic, Brazil and macro-regions, April 24th – May 24th 2020*
| Macro-region | n | Intensity of physical contact restriction (%) | |||
|---|---|---|---|---|---|
| No restrictiona | Little restrictionb | Intense restrictionc | Total restrictiond | ||
| Total of the sample | 44,914 | 1.5 | 24.2 | 59.2 | 15.1 |
| North | 3,431 | 0.6 | 27.5 | 57.0 | 15.0 |
| Northeast | 11,205 | 1.5 | 24.7 | 58.5 | 15.2 |
| Southeast | 20,494 | 1.5 | 22.8 | 60.1 | 15.7 |
| South | 6,752 | 1.6 | 25.7 | 58.5 | 14.2 |
| Midwest | 3,032 | 3.3 | 25.2 | 59.2 | 12.3 |
a)No restriction: changed nothing, led life as usual.
b)Little restriction: sought to take care, to keep distance from people, reduced contact a little, sought not to visit elderly people, but continued to go out.
c)Intense restriction: stayed at home, only going out to shop at the supermarket or drugstore.
d)Total restriction: stayed strictly at home, only going out if needed health care.
*Cases with missing data were excluded.
Table 3 analyzes the associations between the sociodemographic characteristics and the ‘No or little physical contact restriction’ outcome. The variable most associated with the outcome variable was work situation: among those who worked during the pandemic, 81.3% did not adhere to the physical contact restriction measures, while among those who did not work, this percentage was just 10.4%. When comparing these two work situation categories, the odds ratio (OR) was 37.2 (34.8;39.7). With regard to schooling, people with incomplete high school education respected the restriction measures less than those who had higher education qualifications (OR=1.9 [1.8;2.1]). As for age groups, individuals aged 30-39 and 40-49 were 4 times more likely not to have physical contact restriction, when compared to the elderly. Men were almost twice as likely as women (OR=1.8 [1.7;1.8]) to not have any restriction or little restriction of physical contact. With regard to race/skin color, the differences were less. Notwithstanding, people who reported being White had significantly greater adherence to physical contact restriction.
Table 3 Sociodemographic characteristics study participants and association with ‘No or little adherence to physical contact restriction’ during the COVID-19 pandemic, Brazil, April 24th – May 24th 2020
| Sociodemographic characteristics | Category | Na | % | No/little adherence (%) | ORb | 95%CIc | p-valued |
|---|---|---|---|---|---|---|---|
| Total of the sample | 44,914 | – | 25.8 | – | – | – | |
| Sex | Male | 20,842 | 46.4 | 31.7 | 1.79 | 1.69;1.85 | <0.001 |
| Female | 24,072 | 53.6 | 20.6 | 1.00 | – | – | |
| Age group | 18-29 | 11,112 | 24.7 | 19.5 | 1.74 | 1.61;1.88 | <0.001 |
| 30-39 | 9,389 | 20.9 | 36.4 | 4.12 | 3.82;4.45 | <0.001 | |
| 40-49 | 8,154 | 18.2 | 36.3 | 4.01 | 3.79;4.43 | <0.001 | |
| 50-59 | 7,157 | 15.9 | 26.8 | 2.63 | 2.43;2.86 | <0.001 | |
| ≥60 | 9,102 | 20.3 | 12.2 | 1.00 | – | – | |
| Race/skin color | White | 20,408 | 45.4 | 23.6 | 0.81 | 0.78;0.85 | <0.001 |
| Non-White | 24,506 | 54.6 | 27.6 | 1.00 | – | – | |
| Level of schooling | Incomplete high school education | 4,909 | 11.0 | 33.0 | 1.91 | 1.76;2.08 | <0.001 |
| Complete high school education | 32,574 | 72.5 | 25.9 | 1.36 | 1.28;1.44 | <0.001 | |
| Complete higher education | 7,431 | 16.5 | 20.5 | 1.00 | – | – | |
| Work situation during the pandemic | Did not work | 24,121 | 54.3 | 10.4 | 1.00 | – | – |
| Worked | 9,269 | 20.8 | 81.3 | 37.17 | 34.78;39.73 | <0.001 | |
| Word from home | 11,047 | 24.9 | 13.1 | 1.29 | 1.21;1.39 | <0.001 | |
| Macro-region | North | 3,431 | 7.7 | 28.1 | 1.22 | 1.13;1.33 | <0.001 |
| Northeast | 11,205 | 24.9 | 26.2 | 1.11 | 1.05;1.17 | <0.001 | |
| Southeast | 20,494 | 45.6 | 24.2 | 1.00 | – | – | |
| South | 6,752 | 15.0 | 27.3 | 1.17 | 1.10;1.25 | <0.001 | |
| Midwest | 3,032 | 6.8 | 28.5 | 1.24 | 1.15;1.36 | <0.001 | |
a)Excluded or cases with missing values.
b)OR: odds ratio.
c)95%CI: 95% confidence interval.
d)Statistical test of odds ratio (OR) being significantly greater than 1.00.
When comparing the Brazilian macro-regions, the Southeast was the region with the lowest proportion of people with no or little adherence to the physical contact restriction measures (24.2%), while the highest estimates were found in the Midwest and Northern regions, both of which were over 28.0%. When compared to the Southeast region, all the other regions had significantly greater positive differences (Table 3).
Figure 1 shows the epidemic curve (using a logarithmic scale) of the cumulative number of COVID-19 cases, from the beginning of the pandemic to the end of May. The curve can clearly be seen to have flattened following the adoption of physical contact restriction measures in Brazil. With regard to the country's regions, the Southeast and the Northeast had the highest number of cases. Although the epidemic started a little later in the Northeast, greater deceleration in the Southeast resulted in the cumulative number of cases being similar between the two regions. The South and Midwest regions had the lowest number of cumulative cases, and the South, in particular, had the lowest rate of growth. Epidemic curve flattening was least in the Northern region, where the pandemic arrived (or was detected) later.
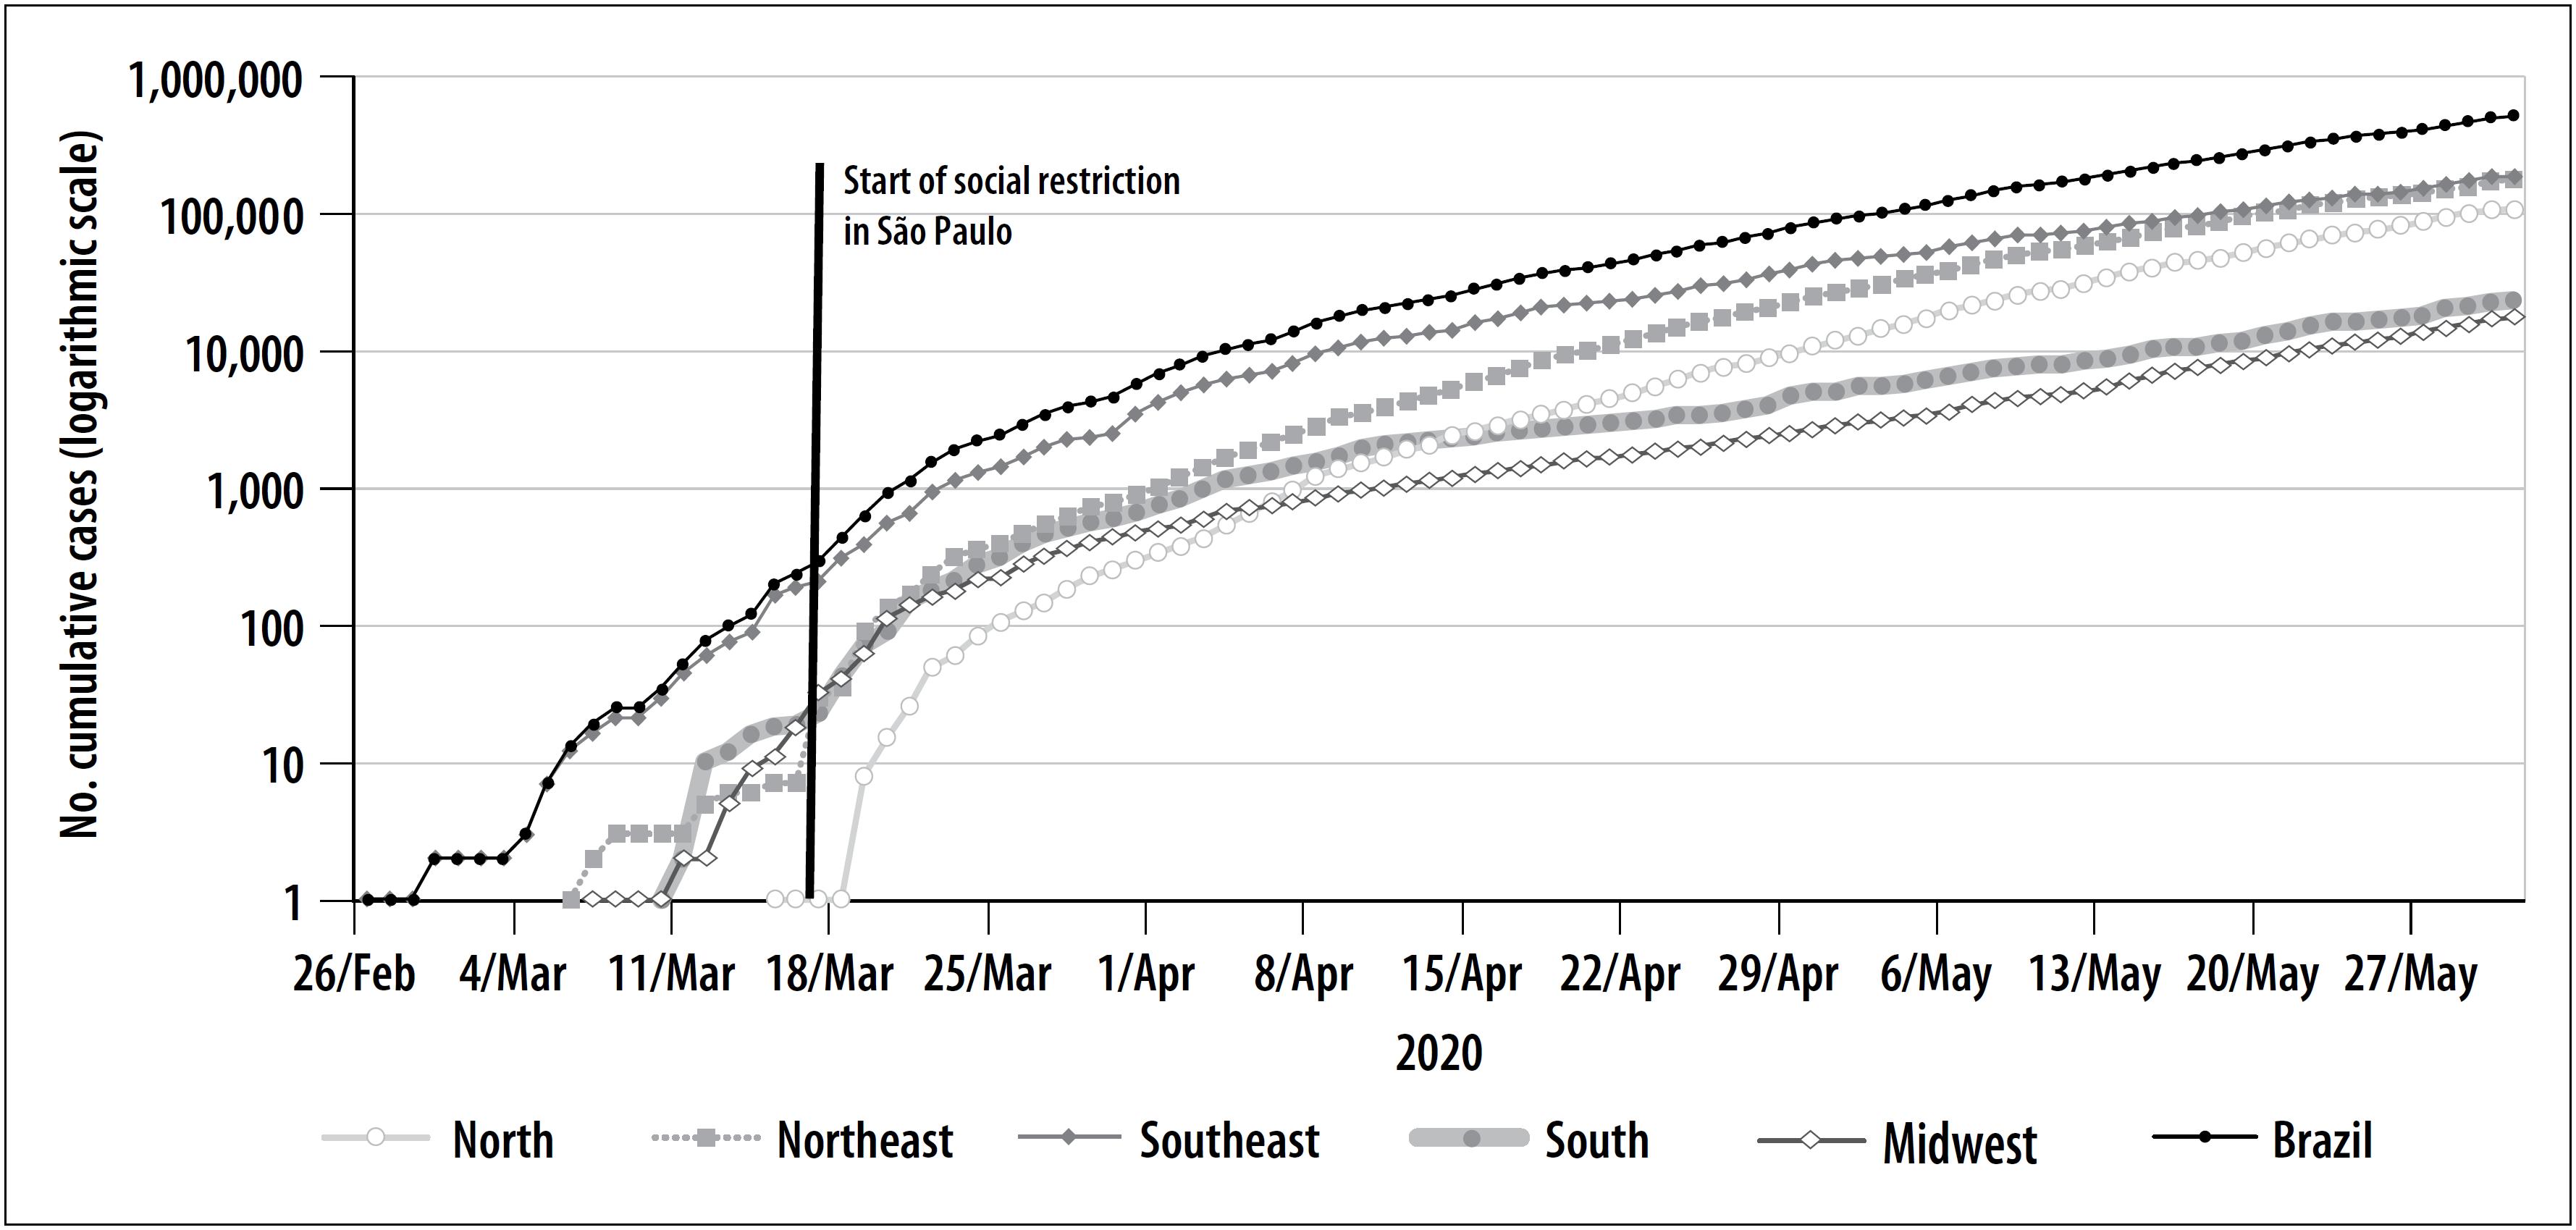
Source: Fundação Instituto Oswaldo Cruz (Fiocruz) – MonitoraCovid-19.2.
Figure 1 Cumulative number (logarithmic scale) of COVID-19 cases by macro-region, Brazil, February-May 2020
Table 4 shows the percentage rates of daily growth in the cumulative number of cases, in each week of the period from March 4th to May 26th, for Brazil as a whole and for its specific macro-regions. Taking Brazil as a whole, the daily growth rate decreased from 45.4%, in the week comprising March 4th to 10th, to 5.0% in the week comprising May 20th to 26th. The greatest decrease was found in the Southeast region, which also had the lowest percentage increase, namely 4.0% in the last week of May; in that same week, the highest growth rates corresponded to the North and Midwest regions, which both had rates close to 6.0%.
Table 4 Percentage (%) growth in the cumulative number of COVID-19 cases per day, in each week of the period, by macro-region, Brazil, March 4th – May 26th 2020
| Week | Period | Brazil | Rates (%) of daily growth | |||||
|---|---|---|---|---|---|---|---|---|
| Start | End | North | Northeast | Southeast | South | Midwest | ||
| 2 | 4/Mar | 10/Mar | 45.4 | – | 29.7 | 40.7 | – | – |
| 3 | 11/Mar | 27/Mar | 33.6 | – | 31.8 | 31.3 | 38.0 | 62.0 |
| 4 | 18/Mar | 24/Mar | 31.5 | 92.9 | 42.7 | 28.0 | 35.2 | 30.8 |
| 5 | 25/Mar | 31/Mar | 14.1 | 19.3 | 14.6 | 14.0 | 12.6 | 12.9 |
| 6 | 1/Apr | 7/Apr | 11.9 | 19.6 | 16.0 | 10.6 | 11.3 | 7.9 |
| 7 | 8/Apr | 14/Apr | 7.6 | 11.6 | 10.4 | 6.4 | 6.5 | 5.8 |
| 8 | 15/Apr | 21/Apr | 7.3 | 9.3 | 11.2 | 6.1 | 3.8 | 5.0 |
| 9 | 22/Apr | 28/Apr | 7.8 | 10.1 | 9.6 | 6.9 | 4.4 | 5.3 |
| 10 | 29/Apr | 5/May | 6.3 | 10.2 | 8.0 | 4.6 | 4.1 | 4.9 |
| 11 | 6/May | 12/May | 5.9 | 7.7 | 7.2 | 4.5 | 4.1 | 5.5 |
| 12 | 13/May | 19/May | 6.0 | 6.6 | 7.0 | 5.0 | 4.6 | 7.3 |
| 13 | 20/May | 26/May | 5.0 | 6.3 | 5.1 | 4.0 | 4.7 | 5.9 |
Source: Fundação Instituto Oswaldo Cruz (Fiocruz) – MonitoraCovid-19.2
Discussion
The results show that a large part of the Brazilian population adhered to the physical contact restriction measures. Some 60.0% reported having intense contact restriction with other people, while 15.0% adopted total physical contact restriction and only went out when they needed health care. These measures were adopted in all the country's macro-regions, with greater intensity in the Southeast, and less rigorously in the North and Midwest.
Notwithstanding, a quarter of the Brazilian population had no or little restriction in their contact with other people. This group is characterized predominantly by men, aged 30-49, with low schooling levels and who continued to work during the COVID-19 pandemic.
Guidance as to domestic confinement for people who did not have essential occupations had an important impact on the socioeconomic context, with considerable losses in Brazilian family income.11 In situations of economic crisis, this impact tends to affect more intensely individuals with precarious living conditions and who probably had to work during the pandemic to avoid losing their jobs and income.18
The beneficial effects of quarantine can be seen when following the time series of the cumulative number of cases, both in Brazil as a whole and in each of its macro-regions. There was a visible reduction in the daily growth rates, per week, from the beginning of March to the end of May. It is important to note that analysis of data from two independent sources, (i) the ‘Convid – Behavior Survey’, with results derived from survey participant answers regarding intensity of physical contact restriction, and (ii) the records of COVID-19 cases monitored in Brazil,2 led to similar conclusions. The Southeast region, where the proportion of adherence to the physical contact restriction measures was greatest, also had the greatest deceleration in the epidemic growth rate, while in the North and Midwest regions, where the highest proportions of people who had no physical contact restriction were found, the daily growth rate per week had lower deceleration in the period analyzed.
Other countries have reported a reduction in the virus reproduction rate, attributed, above all, to physical contact restriction measures.19,20 In China, over 1.4 million infections and 56,000 deaths were – probably – avoided due to these measures which were imposed at the end of January.8
However, it is important to determine whether some of the physical contact restriction measures can be relaxed without this resulting in a second wave of COVID-19 dissemination. Exemplary initiatives adopted in other countries, such as enhanced case detection, can offset rigorous physical distancing measures.21 By means of a mathematical model, Tang et al.22 have shown that expanding testing capacity and rapid diagnosis, as well as subsequent case monitoring and isolation, are key elements for relaxing more rigid physical contact restriction measures.
Despite the clear trend in growth rate reduction (per day) in the number of COVID-19 cases, the data should be viewed with due caution. Firstly, in the last week analyzed (May 20-26th), daily percentage growth in Brazil as a whole was 5.0%. This means that the cumulative number of cases increased by over 30% in that week. In the North and Midwest regions, in the same week, growth was in excess of 40%. It should be noted that although COVID-19 underreporting is recognized in Brazil,23 the daily growth rates remain unchanged presuming that underreporting remains constant in the period.
Another important aspect is that, despite the evaluation being based on a static time sample, the epidemic period varies depending on the different units of analysis. The process of the disease spreading into interior regions of the country is heterogeneous, and may be related to control measures in large cities, with impact on smaller cities.24 Considering that there are different epidemic periods, it is probable that the pandemic situation will become even worse in the Midwest, given that the region had more effective community transmission in June.2
According to evidence-based guidance in other countries, gradual flexibilization of physical contact restrictions should be done in regions/countries that meet specific criteria for containing virus dissemination, along with a surveillance system the performance of which allows local outbreaks to be detected, cases to be monitored, infected and exposed individuals be isolated, as well as increasing testing, whether it be for (i) COVID-19 diagnosis, or to (ii) identify presence of antibodies with the aim of establishing what the level of herd immunity development is.25 Use of facemasks of proven efficacy in public places has also been recommended.26
Among the limitations of the ‘Convid – Behavior Survey’, is that people with lower levels of schooling, with no internet access, were not able to take part in the study. According to data from the 2018 Continuing National Household Sample Survey in relation to the topic of Information and Communication Technologies,27 79.1% of households had access to the internet; and among people who did not used the web that year, 41.6% explained that it was because they did not know how to use it. Finally, underrepresentation of people with low levels of schooling may have underestimated the proportion of people who did not adhere to physical contact restriction with other people.
Web-based surveys are promising, especially because of the possibility of gaining real-time knowledge about health situations. Although there are those who question the scope of the diversity of population characteristics in the sample, studies have revealed the huge diversity of people connected to social networks, with regard to their geographical location and socioeconomic characteristics.28 It is probable that the expansion of the scope of the network of survey participants, comprised of several waves of recruitment, led to the composition of a large and comprehensive sample of the country's sociodemographic characteristics.29 With regard to the ‘sex’, ‘age group’ and ‘race/skin color’ variables and also with regard to geographic distribution, the ‘Convid – Behavior Survey’ sample achieved the diversity necessary for data weighting, so as to come close to representing the Brazilian population.
Finally, it is fitting to recall that observation dependency, which occurs in chain sample recruiting,30 may have led to biased estimates of the proportions of people who adopted physical contact restriction measures. These limitations were however minimized by the large sample size and sample calibration.16
Given the visible reduction in the daily COVID-19 growth rates (%), in each week of May, it is possible to conclude that adherence of the Brazilian population to physical contact restriction measures contributed to the reduction in spread of infection and the disease in Brazil.
Referências
1. World Health Organization – WHO. Coronavirus disease (COVID-19). Situation report – 132 [Internet]. Genebra: World Health Organization; 2020 [cited 2020 Jun 10]. 16 p. Available from: https://www.who.int/docs/default-source/coronaviruse/situation-reports/20200531-covid-19-sitrep-132.pdf?sfvrsn=d9c2eaef_2 [ Links ]
2. Fundação Instituto Oswaldo Cruz. MonitoraCovid-19 [Internet]. Rio de Janeiro: Fundação Instituto Oswaldo Cruz; 2020 [citado 2020 jul 14]. Disponível em: https://bigdata-covid19.icict.fiocruz.br/ [ Links ]
3. Chakraborty I, Maity P. COVID-19 outbreak: migration, effects on society, global environment and prevention. Sci Total Environ [Internet]. 2020 Apr [cited 2020 Sep 25];728:138882. Available from: https://doi.org/10.1016/j.scitotenv.2020.138882 [ Links ]
4. World Health Organization – WHO. WHO Director-General's opening remarks at the media briefing on COVID 19. 11 March 2020, [Internet]. Genebra: World Health Organization; 2020 [cited 2020 Jun 10]. Available from: https://www.who.int/dg/speeches/detail/who-director-general-s-opening-remarks-at-the-media-briefing-on-covid-19---11-march-2020 [ Links ]
5. Conti AA. Historical and methodological highlights of quarantine measures: from ancient plague epidemics to current coronavirus disease (COVID-19) pandemic. Acta Biomed [Internet]. 2020 May [cited 2020 Sep 25];91(2):226-9. Available from: https://pesquisa.bvsalud.org/controlecancer/resource/pt/mdl-32420953 [ Links ]
6. Mascha EJ, Schober P, Schefold JC, Stueber F, Luedi MM. Staffing with disease-based epidemiologic indices may reduce shortage of intensive care unit staff during the COVID-19 pandemic. Anesth Analg [Internet]. 2020 Apr [cited 2020 Sep 25];131(1):24-30. Available from: https://doi.org/10.1213/ane.0000000000004849 [ Links ]
7. Garcia-Alamino JM. Aspectos epidemiológicos, clínica y mecanismos de control de la pandemia por Sars-Cov-2: situación en España. Enferm Clin [Internet]. 2020 maio [citado 2020 set 25]. Available from: https://dx.doi.org/10.1016%2Fj.enfcli.2020.05.001 [ Links ]
8. Qiu Y, Chen X, Shi W. Impacts of social and economic factors on the transmission of coronavirus disease 2019 (COVID-19) in China. J Popul Econ [Internet]. 2020 May [cited 2020 Sep 25];1-46. Available from: https://doi.org/10.1007/s00148-020-00778-2 [ Links ]
9. Gul S, Tuncay K, Binici B, Aydin BB. Transmission dynamics of Covid-19 in Italy, Germany and Turkey considering social distancing, testing and quarantine. J Infect Dev Ctries [Internet]. 2020 Jul [cited 2020 Sep 25];14(7):713-20. Available from: https://doi.org/10.3855/jidc.12844 [ Links ]
10. Saracci R. Prevention in COVID-19 time: from failure to future. J Epidemiol Community Health [Internet]. 2020 Jun [cited 2020 Sep 25];214839. https://doi.org/10.1136/jech-2020-214839 [ Links ]
11. Fundação Oswaldo Cruz. ConVid – pesquisa de comportamentos [Internet]. Rio de Janeiro: Fundação Oswaldo Cruz; 2020 [citado 2020 jul 14]. Disponível em: https://convid.fiocruz.br/ [ Links ]
12. Szwarcwald CL, Viacava F. Pesquisa Mundial de Saúde no Brasil, 2003. Cad Saude Pública [Internet]. 2005 [citado 2020 set 25];21(Suppl):S4-5. Available from: https://doi.org/10.1590/S0102-311X2005000700001 [ Links ]
13. Szwarcwald CL, Malta DC, Pereira CA, Vieira ML, Conde WL, Souza Júnior PR, et al. Pesquisa Nacional de Saúde no Brasil: concepção e metodologia de aplicação. Ciên Saúde Coletiva [Internet]. 2014 fev [citado 2020 set 25];19(2):333-42. Disponível em: https://doi.org/10.1590/1413-81232014192.14072012 [ Links ]
14. Souza Junior PR, Szwarcwald CL, Castilho EA. Self-rated health by HIV infected individuals undergoing antiretroviral therapy in Brazil. Cad Saúde Pública [Internet]. 2011 [cited 2020 Sep 25];27 Suppl 1:S56-66. Available from: https://doi.org/10.1590/S0102-311X2011001300007 [ Links ]
15. National Institutes of Health. RedCap - Research eletronic data capture [computer program]. 2020 [cited 2020 Aug 14]. Available from: https://www.project-redcap.org/ [ Links ]
16. Instituto Brasileiro de Geografia e Estatística - IBGE. Pesquisa Nacional por Amostra de Domicílios (PNAD) 2019 [internet]. Rio de Janeiro: Instituto Brasileiro de Geografia e Estatística; 2019 [citado 2020 ago 14]. Disponível em: https://biblioteca.ibge.gov.br/visualizacao/livros/liv101651_notas_tecnicas.pdf [ Links ]
17. IBM. IBM SPSS statistics for Windows [computer program]. Version 21.0. Armonk (NY): IBM Corp; 2012. [ Links ]
18. Webster RK, Brooks SK, Smith LE, Woodland L, Wessely S, Rubin GJ. How to improve adherence with quarantine: rapid review of the evidence. Public Health [Internet]. 2020 May [cited 2020 Sep 25];182:163-69. Available from: http://dx.doi.org/10.1016/j.puhe.2020.03.007 [ Links ]
19. Shen M, Peng Z, Guo Y, Rong L, Li Y, Xiao Y, et al. Assessing the effects of metropolitan-wide quarantine on the spread of COVID-19 in public space and households. Int J Infect Dis [Internet]. 2020 May [cited 2020 Sep 25];96:503-5. Available from: https://doi.org/10.1016/j.ijid.2020.05.019 [ Links ]
20. Tang B, Xia F, Tang S, Bragazzi NL, Li Q, Sun X, et al. The effectiveness of quarantine and isolation determine the trend of the COVID-19 epidemics in the final phase of the current outbreak in China. Int J Infect Dis [Internet]. 2020 Apr [cited 2020 Sep 25];95:288-93. Available from: https://doi.org/10.1016/j.ijid.2020.03.018 [ Links ]
21. Wu J, Tang B, Bragazzi NL, Nah K, McCarthy Z. Quantifying the role of social distancing, personal protection and case detection in mitigating COVID-19 outbreak in Ontario, Canada. J Math Ind [Internet]. 2020 May [cited 2020 Sep 25];10(1):15. Available from: https://dx.doi.org/10.1186%2Fs13362-020-00083-3 [ Links ]
22. Tang B, Scarabel F, Bragazzi NL, McCarthy Z, Glazer M, Xiao Y, et al. De-escalation by reversing the escalation with a stronger synergistic package of contact tracing, quarantine, isolation and personal protection: feasibility of preventing a COVID-19 rebound in Ontario, Canada, as a case study. Biology (Basel) [Internet]. 2020 May [cited 2020 Sep 25];9(5):E100. Available from: https://doi.org/10.3390/biology9050100 [ Links ]
23. Hallal PC, Horta BL, Barros AJD, Dellagostin OA, Hartwig FP, Pellanda LC, et al. Trends in the prevalence of COVID-19 infection in Rio Grande do Sul, Brazil: repeated serological surveys. Ciên Saúde Coletiva [Internet]. 2020 Jun [cited 2020 Sep 25];25(suppl 1):2395-401. Available from: http://dx.doi.org/10.1590/1413-81232020256.1.09632020 [ Links ]
24. Fundação Instituto Oswaldo Cruz. Nota técnica 1 - MonitoraCovid-19 – 02 de abril de 2020 [Internet]. Rio de Janeiro: Fundação Instituto Oswaldo Cruz; 2020 [citado 2020 jul 14]. Disponível em: https://bigdata-covid19.icict.fiocruz.br/nota_tecnica_1.pdf [ Links ]
25. Preskorn SH. The 5% of the population at high risk for severe COVID-19 Infection is identifiable and needs to be taken into account when reopening the economy. J Psychiatr Pract [Internet]. 2020 May [cited 2020 Sep 25];26(3):219-27. Available from: https://doi.org/10.1097/pra.0000000000000475 [ Links ]
26. Ngonghala CN, Iboi E, Eikenberry S, Scotch M, MacIntyre CR, Bonds MH, et al. Mathematical assessment of the impact of non-pharmaceutical interventions on curtailing the 2019 novel Coronavirus. Math Biosci [Internet]. 2020 May [cited 2020 Sep 25];325:108364. Available from: https://doi.org/10.1016/j.mbs.2020.108364 [ Links ]
27. Instituto Brasileiro de Geografia e Estatística - IBGE. Pesquisa Nacional por Amostra de Domicílios [Internet]. Rio de Janeiro: Fundação Instituto Brasileiro de Geografia e Estatística; 2020 [citado 2020 jul 14]. Disponível em: https://agenciadenoticias.ibge.gov.br/media/com_mediaibge/arquivos/10d5c0576ff8d726467f1d4571dd8e62.pdf [ Links ]
28. Fenner Y, Garland SM, Moore EE, Jayasinghe Y, Fletcher A, Tabrizi SN, et al. Web-based recruiting for health research using a social networking site: an exploratory study. J Med Internet Res [Internet]. 2012 Fev [cited 2020 Sep 25];14(1):e20. Available from: https://doi.org/10.2196/jmir.1978 [ Links ]
29. Rose CD. Identification of peer effects through social networks using variance restrictions. Econometr J [Internet]. 2017 Aug [cited 2020 Sep 25];20(3):S47-60. Available from: https://doi.org/10.1111/ectj.12101 [ Links ]
30. Szwarcwald CL, Souza Júnior PR, Damacena GN, Barbosa Junior A, Kendall C. Analysis of data collected by RDS among sex workers in 10 Brazilian cities, 2009: estimation of the prevalence of HIV, variance, and design effect. J Acquir Immune Defic Synd [Internet]. 2011 Aug [cited 2020 Sep 25];57 Suppl 3:S129-35. Available from: https://doi.org/10.1097/QAI.0b013e31821e9a36 [ Links ]
Received: July 08, 2020; Accepted: September 06, 2020
 This content is licensed under a Creative Commons Attribution 4.0 International License.
