


Serviços Personalizados
Journal

Artigo
 texto em
  Inglês (pdf)
 Artigo em XML
 Referências do artigo
 Enviar este artigo por email
Indicadores
-
 Citado por SciELO
Links relacionados
-
 Similares em
SciELO
Similares em
SciELO
Compartilhar

 Permalink
Epidemiologia e Serviços de Saúde
versão impressa ISSN 1679-4974versão On-line ISSN 2237-9622
Epidemiol. Serv. Saúde vol.29 no.5 Brasília 2020 Epub 27-Nov-2020
http://dx.doi.org/10.1590/s1679-49742020000500022
Original Article
Projection of COVID-19 intensive care hospitalizations in the Federal District, Brazil: an analysis of the impact of social distancing measures
1Universidade de Brasília, Faculdade de Ciências da Saúde, Brasília, DF, Brazil
4Universidade de São Paulo, Faculdade de Medicina de Ribeirão Preto, Ribeirão Preto, SP, Brazil
Objective:
To build scenarios and analyze the impact of social distancing policies on the spread of COVID-19 and the need for intensive care unit beds.
Methods:
Three dissemination scenarios were built according to level of adherence to social distancing measures in the context of Brazil's Federal District, based on a dynamic transition compartmental model and Monte Carlo simulations. The model's parameter values were based on official sources, indexed bibliographic databases and public data repositories.
Results:
The favorable scenario, with constant 58% adherence to social distancing, estimated a peak of 189 (interquartile range [IQR]: 57 – 394) ICU hospitalizations on March 3rd2021. Absence of social distancing would result in an unfavorable scenario with a peak of 6,214 (IQR: 4,618 – 8,415) ICU hospitalizations probably as soon as July 14th2020.
Conclusion:
The projections indicate the high impact of social distancing measures and emphasize the applicability of public indicators for COVID-19 monitoring.
Keywords: Coronavirus Infections; Intensive Care Units; Bed Occupancy; Health Evaluation; Public Policy
Introduction
COVID-19 is a disease resulting from Sars-CoV-2 virus infection. Its clinical manifestations can include severe acute respiratory syndrome (SARS), among others. 1 The first case in Brazil was confirmed on 25/2/2020; by 3/5/2020 the country had officially registered over 100,000 cases and 7,000 deaths. 2 Given its far-reaching nature and ability to spread rapidly, its potential to bring the hospital network to a collapse, in particular insufficient availability of intensive care unit (ICU) beds, COVID-19 is considered to be a very serious health condition for Public Health. 1
Although there are reports of experiments with treatment and initiatives to find a vaccine, at the time of writing this manuscript, there was no robust proof of the efficacy of pharmaceutical interventions in preventing or treating this clinical condition. 3 Ample testing, personnel protection (health services and essential services), isolation of infected individuals and adoption of non-pharmaceutical interventions, such as public policies on social distancing, appear as the most feasible option for addressing COVID-19. 4 On 11/3/2020, the first local social distancing measures came into force throughout Brazil's Federal District in view of the risk of novel coronavirus infection, including the suspension of events with audiences of more than 100 people and educational activities at all schools, universities and faculties. 5 Moreover, bars and restaurants had to ensure a minimum distance of two meters between tables. On 21/4/2020, in addition to the measures already taken, the Federal District government began testing symptomatic people, increasing sample collection and screening points exclusively for these people in places other than health centers.
With the aim of monitoring and informing public policy decisions on COVID-19, a series of initiatives and networks have joined forces and made available case prediction tools including projections of the need for hospital beds and equipment. 6-8 In this respect, analysis of data on public policies, with regard to evaluation of their impact, is a field of possible inferences, for which robust data are essential. In scenarios with temporal limitation of data availability, building models and counterfactuals (possible but not necessarily observed scenarios) is of great value for identifying trends and projections of possible impacts of a given public policy. 9
Based on the context of the occurrence of COVID-19 cases among the Federal District population, the objective of this study was to build scenarios to analyze the impact of social distancing policies on the spread of COVID-19 and the need for ICU beds in the Federal District, with the aid of a mathematical model and Monte Carlo simulations.
Methods
Taking as our reference the bases and designs of studies in the field of public policy evaluation, 9 this is a case study based on simulations. Following data and indicator acquisition, we built scenarios of projections and counterfactuals relevant for analysis of the impact of social distancing on the demand for ICU beds in the context observed.
The case used for this analysis is comprised of all the administrative regions within the Federal District, the total population of which is estimated as being 3,223,048 inhabitants in 2020, according to projections made by the Brazilian Institute of Geography and Statistics (IBGE). 10 With the aim of obtaining a reference as to existing hospital capacity, we consulted the database of the National Registry of Health Establishments as at June 2020 to find the number of adult ICU beds in the Federal District. In addition, with the aim of contextualizing the adherence of the population to the social distancing measures recommended by the policies in force, we consulted the public data contained in the Federal District ‘social isolation index’ for the period 1/3/2020 to 31/7/2020, made available by the Inloco technology company. 11 This index has assisted initiatives monitoring the spread of COVID-19, undertaken by public universities and governmental institutions. By using telephone device geolocation data for part of the local population - with prior authorization -, it is possible to estimate on a daily basis the percentage of that population which has adhered to public policy advice on social isolation. 11
Model structure
A mathematical model was built in order to estimate the need for ICU beds as a result of the spread of COVID-19. Taking the methodological guidelines published by the Health Ministry's Science, Technology and Strategic Supplies Secretariat 12 and the practical bases for modeling communicable diseases, 13 the concept used for the model was a dynamic transition compartmental model. In this model, derived from the classic SIR model (‘susceptible, infected and recovered’) proposed by Kermack & McKendrick, transition between compartments (or states of health) is represented by a system of dependent differential equations, among other parameters, containing the number of infected people ( I ), transmission coefficient ( β ), latency ( α ) and recovery ( γ ).
The transition and compartment structure used by this study was based on models already provided by other authors who also sought to project hospital demand, 14-16 as well as the impact of non-pharmaceutical interventions - such as use of facemasks - on community transmission of COVID-19. 17 In this proposal, the model for the daily correlation between the number of susceptible ( S ), exposed ( E ), infected ( I ) and removed ( R ) individuals - SEIR - is represented in Figure 1 .
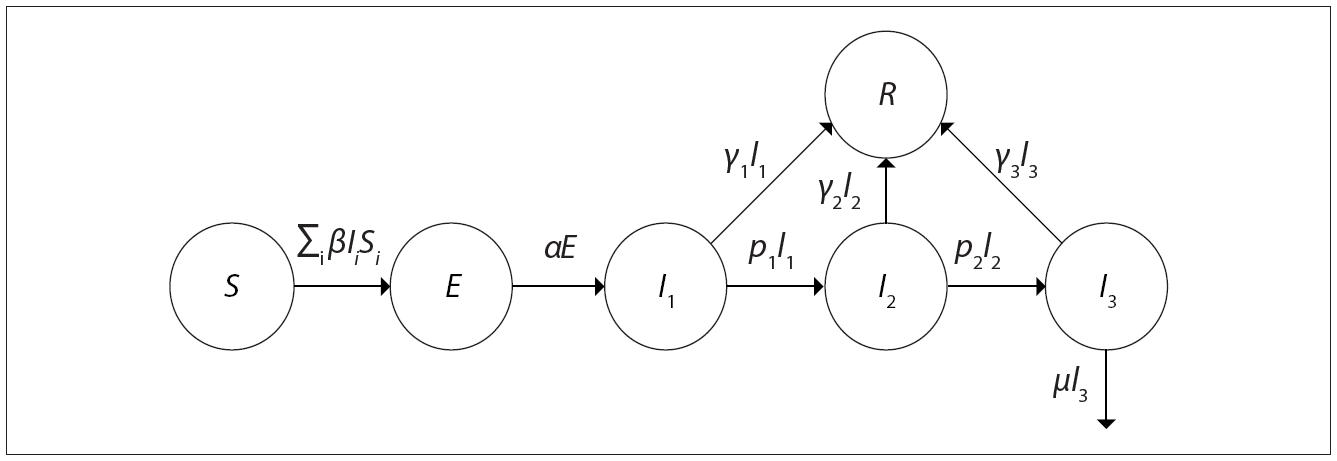
Source: Adapted from Hill. 15
Figure 1 Representation of the structure of the compartmental dynamic model used
Within the infected compartment, there are also subdivisions of those who do not need to be hospitalized ( I1 ), those who progress to needing hospitalization ( I2 ) and patients in a critical state ( I3 ) who need to be hospitalized in an ICU.
Main premises of the model
No change in the total size of the population is expected (overall birth and mortality rates), except due to death from COVID-19. Given the short time period analyzed, this restriction was considered to simplify the model with little impact on the results.
Similarly to previous approaches, based on COVID-19 SEIR models, 17 it is assumed that hospitalized individuals are not effectively exposed to the general population and, therefore, do not contribute to the calculation of the force of infection in the community.
The possibility of a recovered individual being reinfected is not foreseen, even though there is no conclusive evidence as to the extent to which acquired immunity following infection protects against reinfection. 18
As it is not an objective of the analysis, this model does not take into consideration potential increase in mortality due to lack of hospital beds. It is important to note that lethality found by the model may be underestimated in a scenario of lack of hospital beds.
The estimates of effective contact assume random mixing, 13 whereby each infected individual may have contact with a susceptible individual according to the same average probability.
The complete equations and further details of the model are provided in Supplementary Material 1.
Scenarios
Three scenarios of the spread of COVID-19 were built with the aim of analyzing the potential impact of the disease on the need for hospital care. The scenarios were based on a one-year time period which was considered to be sufficient to take into account both a complete wave of infections and also uncertainty as to availability or otherwise of specific interventions (vaccines and treatment). The start date was 22/3/2020, providing a ten-day margin between the beginning of the social distancing measures and the peak of social isolation levels obtained in the Federal District.
Scenario A - COVID-19 spread profile with no adherence to social distancing measures
Definition
This scenario represents the contrafactual that would occur if no social distancing measures were taken or adhered to by the population.
There is therefore no reduction in social contact over the course of the model, taking an average estimate of social isolation observed in the last ten days before the local measures were brought into force on 11/3/2020.
The model therefore uses a constant transmission coefficient ( β ) value.
Scenario B - COVID-19 spread profile maintaining adherence to social distancing
Definition
This scenario represents the profile of the spread of infection and the profile of need for hospital beds maintaining the same level of average social isolation obtained during the first ten days after the peak in social isolation.
In this scenario, the model also uses a constant transmission coefficient ( β ) value.
Scenario C - COVID-19 spread profile based on the observed dynamics of a falling level of social distancing
Definition
This scenario represents the dynamics of social isolation observed in the Federal District and the possible projection of the need for hospital beds when maintaining the last average levels of isolation observed.
Seeking to simulate an interruption or return of distancing measures, this context also estimates population isolation targets according to demand for ICU beds.
As mentioned in the definitions presented, the scenarios did not include a complete simulation of adherence to distancing above the average observed following the implementation of distancing polices in the Federal District. Despite this, we emphasize that the analysis of the isolation measures in Scenario C was not subject to this restriction.
Parameter values and uncertainties
With the aim of bringing the analysis model closer to local reality and to the size of the population, we used the Federal District age structure to adjust the expected indicators of lethality and hospitalization for the region. Federal District Health Department official bulletins 19 were used to obtain numbers of cases by date of symptom onset, numbers of ICU hospitalizations and COVID-19 deaths in the Federal District. In addition to the estimates of infection and lethality by age group for the Federal District (Supplementary Material 2), the complete series of ICU hospitalizations, deaths and percentage social isolation available for the period analyzed (data from 1/3/2020 to 31/7/2020) is shown in Supplementary Material 3. In addition to the parameters mentioned, the daily evolution of the instantaneous reproduction number (Rt) was estimated for each scenario.
Given the absence of local data for the remaining parameters, we also consulted publications indexed on Pubmed ( http://www.ncbi.nlm.nih.gov/pubmed ), preprints on MedRvix ( www.medrxiv.org ) and public repositories of modeling parameters, such as the initiative of the MIDAS network ( http://midasnetwork.us/COVID-19 ), using an adaptation of the basic search structure with the terms (COVID-19 OR coronavirus) AND (model OR modelling). The choice of the data sources of available parameters prioritized those used in models validated by other institutions considered to be references on the subject, such as the Imperial College London models, seeking comparability of the model proposed here. The retrieved data included point estimations and their parametric uncertainties (standard error, confidence intervals or probability distributions). The values of the main parameters considered in model proposed here, along with their parametric uncertainties, description and sources, are shown in Table 1 .
Table 1 List of values, parametric uncertainties, distributions and sources of the main parameters of the model of the spread of COVID-19 in the Federal District, Brazil
| Parameter | Point estimation | Lower limit | Upper limit | Probability function | Description | Source |
|---|---|---|---|---|---|---|
| Incubation (days) | 5.10 | 4.50 | 5.80 | Lognormal | Incubation time | Sanches et al. 26 |
| Duration - mild (days) | 3.65 | 3.21 | 4.09 | Gama | Duration of condition until isolation or hospitalization | Linton et al. 27 |
| Severe clinical picture (%) | 4.57 | 2.72 | 9.32 | Beta | Proportion of infected people who will have severe or critical clinical picture (hospitalization) | Verity et al. 28 |
| Length of hospitalization (days) | 8.00 | 6.00 | 10.00 | Lognormal | Average length of hospitalization in a ward | Ferguson et al. 29 |
| ICU a hospitalization (%) | 46.30 | 44.31 | 48.06 | Beta | Percentage of severe patients needing intensive care | Epidemiological Bulletins 19 |
| Time in ICU a (days) | 9.00 | 6.00 | 13.00 | Lognormal | Average length of hospitalization in ICU a | Grasselli et al. 30 |
| Lethality (%) | 0.576 | 0.315 | 1.140 | Beta | Lethality of infected people adjusted for the region | Verity et al. 28 |
| Time until death (days) | 17.80 | 16.02 | 19.58 | Lognormal | Average time from symptom onset to death | Verity et al. 28 |
| ICU a mortality (%) | 27.23 | 12.85 | 47.81 | Not applicable | Probability of death in ICU a | Calibrated by lethality |
a)ICU: intensive therapy unit.
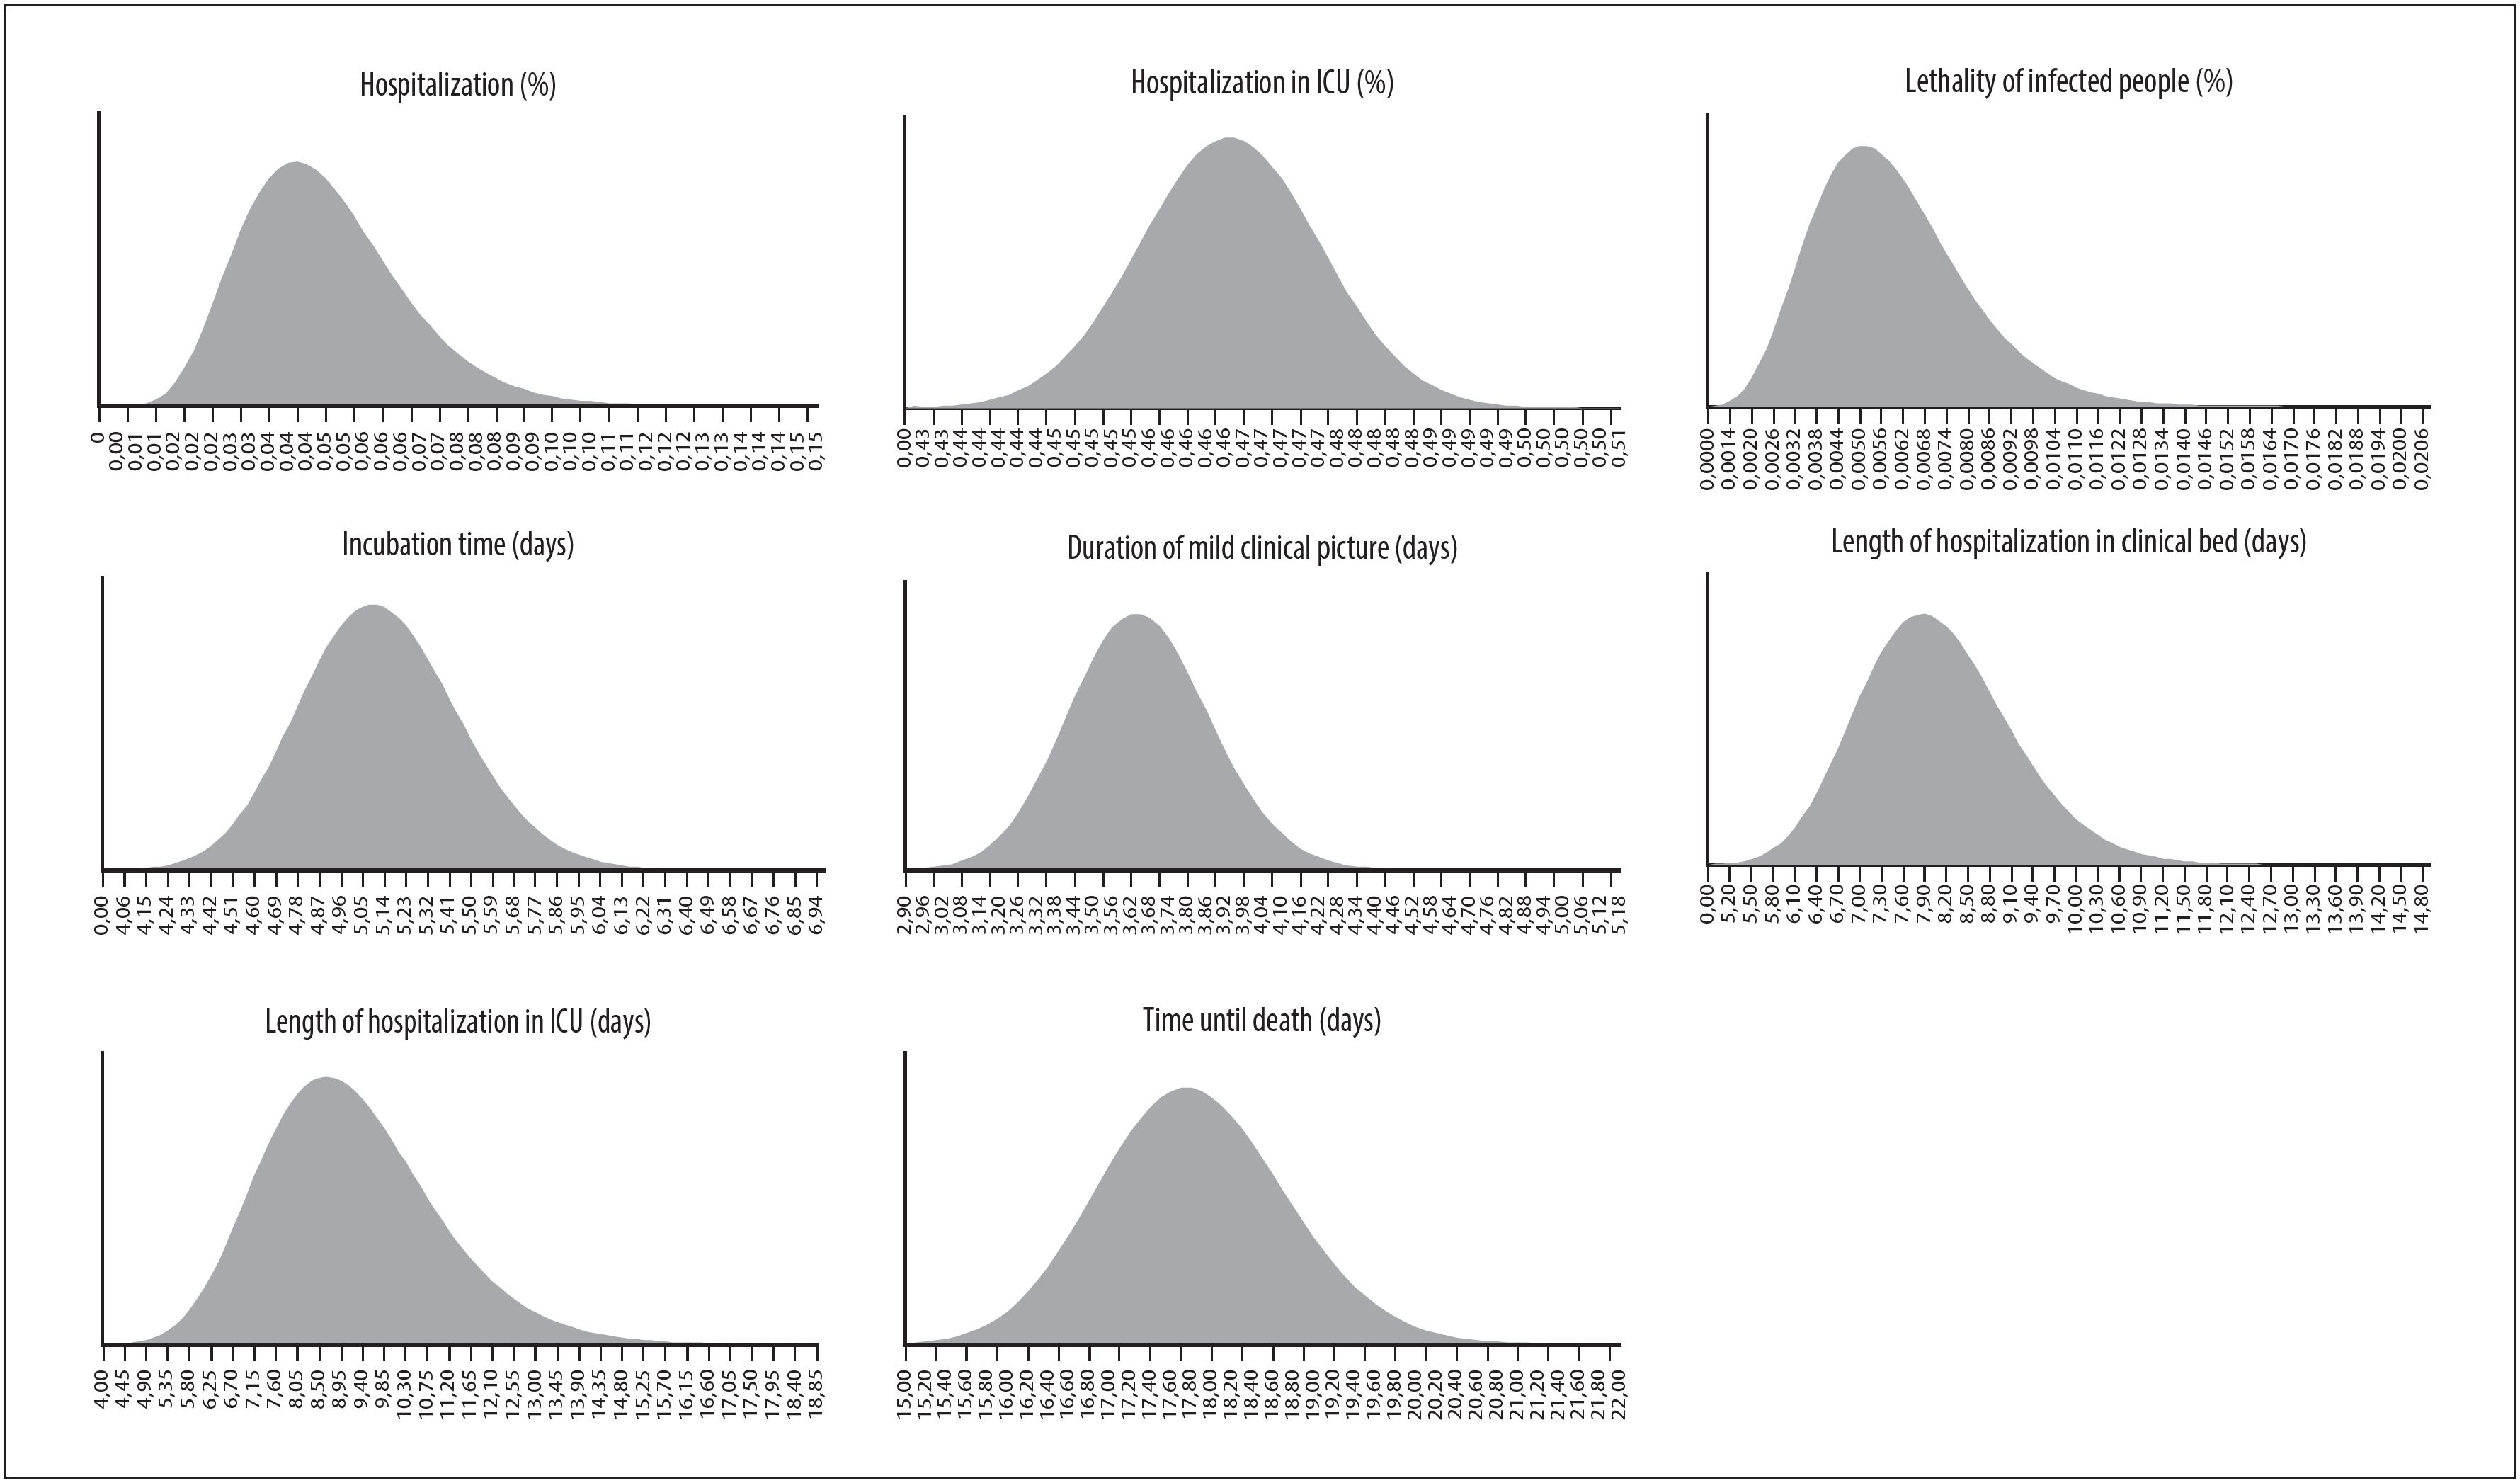
In order to take into consideration the impact of the parametric uncertainties of the nine parameters described in Table 1 on the model results, the analyses were performed using a stochastic (probabilistic) approach, using Monte Carlo simulations, with multiple draws on expected value levels (2ndorder). 20 Based on the characteristics of the variables, a priori probability distributions were adjusted for the following parameters: incubation time (days), duration of mild clinical picture (days), fraction of individuals with a severe clinical picture (%), time hospitalized in a ward (days), fraction of individuals who progressed to ICU hospitalization UTI (%), time hospitalized in an ICU (days), lethality (%) and time from onset of symptoms to death (days), as illustrated in Supplementary Material 4. In the absence of intervals in the data sources, we used bootstrap resampling to estimate parametric uncertainty (confidence intervals). The results were summarized into medians and coverage amplitudes of the simulations (interquartile range [IQR] and confidence interval [CI]).
Validation
In order to calibrate the model, we used as a reference the scenario that reflects the spread of COVID-19 during the observed levels of social distancing (Scenario C). We recorded the values of the minimization statistic of the root-mean-square error (RMSE) of the number of deaths predicted by the model, as observed in the time series under analysis. The adequacy of the number of Monte Carlo simulations was assessed by visual inspection of the convergence of the main parameters of the model.
All the analyses were performed with the aid of Microsoft Excel® and the Visual Basic for Applications (VBA) programming language. The adjustment of the calibration parameters was performed using the non-linear least squares method, with the support of the non-linear Generalized Reduced Gradient (GRG) optimization algorithm, using the SOLVER function. The complete model and the history of its versions are available at a public data repository. 21
Results
According to the official data consulted, between 1/3/2020 and the final date of data acquisition for the model (31/7/2020), 106,292 COVID-19 cases and 1,469 deaths had been confirmed in the Federal District. 19 Bearing in mind the date of the first local decree on distancing measures, there was important initial adherence to the measures by the population, given the gradual increase in the rate of social isolation over the days following the decree, from an average of 30.0% between 2/3/2020 and 11/3/2020, to an average of 57.4% between 22/3/2020 and 30/4/2020 ( Figure 2 ).
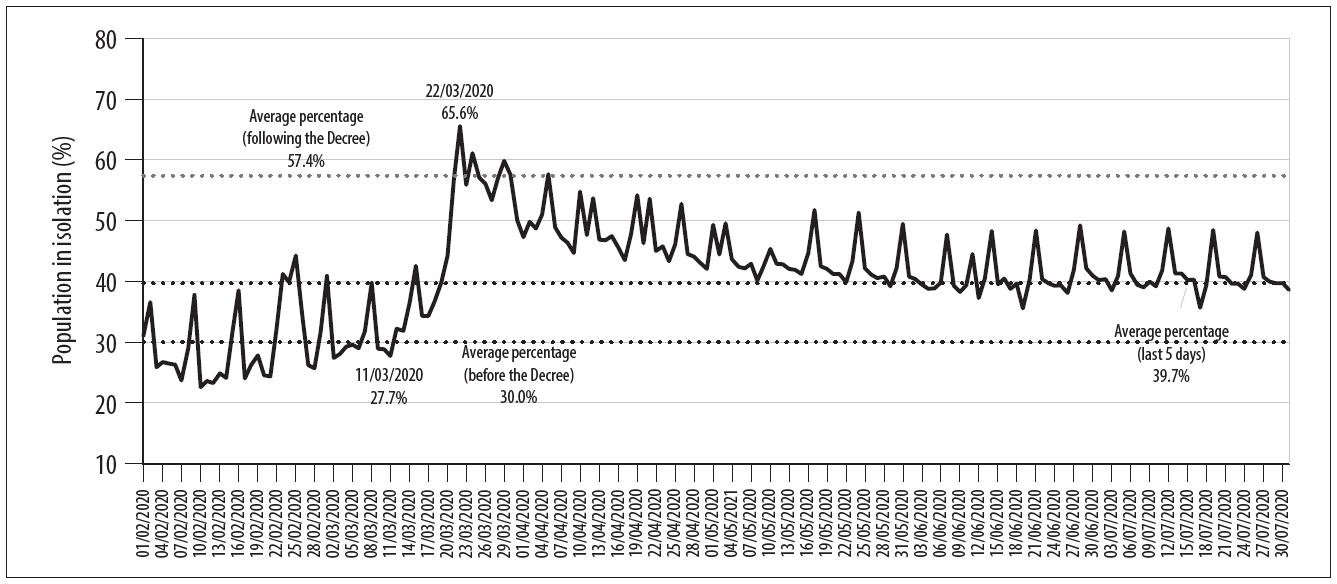
Source: InLoco public database data. 11
Figure 2 Evolution of percentage social isolation in relation to the implementation date of COVID-19 combat measures in the Federal District, Brazil
Considering the records of cases by date of symptom onset, all the scenarios began simulations on 22/3/2020, with an average estimate of 366 infected (I1) individuals and 732 exposed (E) individuals - given the existence of a minimum instantaneous reproduction number (Rt) of 2 without social isolation. With an RMSE of 83.5 in the predicted death values, the value of parameter τ was estimated as 0.6979 for calibrating the model. According to the National Registry of Health Establishments database, as at June the Federal District had a total of 1534 adult ICU beds, 378 of which were public. Below are the results of each of the scenarios.
Scenario A - COVID-19 spread profile with no adherence to social distancing measures
In the first scenario, the transmission coefficient is calculated assuming the level of social isolation to be 30.0%, this being coherent with the average values observed up until 11/3/2020. As illustrated in Figure 3 , given the need to hospitalize critical cases, if there were no adherence to social distancing by the population, according to the median of the simulations, there would be a peak of 6,214 people needing to be hospitalized in ICUs (IQR: 4,618 – 8,415) probably on 14/7/2020 (IQR: 9/7/2020 – 20/7/2020). However, according to the National Registry of Health Establishments data, the total number of public ICU beds registered would already have been surpassed on 17/5/2020 (IQR: 12/5/2020 – 22/5/2020). This demand, greater than the number of registered public ICU beds, would continue for at least 125 days (IQR: 115 – 135).
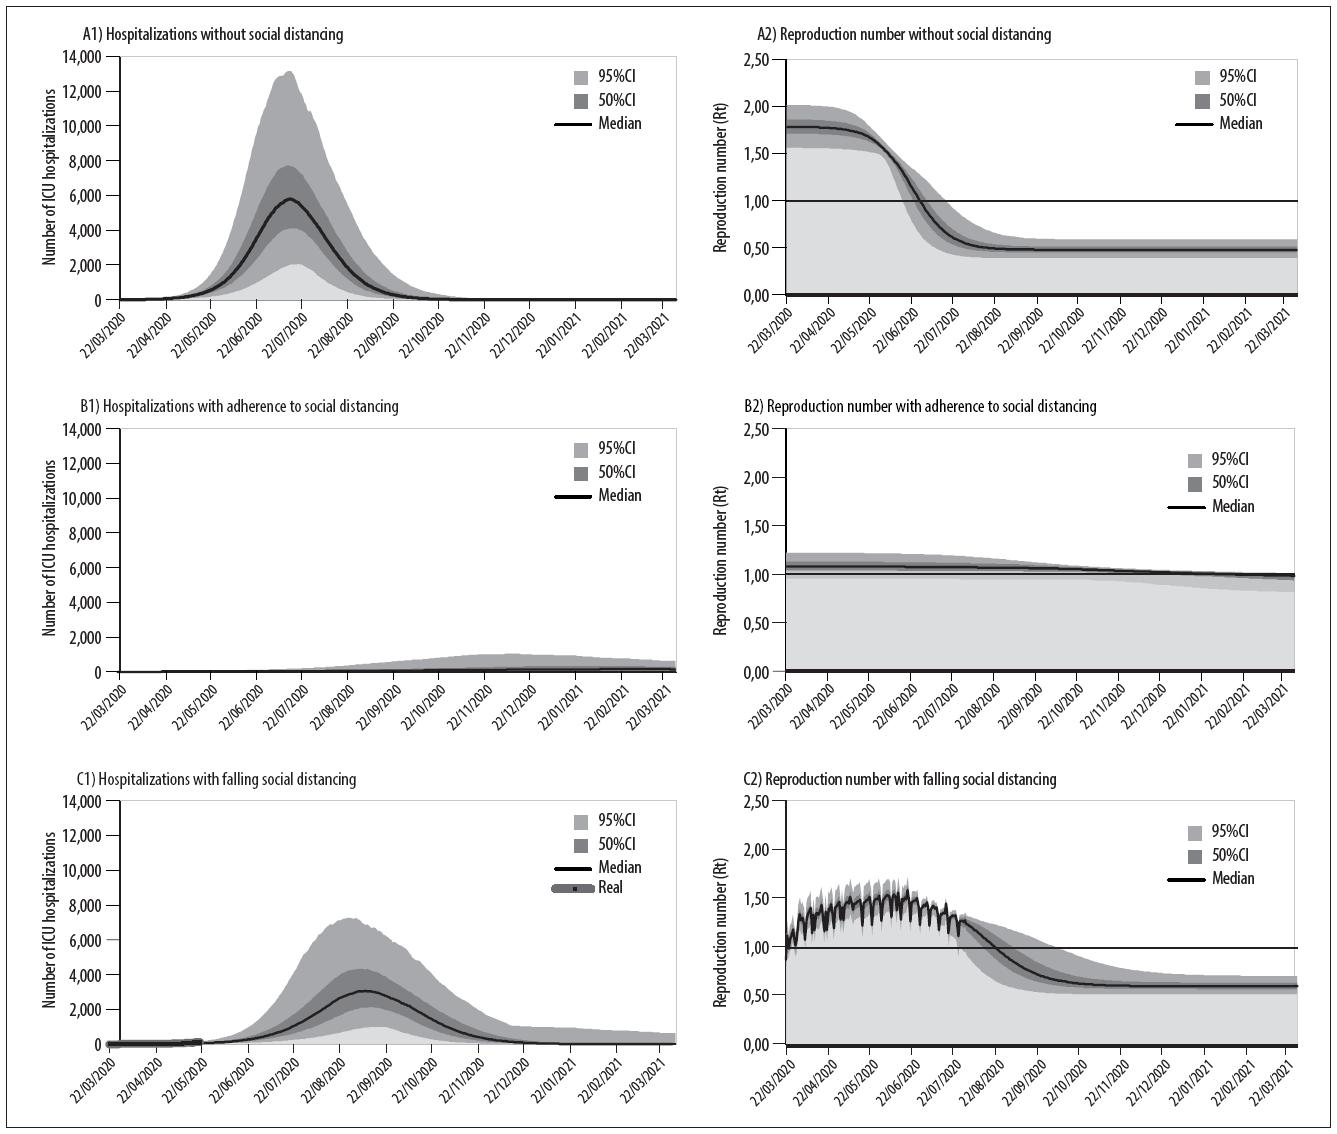
Figure 3 Projections of the demand for ICU beds due to COVID-19 and the instantaneous reproduction number (Rt) in Scenario (A) COVID-19 spread profile with no adherence to social distancing measures, Scenario (B) COVID-19 spread profile maintaining adherence to social distancing and Scenario (C) COVID-19 spread profile based on the observed dynamics of a falling level of social distancing, in the Federal District, Brazil
Over the period of a year, there would probably be a peak of 178,615 active infections (IQR: 153,820 – 203,955) on 1/7/2020 (IQR: 26/6/2020 – 6/7/2020). At this rate, by 31/3 of the following year (2021), up to 73.2% (IQR: 70.3 – 75.9%) of the Federal District population would have been infected. Even if it were possible to provide care for all infected people, 16,143 individuals would have died (IQR: 10,948 – 22,326) - expected lethality would be 0.67% (IQR: 0.45 – 0.94%).
Scenario B - COVID-19 spread profile maintaining adherence to social distancing
Considering the hypothesis of maintaining the average level of social isolation at 57.38%, this being the level reached in the initial period of the distancing measures, this scenario projected a peak of 189 ICU hospitalizations (IQR: 57 – 394) only on 7/3/2021 (IQR: 6/1/2021 – 31/1/2021) and, in this context, it would be feasible to meet the demand with the number of beds registered in the Federal District.
Over the one-year simulated period, the total number of infected individuals could reach a peak of 5,269 active infections (IQR: 1,538 – 11,549). By 31/3/2021, the cumulative total of infections would affect only 7.6% of the Federal District population DF (IQR: 3.0 – 16.4%) and, with 0.70% lethality (IQR: 0.47 – 0.94%), there would be up to 1,438 deaths (IQR: 583 – 3,234).
Scenario C - COVID-19 spread profile based on the observed dynamics of a falling level of social distancing
Using the proposed methodology described for this scenario, the transmission coefficient followed the dynamic variation of the level of isolation recorded as at 31/7/2020. With effect from 1/8/2020, the average level of 39.7% isolation was assumed to continue, based on the levels recorded on the last five days available. 11 As such, the fall observed in the level of distancing was projected to lead to a peak of up to 3,460 ICU hospitalizations (IQR: 2,634 – 4,779) probably on 10/9/2020 (IQR: 31/8/2020 – 22/9/2020) ( Figure 3 ). In this scenario, even raising the level of isolation to an average of 70% (a level close to the maximum level recorded on 22/3/2020) with effect from 1/8/2020, there would still be a peak of 2,097 hospitalizations (IQR: 1.245 – 3.312) on 19/8/2020 (IQR: 16/8/2020 – 21/8/2020). On the other hand, complete interruption of distancing, returning to the 30% level of isolation observed before the distancing policies were implemented, would lead to a peak of 4,812 ICU hospitalizations (IQR: 3,643 – 6,283) on 12/9/2020 (IQR: 04/9/2020 – 21/9/2020).
Discussion
Based on public indicators and data used in this analysis, it is possible to identify adherence to social distancing following the publication of the first decree establishing measures to address COVID-19 in the Federal District. Likewise, linking the temporal evolution of the level of isolation with the consequent progressive reduction in the spread of the disease (Rt), it would be possible to reach reference values for the control of outbreaks and, at the same time, delay and reduce the peak of ICU hospitalizations to a plausible estimate in relation to the capacity of the local healthcare network.
Differently to the scenario in which social distancing was maintained, both the other scenarios with absence of social distancing, whether because of no measures being implemented (Scenario A), or because of low adherence (Scenario C), provide a projection compatible with the collapse of the local healthcare network due to high demand for ICU hospitalizations. Notwithstanding the uncertainty about the data and the magnitude of demand, the alternative projections of Scenario C, which seeks to incorporate the observed percentages of social isolation, pointed to peaks of hospitalization in August and September of this year. These projections are consistent with the ICU bed waiting list situation in the Federal District reported in August. Also coherent with the findings of a recent study of other Brazilian states carried out by researchers from Imperial College London, 22 notwithstanding significant reductions in the spread of cases, the levels of isolation achieved would perpetuate an Rt >1, indicating the continuation of epidemic growth of COVID-19 in the Federal District.
Despite this analysis being restricted to the context of the Federal District, it shows the magnitude of the potential effect of distancing on the need for hospital beds, it being unlikely that this relationship, even with a different magnitude, cannot be generalized to other contexts. The results are also consistent with other initiatives analyzing social distancing, 4 including national contexts such as the analysis by Rede CoVida of the positive effects of social distancing and the reduction in movement of people between municipalities on the control of COVID-19 in the state of Bahia, 6 the available data of which strongly suggest that the measures taken managed to flatten the epidemic curve in that state.
The model adopted here follows methodological lines compatible with the population dynamics of infections 13 and, as much as possible, was built on local parameters, including the adjustment of the infection and lethality rates to the Federal District age structure. Moreover, we sought to make transparent use of available evidence and deal in a robust manner with the parametric uncertainties by using Monte Carlo simulations. 20 As demonstrated in this analysis of the Federal District, monitoring dynamic indicators of isolation and spread of infection, such as estimated Rt, along with their uncertainties, is an efficient and pragmatic strategy for monitoring policies intended to address COVID-19. 23
Despite compartmental models at expected levels being able to represent average behavior of epidemics in populations, they are not capable of portraying individual histories. 12 Likewise, estimating the dynamic values of the rates of effective contacts is discussed according to varied approaches in the literature, with different potential impacts on the results, depending on the calculation method. 24 Although the adjustments relating to local age structure and calibration based on available records of hospitalizations were taken into consideration, other factors capable of interfering in the projection scenarios were not taken into consideration, such as comorbidities related to greater severity of the disease, including cardiovascular, respiratory and endocrine diseases. 25 And still in relation to demographic and social characteristics, we emphasize that the model assumes the premise of random contact, and the values of its estimates may diverge from measurements obtained when considering the specific contact patterns of each group (influence of heterogeneity). When interpreting the number of deaths expected by the model, it is important to remember that we did not take into consideration the possibility of increased deaths because of lack of hospital beds in the event of a possible collapse of the health care network.
Finally, we highlight that the data shown here on registered beds should also be interpreted paying attention to the reference of the targets for reducing impact on the hospital network. This is because they do not take into consideration the real proportion of hospital bed occupancy due to other clinical conditions, nor additional beds that are being put in place by health authorities.
Despite its limitations, this analysis reinforces conclusions as to the positive effect of social distancing measures on reducing the impact of the spread of COVID-19 on demands on the hospital network. Given the alarming scenario projected in the event of interruption or low adherence to social distancing, it is essential that local health authorities consider daily monitoring of distancing indicators, spread of the disease and availability of hospital beds, when planning and implementing public policies to combat COVID-19.
REFERENCES
1. Mohammadi M, Meskini M, Nascimento Pinto AL. 2019 Novel coronavirus (COVID-19) overview. Z Gesundh Wiss [Internet]. 2020 Apr [cited 2020 Sep 25];1-9. Available from: https://doi.org/10.1007/s10389-020-01258-3 [ Links ]
2. Ministério da Saúde (BR). Painel coronavírus [Internet]. Brasília: Ministério da Saúde; 2020 [citado 2020 set 25]. Disponível em: https://covid.saude.gov.br/ [ Links ]
3. Rothan HA, Byrareddy SN. The epidemiology and pathogenesis of coronavirus disease (COVID-19) outbreak. J Autoimmun [Internet]. 2020 May [cited 2020 Sep 25];109:102433. Available from: https://doi.org/10.1016/j.jaut.2020.102433 [ Links ]
4. Prem K, Liu Y, Russell TW, Kucharski AJ, Eggo RM, Davies N, et al. The effect of control strategies to reduce social mixing on outcomes of the COVID-19 epidemic in Wuhan, China: a modelling study. Lancet Public Health [Internet]. 2020 May [cited 2020 Sep 25];5(5):e261-70. Available from: https://doi.org/10.1016/s2468-2667(20)30073-6 [ Links ]
5. Governo do Distrito Federal. Decreto n° 40.509, de 11 de março de 2020. Dispõe sobre as medidas para enfrentamento da emergência de saúde pública de importância internacional decorrente do novo coronavírus, e dá outras providências [Internet]. Diário Oficial do Distrito Federal, Brasília (DF), 2020 mar 11 [citado 2020 set 25];Edição extra. Disponível em: http://www.sinj.df.gov.br/sinj/Norma/ad0fae78af5f4e50b46c7357b7ee8597/Decreto_40509_11_03_2020.html [ Links ]
6. Rede CoVida. Os impactos das medidas de distanciamento social e redução de fluxo intermunicipal na Bahia. Bol CoVida [Internet]. 2020 abr [citado 2020 set 25];1(2):19. Disponível em: https://covid19br.org/main-site-covida/wp-content/uploads/2020/04/BoletimCovida_2ed_Final.pdf [ Links ]
7. COVID-19 Brasil. Monitoramento e análises da situação do Coronavírus no Brasil [Internet]. São Paulo; 2020 [citado 2020 set 25]. Disponível em: https://ciis.fmrp.usp.br/covid19/ [ Links ]
8. Organização Pan-Americana de Saúde - OPAS. Ministério da Saúde (BR). Universidade de Brasília. Butantã. Pressão hospitalar por COVID-19 [Internet]. [S.l];2020. Disponível em: https://covid-calc.org/ [ Links ]
9. Presidência da República (BR). Casa Civil. Avaliação de políticas públicas: guia prático de análise ex post [Internet]. Brasília: Presidência da República; 2018 [citado 2020 set 25]. 301 p. Disponível em: https://www.ipea.gov.br/portal/index.php?option=com_content&view=article&id=34504 [ Links ]
10. Instituto Brasileiro de Geografia e Estatística - IBGE. Diretoria de Pesquisas. Coordenação de População e Indicadores Sociais. Gerência de Estudos e Análises da Dinâmica Demográfica. Projeção da população do Brasil e Unidades da Federação por sexo e idade para o período 2000-2030 [Internet]. Rio de Janeiro: Instituto Brasileiro de Geografia e Estatística; 2020 [citado 2020 set 25]. Disponível em: http://tabnet.datasus.gov.br/cgi/tabcgi.exe?ibge/cnv/projpopuf.def [ Links ]
11. Inloco. Mapa brasileiro da COVID-19 [Internet]. São Paulo: Inloco; 2020 [citado 27 abr 2020]. Disponível em: https://www.inloco.com.br/pt/covid-19 [ Links ]
12. Ministério da Saúde (BR). Secretaria de Ciência Tecnologia e Insumos Estratégicos. Departamento de Ciência e Tecnologia. Diretrizes metodológicas: diretriz de avaliação econômica [Internet]. Brasília: Ministério da Saúde; 2014 [citado 2020 set 25]. 132 p. Disponível em: http://bvsms.saude.gov.br/bvs/publicacoes/diretrizes_metodologicas_diretriz_avaliacao_economica.pdf [ Links ]
13. Vynnycky E, White RG, Fine P. An introduction to infectious disease modelling. Oxford: Oxford University Press; 2010. [ Links ]
14. Rocha Filho TM, Santos FSG, Gomes VB, Rocha TAH, Croda JHR, Ramalho WM, et al. Expected impact of COVID-19 outbreak in a major metropolitan area in Brazil. medRxiv Prepr [Internet]. 2020 Mar [cited 2020 sep 25]. Available from: https://doi.org/10.1101/2020.03.14.20035873 [ Links ]
15. Hill A. Modeling COVID-19 spread vs healthcare capacity [Internet]. [S.l.]; 2020 [cited 2020 Sep 25]. Available from: https://alhill.shinyapps.io/COVID19seir/ [ Links ]
16. Penn University. CHIME model: discrete-time SIR modeling of infections/recovery [Internet]. [S.l.]; 2020 [cited 2020 Sep 25]. Available from: https://code-for-philly.gitbook.io/chime/what-is-chime/sir-modeling [ Links ]
17. Eikenberry SE, Mancuso M, Iboi E, Phan T, Eikenberry K, Kuang Y, et al. To mask or not to mask: modeling the potential for face mask use by the general public to curtail the COVID-19 pandemic. Infect Dis Model [Internet]. 2020. [ Links ]
18. World Health Organization - WHO. “Immunity passports” in the context of COVID-19 [Internet]. Genebra: World Health Organization; 2020 [cited 2020 Sep 25]. Available from: https://www.who.int/news-room/commentaries/detail/immunity-passports-in-the-context-of-covid-19 [ Links ]
19 18. Governo do Distrito Federal. Secretaria de Saúde. Boletins Informativos DIVEP/CIEVES (COE). Boletins informativos sobre coronavirus (COVID-19). Brasília: GDF; 2020. Disponível em: http://www.saude.df.gov.br/boletinsinformativos-divep-cieves/ [ Links ]
20 19. Briggs A, Claxton K, Sculpher M. Decision modelling for health economic evaluation. Oxford: Oxford University Press; 2011. 256 p. [ Links ]
21 20. Zimmermann I. Modelo de projeção da demanda por leitos de UTI por COVID-19. Mendeley Data [Internet]. 2020 set [citado 2020 set 25]. Disponível em: http://dx.doi.org/10.17632/bypzkmwnrv [ Links ]
22 21. Mellan TA, Hoeltgebaum HH, Mishra S, Whittaker C, Schnekenberg RP, Gandy A, et al. Report 21: estimating COVID-19 cases and reproduction number in Brazil. Imperial College London [Internet]. 2020 May [cited 2020 Sep 25]. Available from: https://doi.org/10.25561/78872 [ Links ]
23 22. Tariq A, Lee Y, Roosa K, Blumberg S, Yan P, Ma S, et al. Real-time monitoring the transmission potential of COVID-19 in Singapore, March 2020. medRxiv Prepr [Internet]. 2020 Jun [cited 2020 Sep 25]. Available from: https://dx.doi.org/10.1186%2Fs12916-020-01615-9 [ Links ]
24 23. Chowell G, Sattenspiel L, Bansal S, Viboud C. Mathematical models to characterize early epidemic growth: a review. Phys Life Rev [Internet]. 2016 Sep [cited 2020 sep 25];18:66-97. Available from: https://doi.org/10.1016/j.plrev.2016.07.005 [ Links ]
25 24. Wang X, Fang X, Cai Z, Wu X, Gao X, Min J, et al. Comorbid chronic diseases and acute organ injuries are strongly correlated with disease severity and mortality among COVID-19 patients: a systemic review and meta-analysis. Research (Wash D C) [Internet]. 2020 Apr [cited 2020 Sep 25];2020:2402961. Available from: https://doi.org/10.34133/2020/2402961 [ Links ]
26 25. Sanche S, Lin YT, Xu C, Romero-Severson E, Hengartner N, Ke R. The novel Coronavirus, 2019-nCoV, is highly contagious and more infectious than initially estimated. medRxiv Prepr [Internet]. 2020 Feb [cited 2020 Sep 25]. Available from: https://doi.org/10.1101/2020.02.07.20021154 [ Links ]
27 26. Linton NM, Kobayashi T, Yang Y, Hayashi K, Akhmetzhanov AR, Jung S, et al. Incubation period and other epidemiological characteristics of 2019 novel coronavirus infections with right truncation: a statistical analysis of publicly available case data. J Clin Med [Internet]. 2020 Feb [cited 2020 Sep 25];9(2):538. Available from: https://dx.doi.org/10.3390%2Fjcm9020538 [ Links ]
28 27. Verity R, Okell LC, Dorigatti I, Winskill P, Whittaker C, Imai N, et al. Estimates of the severity of coronavirus disease 2019: a model-based analysis. Lancet Infect Dis [Internet]. 2020 Mar [cited 2020 Sep 25];20(6):669-77. Available from: https://doi.org/10.1016/S1473-3099(20)30243-7 [ Links ]
29 28. Neil M Ferguson, Laydon D, Nedjati-Gilani G, Imai N, Ainslie K, Baguelin M, et al. Impact of non-pharmaceutical interventions (NPIs) to reduce COVID-19 mortality and healthcare demand. Imperial College London [Internet]. 2020 [cited 2020 Sep 25]. Available from: https://www.imperial.ac.uk/mrc-global-infectious-disease-analysis/covid-19/report-9-impact-of-npis-on-covid-19/ [ Links ]
30 29. Grasselli G, Zangrillo A, Zanella A, Antonelli M, Cabrini L, Castelli A, et al. Baseline characteristics and outcomes of 1591 patients infected with SARS-CoV-2 admitted to ICUs of the Lombardy Region, Italy. JAMA [Internet]. 2020 Apr [cited 2020 Sep 25];323(16):1574-81. Available from: https://dx.doi.org/10.1001%2Fjama.2020.5394 [ Links ]
Supplementary Material 1 - Transitions and equations
Following contact with an infected person, an individual who up to then was susceptible ( S ) becomes exposed ( E ) during a period of latency. This period is related to average disease incubation time. Following the latency period, the individual becomes infectious ( I1 ) and can spread infection before being hospitalized ( I2 or I3 ) or being removed ( R ) from circulation by being placed in quarantine. Hospitalization was foreseen for individuals who, following a mild clinical picture ( I1 ), progressed to a severe clinical picture ( I2 ) or a critical clinical picture ( I3 ). In keeping with the follow-up of patients with COVID-19, in the case of patients who progress to a critical clinical picture, transition to death is foreseen according to specific lethality of the disease ( µ ). In each of the compartments of hospitalized individuals, the possibility is also foreseen of them being removed from the model depending on length of hospitalization ( γ−1 ). The transitions between the compartments were solved by a system of equations, whereby the total population ( N ) is equal to and represents the sum of susceptible ( S ), exposed ( E ), infected ( I ), removed ( R ) and dead ( M ) individuals at each moment in time t of the model. The model's differential equation system is shown in equations 1 to 8 :
Below we present equations that are complementary to the model's differential equation system, where fhosp refers to the fraction of individuals who progressed to hospitalization, futi refers to the fraction of hospitalized individuals who progressed to a critical clinical picture, and ifr refers to lethality:
Relationship between social distancing and transmission coefficient
With the aim of simulating the spread of the disease in view of the effects of social distancing, we calculated the transmission coefficient ( β ), based on available epidemic estimates and social isolation estimates. 17,24 As such, we take into consideration here the dynamic relationship whereby the effect contact rate ( β ) at each moment in time follows the function of a transmissibility factor ( τ ), this being a more stable factor strongly associated with pathogen virulence, and the function of a exposed individual contact factor ( c ), this being a more dynamic factor and dependent on social isolation, i.e. β = τc . As such, the isolation levels recorded daily in the Federal District time series, are imputed in the model as a complement of factor c . Likewise, similarly to what was proposed by Eikenberry et al., 17 the value of τ was estimated by means of calibration using the values of the time series of the number of ICU hospitalizations due to COVID-19 in the Federal District between 22/3/2020 and 21/5/2020.
Once the transmission coefficient β was obtained, we also calculated the instantaneous reproduction number ( Rt ) for each day in the period analyzed, with the aim of illustrating the dynamics of the spread of COVID-19 as per the proposed scenarios. In keeping with previous methodological approaches, the instantaneous reproduction number ( Rt ) considers the specific rates of entering and leaving the infectious compartment by means of equation 17 :
Supplementary Material 2 - Infection, hospitalization and lethality rates expected for COVID-19, according to age structure, in the Federal District, Brazil
| Age range (years) | Inhabitants | Frequency (%) | Infection rate (per 10,000 inhab.) | Hospitalization rate of infected people (%) | Lethality of infected people (%) |
|---|---|---|---|---|---|
| 0-9 | 419,57 | 13.00 | 0.36 | 0.00 | 0.00 |
| 10-19 | 450,663 | 13.98 | 13.73 | 0.04 | 0.01 |
| 20-29 | 594,106 | 18.43 | 14.92 | 1.04 | 0.03 |
| 30-39 | 570,790 | 17.71 | 14.24 | 3.43 | 0.08 |
| 40-49 | 483,968 | 15.02 | 13.99 | 4.25 | 0.16 |
| 50-59 | 336,382 | 10.44 | 15.98 | 8.16 | 0.60 |
| 60-69 | 207,838 | 6.45 | 15.33 | 11.80 | 1.93 |
| 70-79 | 110,260 | 3.42 | 15.14 | 16.60 | 4.28 |
| ≥80 | 49,884 | 1.55 | 12.87 | 18.40 | 7.80 |
| Total | 3,223,048 | 100.00 | 13.02 | 4.57 | 0.58 |
Sources: Brazilian Institute of Geography and Statistics (IBGE) 10 and Verity et al. 28
Supplementary Material 3 - Time series of cumulative confirmed COVID-19 cases, intensive care hospitalizations, number of deaths and percentage social isolation in the Federal District, Brazil
| Date | Cumulative cases | ICU a hospitalizations | Cumulative deaths | Percentage isolation |
|---|---|---|---|---|
| 1/3/2020 | 1 | – | – | 0.4090 |
| 2/3/2020 | 1 | – | – | 0.2740 |
| 3/3/2020 | 1 | – | – | 0.2810 |
| 4/3/2020 | 1 | – | – | 0.2930 |
| 5/3/2020 | 1 | – | – | 0.2960 |
| 6/3/2020 | 1 | – | – | 0.2900 |
| 7/3/2020 | 1 | – | – | 0.3180 |
| 8/3/2020 | 1 | – | – | 0.3980 |
| 9/3/2020 | 1 | – | – | 0.2891 |
| 10/3/2020 | 1 | – | – | 0.2880 |
| 11/3/2020 | 2 | – | – | 0.2770 |
| 12/3/2020 | 2 | – | – | 0.3220 |
| 13/3/2020 | 2 | – | – | 0.3190 |
| 14/3/2020 | 6 | – | – | 0.3650 |
| 15/3/2020 | 8 | – | – | 0.4260 |
| 16/3/2020 | 13 | – | – | 0.3430 |
| 17/3/2020 | 22 | – | – | 0.3430 |
| 18/3/2020 | 26 | – | – | 0.3670 |
| 19/3/2020 | 42 | – | – | 0.3990 |
| 20/3/2020 | 87 | – | – | 0.4430 |
| 21/3/2020 | 100 | – | – | 0.5670 |
| 22/3/2020 | 117 | 1 | – | 0.6560 |
| 23/3/2020 | 133 | 1 | 1 | 0.5590 |
| 24/3/2020 | 177 | 1 | 1 | 0.6110 |
| 25/3/2020 | 182 | 6 | 1 | 0.5710 |
| 26/3/2020 | 201 | 6 | 1 | 0.5610 |
| 27/3/2020 | 241 | 8 | 1 | 0.5340 |
| 28/3/2020 | 260 | 13 | 1 | 0.5700 |
| 29/3/2020 | 298 | 19 | 2 | 0.5990 |
| 30/3/2020 | 312 | 20 | 2 | 0.5761 |
| 31/3/2020 | 333 | 30 | 3 | 0.5010 |
| 1/4/2020 | 370 | 30 | 4 | 0.4730 |
| 2/4/2020 | 400 | 41 | 6 | 0.4980 |
| 3/4/2020 | 419 | 40 | 9 | 0.4870 |
| 4/4/2020 | 456 | 38 | 10 | 0.5100 |
| 5/4/2020 | 468 | 41 | 12 | 0.5770 |
| 6/4/2020 | 485 | 37 | 12 | 0.4890 |
| 7/4/2020 | 503 | 40 | 12 | 0.4720 |
| 8/4/2020 | 509 | 42 | 13 | 0.4640 |
| 9/4/2020 | 527 | 35 | 14 | 0.4470 |
| 10/4/2020 | 556 | 33 | 14 | 0.5480 |
| 11/4/2020 | 592 | 32 | 14 | 0.4760 |
| 12/4/2020 | 618 | 33 | 16 | 0.5370 |
| 13/4/2020 | 641 | 30 | 17 | 0.4690 |
| 14/4/2020 | 651 | 28 | 19 | 0.4680 |
| 15/4/2020 | 688 | 30 | 22 | 0.4750 |
| 16/4/2020 | 727 | 29 | 22 | 0.4570 |
| 17/4/2020 | 756 | 25 | 24 | 0.4350 |
| 18/4/2020 | 796 | 26 | 24 | 0.4780 |
| 19/4/2020 | 860 | 28 | 24 | 0.5420 |
| 20/4/2020 | 875 | 28 | 24 | 0.4630 |
| 21/4/2020 | 913 | 29 | 24 | 0.5360 |
| 22/4/2020 | 959 | 30 | 25 | 0.4500 |
| 23/4/2020 | 968 | 30 | 26 | 0.4580 |
| 24/4/2020 | 1,012 | 32 | 26 | 0.4330 |
| 25/4/2020 | 1,020 | 34 | 27 | 0.4610 |
| 26/4/2020 | 1,125 | 34 | 27 | 0.5280 |
| 27/4/2020 | 1,189 | 35 | 28 | 0.4450 |
| 28/4/2020 | 1,230 | 36 | 28 | 0.4410 |
| 29/4/2020 | 1,313 | 38 | 28 | 0.4300 |
| 30/4/2020 | 1,423 | 38 | 30 | 0.4210 |
| 1/5/2020 | 1,546 | 43 | 31 | 0.4930 |
| 2/5/2020 | 1,605 | 45 | 32 | 0.4440 |
| 3/5/2020 | 1,720 | 49 | 33 | 0.4960 |
| 4/5/2020 | 1,793 | 59 | 33 | 0.4370 |
| 5/5/2020 | 1,837 | 56 | 34 | 0.4240 |
| 6/5/2020 | 2,046 | 60 | 35 | 0.4220 |
| 7/5/2020 | 2,258 | 60 | 35 | 0.4290 |
| 8/5/2020 | 2,442 | 64 | 37 | 0.4010 |
| 9/5/2020 | 2,576 | 66 | 39 | 0.4250 |
| 10/5/2020 | 2,682 | 72 | 42 | 0.4540 |
| 11/5/2020 | 2,799 | 78 | 44 | 0.4290 |
| 12/5/2020 | 2,979 | 87 | 46 | 0.4280 |
| 13/5/2020 | 3,192 | 92 | 48 | 0.4210 |
| 14/5/2020 | 3,416 | 94 | 51 | 0.4190 |
| 15/5/2020 | 3,786 | 86 | 55 | 0.4120 |
| 16/5/2020 | 4,140 | 84 | 56 | 0.4472 |
| 17/5/2020 | 4,368 | 116 | 59 | 0.5176 |
| 18/5/2020 | 4,618 | 121 | 66 | 0.4248 |
| 19/5/2020 | 4,853 | 125 | 72 | 0.4205 |
| 20/5/2020 | 5,271 | 142 | 78 | 0.4120 |
| 21/5/2020 | 5,542 | 138 | 84 | 0.4121 |
| 22/5/2020 | 5,948 | – | 90 | 0.3986 |
| 23/5/2020 | 6,248 | – | 95 | 0.4330 |
| 24/5/2020 | 6,638 | – | 104 | 0.5137 |
| 25/5/2020 | 6,930 | – | 114 | 0.4214 |
| 26/5/2020 | 7,210 | – | 124 | 0.4111 |
| 27/5/2020 | 7,761 | – | 133 | 0.4054 |
| 28/5/2020 | 8,300 | – | 142 | 0.4084 |
| 29/5/2020 | 8,722 | – | 154 | 0.3922 |
| 30/5/2020 | 9,474 | – | 162 | 0.4228 |
| 31/5/2020 | 9,780 | – | 170 | 0.4950 |
| 1/6/2020 | 10,510 | – | 171 | 0.4085 |
| 2/6/2020 | 11,256 | – | 177 | 0.4040 |
| 3/6/2020 | 11,398 | – | 181 | 0.3948 |
| 4/6/2020 | 12,923 | – | 196 | 0.3875 |
| 5/6/2020 | 14,208 | – | 202 | 0.3884 |
| 6/6/2020 | 15,850 | – | 208 | 0.3983 |
| 7/6/2020 | 16,623 | – | 214 | 0.4769 |
| 8/6/2020 | 16,948 | – | 226 | 0.3927 |
| 9/6/2020 | 18,090 | – | 236 | 0.3828 |
| 10/6/2020 | 19,433 | – | 256 | 0.3936 |
| 11/6/2020 | 20,507 | – | 274 | 0.4451 |
| 12/6/2020 | 21,396 | – | 282 | 0.3727 |
| 13/6/2020 | 21,959 | – | 293 | 0.4054 |
| 14/6/2020 | 22,871 | – | 304 | 0.4830 |
| 15/6/2020 | 23,684 | – | 319 | 0.3953 |
| 16/6/2020 | 25,379 | – | 348 | 0.4051 |
| 17/6/2020 | 27,140 | – | 365 | 0.3875 |
| 18/6/2020 | 28,521 | – | 379 | 0.3966 |
| 19/6/2020 | 30,902 | – | 396 | 0.3562 |
| 20/6/2020 | 32,238 | – | 405 | 0.4042 |
| 21/6/2020 | 33,227 | – | 423 | 0.4839 |
| 22/6/2020 | 34,148 | – | 449 | 0.4039 |
| 23/6/2020 | 35,368 | – | 475 | 0.3969 |
| 24/6/2020 | 37,254 | – | 495 | 0.3932 |
| 25/6/2020 | 38,871 | – | 509 | 0.3940 |
| 26/6/2020 | 41,326 | – | 532 | 0.3811 |
| 27/6/2020 | 42,766 | – | 537 | 0.4190 |
| 28/6/2020 | 44,905 | – | 548 | 0.4926 |
| 29/6/2020 | 47,071 | – | 559 | 0.4216 |
| 30/6/2020 | 49,218 | – | 587 | 0.4100 |
| 1/7/2020 | 50,676 | – | 620 | 0.4020 |
| 2/7/2020 | 52,281 | – | 631 | 0.4040 |
| 3/7/2020 | 53,996 | – | 643 | 0.3850 |
| 4/7/2020 | 55,760 | – | 671 | 0.4090 |
| 5/7/2020 | 57,854 | – | 699 | 0.4820 |
| 6/7/2020 | 60,383 | – | 726 | 0.4130 |
| 7/7/2020 | 62,694 | – | 767 | 0.3950 |
| 8/7/2020 | 64,314 | – | 801 | 0.3900 |
| 9/7/2020 | 65,677 | – | 823 | 0.4000 |
| 10/7/2020 | 67,297 | – | 856 | 0.3920 |
| 11/7/2020 | 68,406 | – | 871 | 0.4180 |
| 12/7/2020 | 70,712 | – | 902 | 0.4870 |
| 13/7/2020 | 72,284 | – | 930 | 0.4130 |
| 14/7/2020 | 73,654 | – | 960 | 0.4130 |
| 15/7/2020 | 75,379 | – | 1,001 | 0.4020 |
| 16/7/2020 | 77,621 | – | 1,037 | 0.4030 |
| 17/7/2020 | 79,400 | – | 1,060 | 0.3570 |
| 18/7/2020 | 81,163 | – | 1,075 | 0.3940 |
| 19/7/2020 | 82,412 | – | 1,085 | 0.4850 |
| 20/7/2020 | 84,287 | – | 1,112 | 0.4080 |
| 21/7/2020 | 86,076 | – | 1,158 | 0.4070 |
| 22/7/2020 | 87,801 | – | 1,176 | 0.3960 |
| 23/7/2020 | 90,023 | – | 1,218 | 0.3960 |
| 24/7/2020 | 92,414 | – | 1,244 | 0.3880 |
| 25/7/2020 | 94,187 | – | 1,275 | 0.4110 |
| 26/7/2020 | 96,332 | – | 1,308 | 0.4810 |
| 27/7/2020 | 98,480 | – | 1,339 | 0.4070 |
| 28/7/2020 | 100,726 | – | 1,391 | 0.4000 |
| 29/7/2020 | 102,342 | – | 1,419 | 0.3970 |
| 30/7/2020 | 104,442 | – | 1,444 | 0.3970 |
| 31/7/2020 | 106,292 | – | 1,469 | 0.3860 |
Sources: local Epidemiological Bulletins and the Inloco public database. 11
a)ICU: intensive care unit - data available as at 21/5/2020.
Received: May 29, 2020; Accepted: August 24, 2020
 This content is licensed under a Creative Commons Attribution 4.0 International License.
