


Servicios Personalizados
Revista

Articulo
 texto en
  Inglés (pdf)
 Articulo en XML
 Referencias del artículo
 Enviar articulo por email
Indicadores
-
 Citado por SciELO
Links relacionados
-
 Similares en
SciELO
Similares en
SciELO
Compartir

 Permalink
Epidemiologia e Serviços de Saúde
versión impresa ISSN 1679-4974versión On-line ISSN 2237-9622
Epidemiol. Serv. Saúde vol.30 no.1 Brasília 2021 Epub 10-Feb-2021
http://dx.doi.org/10.1590/s1679-49742021000100007
Original article
Evaluation of prediction models for the occurrence of malaria in the state of Amapá, Brazil, 1997-2016: an ecological study*
1Centro Universitário Saúde ABC, Faculdade de Medicina, Santo André, SP, Brazil
2Secretaria de Estado de Saúde do Acre, Diretoria de Ações Programáticas e Vigilância em Saúde, Rio Branco, AC, Brazil
2237-9622-ess-30-01-e2020080-suppl01.pdfObjective
To evaluate the predictive power of different malaria case time-series models in the state of Amapá, Brazil, for the period 1997-2016.
Methods
This is an ecological time series study with malaria cases recorded in the state of Amapá. Ten deterministic or stochastic statistical models were used for simulation and testing in 3, 6, and 12 month forecast horizons.
Results
The initial test showed that the series is stationary. Deterministic models performed better than stochastic models. The ARIMA model showed absolute errors of less than 2% on the logarithmic scale and relative errors 3.4-5.8 times less than the null model. It was possible to predict future malaria cases 6 and 12 months in advance.
Conclusion
The ARIMA model is recommended for predicting future scenarios and for earlier planning in state health services in the Amazon Region.
Key words: Time Series Studies; Malaria; Decision Support Techniques; Epidemiological Monitoring; Forecasting
Introduction
Malaria is a preventable and curable disease. However, in 2018, around 228 million cases were registered worldwide.1 Timely prevention of malaria cases allows for the allocation of adequate resources for controlling the disease and planning its elimination.3 The initiative called ‘The Malaria Eradication Research Agenda’ analyzed different important aspects for the global elimination of malaria. Predictive modeling of cases was suggested as a tool for helping the Health Surveillance sector to plan infection control actions.4
Monthly time series of new cases can be statistically adjusted in mathematical functions, using software.6 Time series can be broken down according to three basic components: (i) the seasonal component, representing the cyclic pattern of the disease over time; (ii) the linear component, understood as an increasing or decreasing linear trend in the disease over time; and (iii) the stochastic component, regarding intervening factors affecting time series without a specific pattern.
Statistical time series models may be used for predicting future cases. Autoregressive integrated moving average (ARIMA) is a pioneer method for describing and predicting time series.9 The exponential smoothing model (ETS) represents an alternative to ARIMA.10 Exponential smoothing models for adjustment of complex seasonal patterns (TBATS and BATS) are methods deemed more efficient than ARIMA.11 Another alternative can be the model dividing the seasonal component into subcomponents (STLM).12
The models described above may be deterministic and have statistical structure to break down and adjust seasonal and linear components in time series, but they cannot estimate the stochastic component. Therefore, machine learning computational approaches have been proposed to quantify the effect of the third component: the structural model (StructTS), the neural network model (NNETAR), and machine learning models (ELM, MLP) are examples of such approaches.9 Models may be compared with a null model, defined by the constant value of the last observation.17
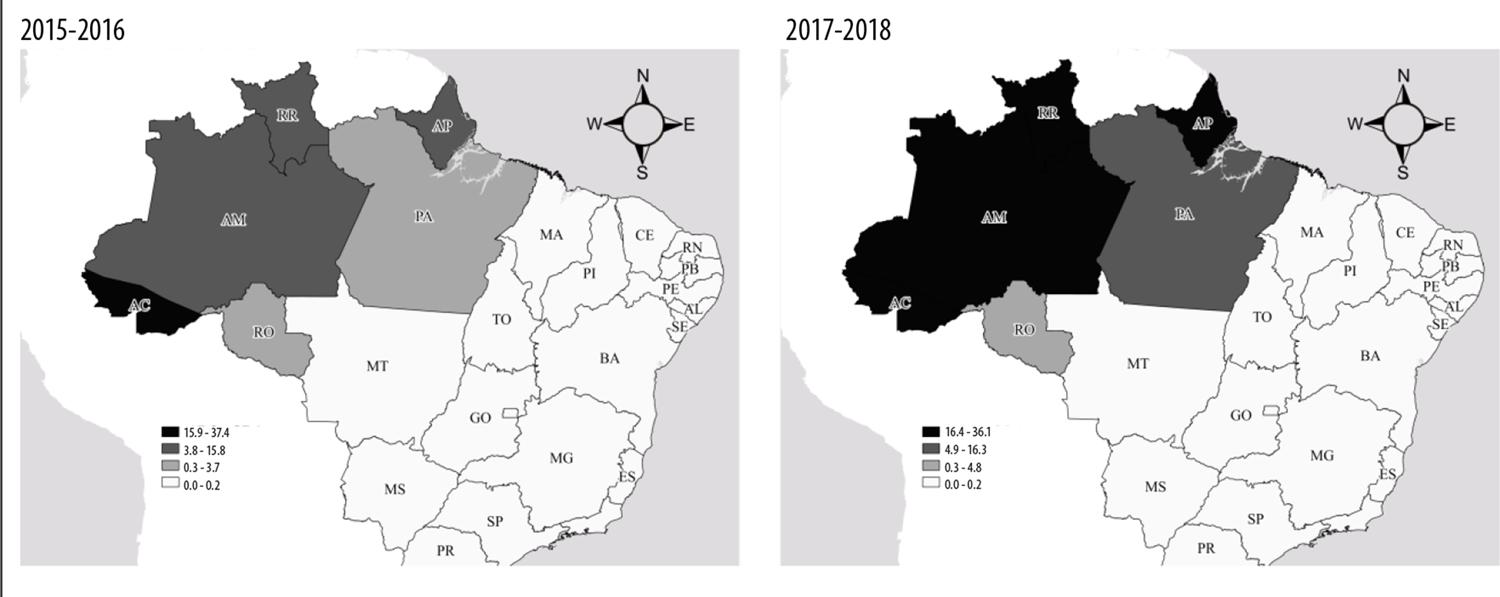
The premise of this article is that health surveillance can use predictive models of time series to predict the impact of malaria on a given Brazilian state. Malaria case incidence in the state of Amapá between 2015 and 2018 was, on average, 17 cases per 1,000 inhabitants, one of the highest rates in the country in comparison with the rates found in the states of Acre (37/1,000 inhabitants), Amazonas (17/1,000 inhabitants) and Roraima (19/1,000 inhabitants) in the same period. It is important to identify future time series of malaria cases for planning control measures. This study aims to evaluate the predictive power of different malaria case time-series models in the state of Amapá.
Methods
A statistical and computational approach was applied to the Amapá state health service, complementary to malaria control activities in Brazil as a whole, in accordance with the terms set by the World Health Organization (WHO) for eliminating this disease.2
This was an ecological time series study, using the number of malaria cases recorded in the state of Amapá in the period from 1997 to 2016.
Amapá is one of Brazil’s most important endemic malaria regions (Figure 1). Its predominant climate, according to Köppen-Geiger's climatic classification, is tropical monsoon, that is, hot and very humid, with average rainfall indexes of 3,300mm annually. The largest portion of the state (73%; 97,000km2) is covered by native vegetation. In 2019, Amapá's population totaled 830,000 inhabitants, distributed over 16 municipalities.
Malaria data (autochthonous cases, identified through microscopy slides testing positive for Plasmodium – using the thick smear technique) were obtained from the following Health Ministry Health Surveillance Secretariat information systems: National Malaria Control Program Information System (SISMAL) for the period 1997-2003; and the Malaria Epidemiological Surveillance Information System (SIVEP-Malaria) for the period 2003-2016.
Three quantitative discrete variables were used with natural logarithm transformation:18
number of monthly cases of malaria, from January 1997 to December 2015 (this variable was used to adjust the parameters of the statistical models);
Estimated values, from January to December 2016 (predictor variable, used to test the predictive power of the statistical models); and
number of monthly cases of malaria, from January to December 2016 (test variable, compared with predictor variable).
The statistical approach used was based on time series models. The first procedure involved the Dickey-Fuller test, increased to a 5% significance level, to test whether the time series was stationary or not. The stationary premise was assumed using statistical models, described later in this text.
The time series encompassed 240 months, from January 1997 to December 2016, divided into two periods: training period, from January 1997 to December 2015; and test period, from January to December 2016. The number of monthly cases of malaria in the training period was used to adjust each one of the statistical models and estimate time component parameters (seasonality; linear trend; stochastic effect). The number of monthly cases of malaria in the test period was used for comparison with the values estimated by the statistical models. The test was conducted with three prediction time horizons: 12 months in advance (January to December 2016); six months in advance (July to December 2016); and three months in advance (October to December 2016). The result of each test was used to assess the predictive power of the models.
The statistical models used were:
Three criteria were considered for assessment of the predictive power of the statistical models:
Mean Absolute Percentage Error (MAPE), where At is the real value and Ft is the prediction value. The values are added up for each point predicted in time, and the result is divided by the number of n points. Multiplying by 100% makes MAPE a percentage error, according to the following formula:
Relative MAPE scale, in which the null model MAPE is divided by the MAPE values of the remaining models. If the result of such division is less than or equal to 1, the model is classified as bad; if it is greater than 1 and less than or equal to 2, the model is classified as having low predictive power; and if it is greater than 2, the model presents reliable predictive power.
Uncertainty coefficient (Theil’s U). This is a relative accuracy measure, intended to eliminate statistical models with high deviations in relation to the average value. Values less than 1 mean the predictive power is reliable.17
A predictive power deemed acceptable was then defined as (i) lowest MAPE value, (ii) values greater than 2 for the null model MAPE scale, and (iii) values less than 1 for Theil’s U.
The analyses were conducted in the R computing environment, through a corrected and validated script that can be reproduced by Municipal and State Health Department surveillance staff in Brazil (Supplementary material).19
Results
The total number of malaria cases was 403,832, with an average of 1,771 cases per month and median of 1,518 cases/month, with 1,021 cases in the first quartile and 2,079 cases in the third quartile - standard deviation (SD) = 918 cases. The increased Dickey-Fuller value showed that the time series is stationary (test value = -5.352; p-value <0.01). The minimum number of cases was 487 (May 2014), while the maximum was 5,944 (October 2000), consistent with the seasonal nature of malaria in the state (Table 1).
Table 1 – Number of confirmed malaria cases per month and year, Amapá, January 1997 - December 2016
| Year | January | February | March | April | May | June | July | August | September | October | November | December | Total |
|---|---|---|---|---|---|---|---|---|---|---|---|---|---|
| 1997 | 1,997 | 1,520 | 1,023 | 1,096 | 1,030 | 1,364 | 2,108 | 2,708 | 3,506 | 3,592 | 2,814 | 2,110 | 24,868 |
| 1998 | 1,633 | 1,863 | 1,566 | 1,524 | 1,773 | 1,899 | 2,005 | 2,534 | 3,001 | 1,795 | 1,929 | 1,047 | 22,569 |
| 1999 | 1,077 | 1,124 | 994 | 661 | 809 | 801 | 1,594 | 3,472 | 4,435 | 4,963 | 5,570 | 3,146 | 28,646 |
| 2000 | 2,473 | 2,731 | 1,632 | 1,269 | 1,563 | 1,714 | 2,377 | 4,336 | 3,767 | 5,944 | 4,574 | 2,898 | 35,278 |
| 2001 | 2,861 | 2,510 | 2,019 | 1,513 | 1,638 | 1,760 | 1,920 | 2,496 | 2,466 | 2,588 | 1,731 | 985 | 24,487 |
| 2002 | 1,422 | 1,250 | 849 | 671 | 593 | 649 | 971 | 1,953 | 2,330 | 2,174 | 2,144 | 1,251 | 16,257 |
| 2003 | 963 | 854 | 704 | 690 | 755 | 953 | 1,622 | 1,601 | 2,118 | 2,456 | 2,258 | 1,677 | 16,651 |
| 2004 | 1,949 | 1,972 | 1,453 | 987 | 1,014 | 1,126 | 1,408 | 1,954 | 1,848 | 2,731 | 2,387 | 1,841 | 20,670 |
| 2005 | 1,872 | 2,524 | 2,214 | 1,331 | 1,517 | 1,546 | 2,252 | 3,133 | 3,416 | 3,615 | 2,681 | 1,958 | 28,059 |
| 2006 | 2,505 | 1,500 | 1,231 | 1,101 | 1,582 | 1,637 | 2,403 | 3,393 | 3,431 | 4,371 | 3,750 | 2,386 | 29,290 |
| 2007 | 2,527 | 1,743 | 1,560 | 1,314 | 1,254 | 1,241 | 1,801 | 2,147 | 2,036 | 3,119 | 1,914 | 1,319 | 21,975 |
| 2008 | 1,217 | 957 | 823 | 770 | 872 | 745 | 960 | 1,121 | 1,721 | 2,099 | 2,144 | 1,702 | 15,131 |
| 2009 | 1,558 | 1,133 | 955 | 860 | 1,049 | 1,036 | 1,096 | 1,501 | 1,816 | 1,783 | 1,541 | 1,176 | 15,504 |
| 2010 | 1,466 | 1,143 | 994 | 730 | 892 | 970 | 1,384 | 1,390 | 1,292 | 1,553 | 2,072 | 1,502 | 15,388 |
| 2011 | 1,119 | 872 | 830 | 723 | 923 | 941 | 1,348 | 2,254 | 2,324 | 2,639 | 3,115 | 1,910 | 18,998 |
| 2012 | 1,685 | 1,257 | 1,040 | 693 | 863 | 917 | 1,272 | 1,344 | 1,234 | 1,619 | 1,925 | 1,432 | 15,281 |
| 2013 | 1,675 | 1,401 | 939 | 842 | 710 | 717 | 918 | 1,272 | 1,445 | 2,121 | 2,004 | 1,250 | 15,294 |
| 2014 | 1,057 | 806 | 599 | 516 | 487 | 516 | 646 | 1,201 | 1,844 | 2,163 | 2,199 | 1,521 | 13,555 |
| 2015 | 1,504 | 1,097 | 767 | 597 | 558 | 635 | 971 | 1,234 | 1,705 | 1,906 | 1,606 | 1,078 | 13,658 |
| 2016 | 1,138 | 1,040 | 667 | 532 | 580 | 673 | 962 | 1,296 | 1,585 | 1,554 | 1,321 | 925 | 12,273 |
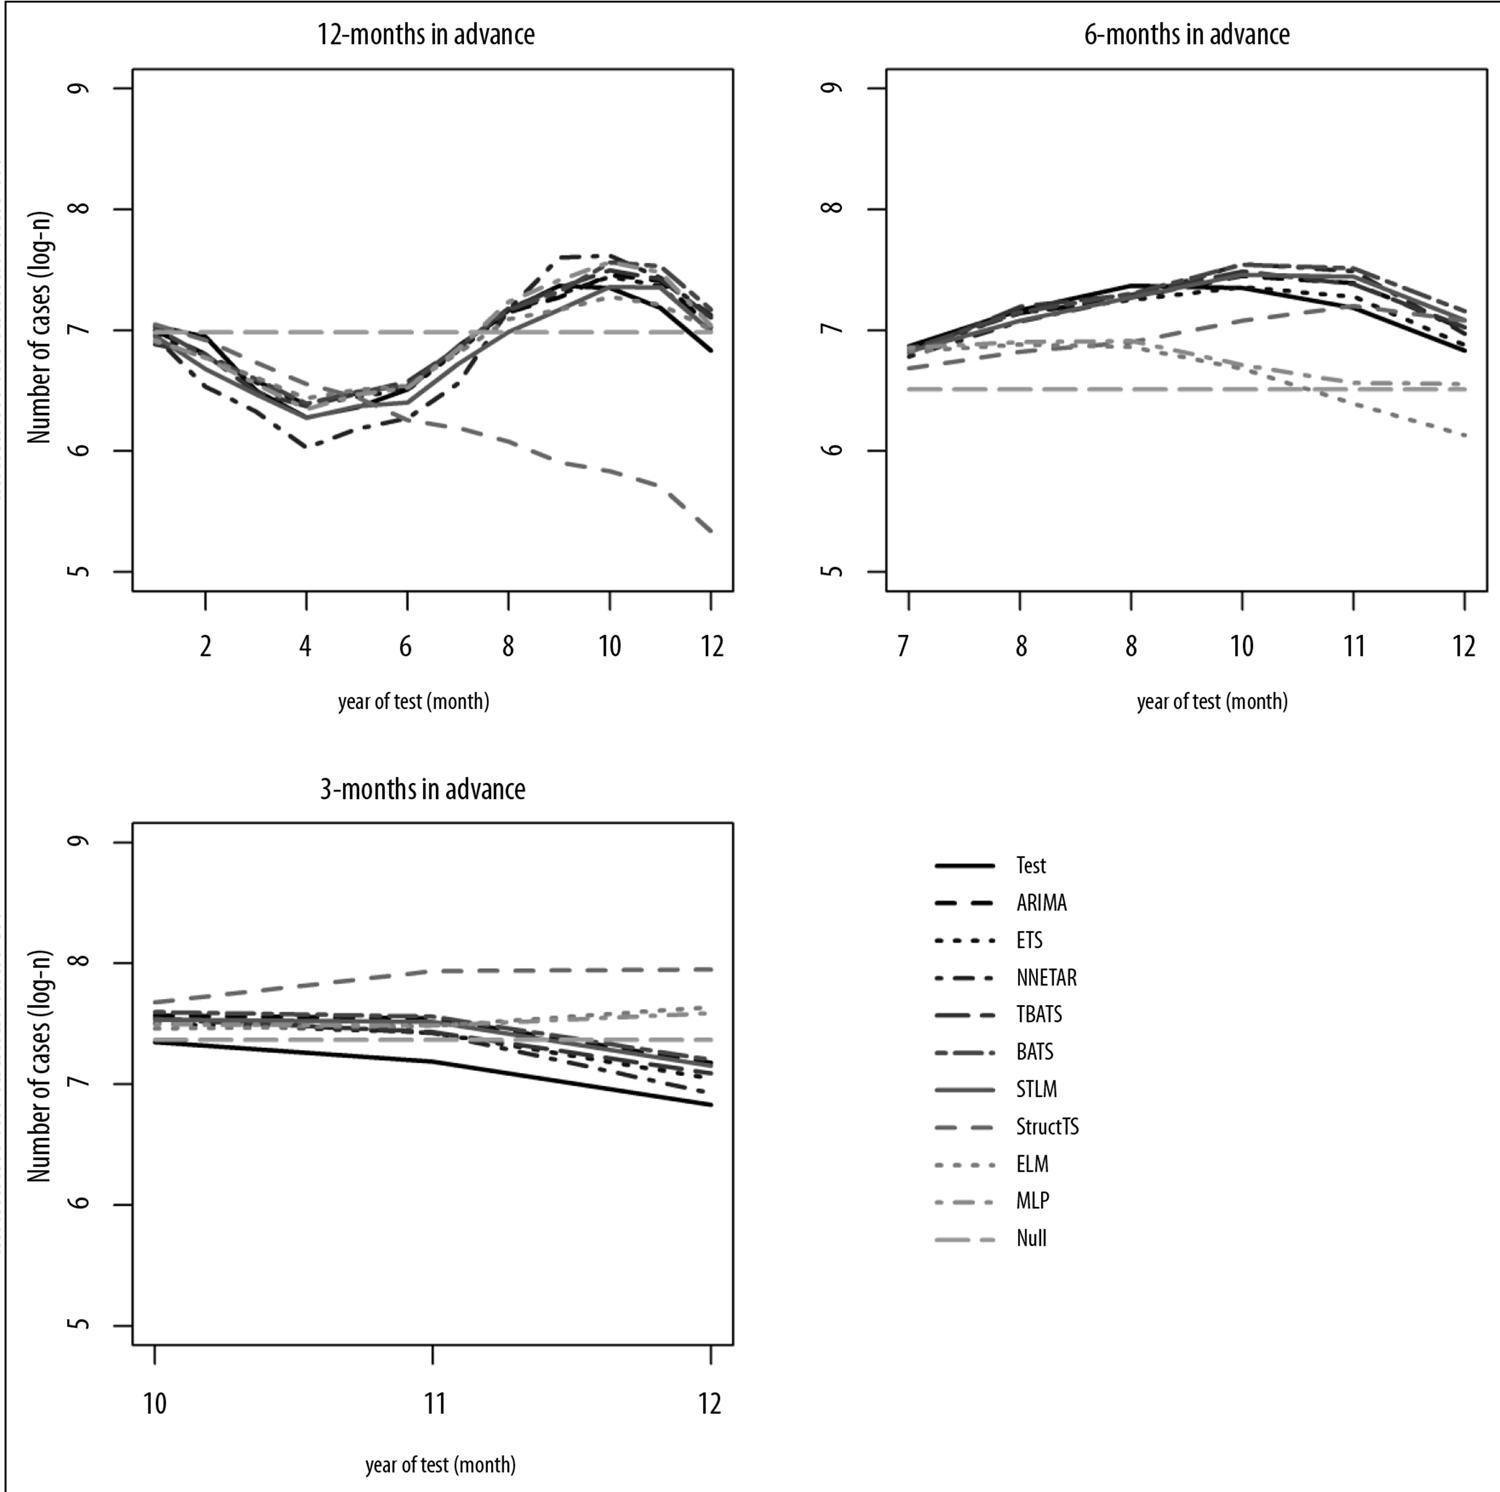
Table 2 presents the performance of the models according to the criteria for assessing predictive power and the three selected prediction time horizons. In the 12 and six month time horizons, all deterministic models (ETS, ARIMA, STLM, BATS and TBATS) showed reliable predictive power. However, none of the stochastic models showed reliability in predicting future cases of malaria for those time horizons.
Table 2 – Comparison of performance of statistical models according to model assessment criteria and prediction time of each time horizon for monthly malaria cases in Amapá
| Prediction time - 12-month time horizon | Prediction time - 6-month time horizon | Prediction time - 3-month time horizon | |||||||||
|---|---|---|---|---|---|---|---|---|---|---|---|
| Models | MAPEa | Relative MAPEa scale | Theil’s U | Models | MAPEa | Relative MAPEa scale | Theil’s U | Models | MAPEa | Relative MAPEa scale | Theil’s U |
| ETS | 1.25 | 3.76 | 0.40 | ETS | 0.76 | 11.28 | 0.29 | NNETAR | 2.47 | 1.44 | 0.64 |
| ARIMA | 1.39 | 3.38 | 0.47 | ARIMA | 1.47 | 5.83 | 0.56 | ETS | 2.87 | 1.24 | 0.82 |
| TBATS | 1.57 | 2.99 | 0.52 | TBATS | 1.60 | 5.36 | 0.58 | TBATS | 3.28 | 1.09 | 0.91 |
| ELM | 1.64 | 2.87 | 0.50 | STLM | 1.99 | 4.31 | 0.73 | Null | 3.56 | 1.00 | 1.45 |
| STLM | 1.63 | 2.88 | 0.57 | NNETAR | 2.16 | 3.97 | 0.76 | STLM | 3.96 | 0.90 | 1.17 |
| MLP | 1.66 | 2.83 | 0.55 | BATS | 2.24 | 3.83 | 0.93 | ARIMA | 4.36 | 0.82 | 1.27 |
| BATS | 1.81 | 2.60 | 0.68 | StructTS | 3.57 | 2.40 | 1.29 | BATS | 4.67 | 0.76 | 1.34 |
| NNETAR | 3.29 | 1.43 | 1.01 | MLP | 5.24 | 1.64 | 1.96 | MLP | 5.74 | 0.62 | 2.08 |
| Nulo | 4.70 | 1.00 | 1.63 | ELM | 6.97 | 1.23 | 2.53 | ELM | 5.82 | 0.61 | 2.20 |
| StructTS | 10.15 | 0.46 | 3.75 | Null | 8.57 | 1.00 | 2.88 | StructTS | 10.44 | 0.34 | 3.43 |
a) MAPE: mean absolute percentage error.
Notes:
ARIMA, ETS, TBATS, BATS and STLM: deterministic models.
StructTS, NNETAR, ELM and MLP: stochastic models.
Null: null model.
The three-month time horizon surprisingly showed itself to be challenging for all the models. Finally, no model was deemed reliable for predicting malaria cases three months in advance (Figure 2).
Discussion
Deterministic models showed themselves to be reliable for predicting the monthly number of cases of malaria in the next 12 or six months in the state of Amapá. This result may be interpreted as follows: the time series being studied has characteristics that enable better performance by deterministic models. This is because time series with (i) a strong seasonal component, (ii) relatively low linear trend (for example, temporal stationarity) and (iii) low or null stochastic effect are satisfactorily adjusted by deterministic models such as ARIMA. Theoretically, statistical models able to detect stochastic effects can present better performance, in comparison to deterministic models, in the case of time series with (i) lack of seasonality, (ii) high linear trend, and (iii) stochastic effects.20 However, none of the assessed models presented reliable results for predicting the number of monthly cases of malaria in the three-month time horizon. Prediction of malaria in short future periods also proved to be unsatisfactory in another study, in which deterministic models were applied in districts of Sri Lanka between 1972 and 2005.18 That study discouraged using statistical models for predicting malaria cases in near future periods of one month in advance, notwithstanding the period of the study in Sri Lanka being shorter than the shortest period in our study.
A limitation of the present study is the impossibility of predicting malaria cases for short periods in advance, such as 3 months. Another limitation is the fact that, when using the state of Amapá as unit of analysis, local scale information is lost. The advantages of this approach, however, are the possibility of predicting malaria cases 12 or six months in advance and using deterministic statistical models. As these models are easier for health service managers to understand, this makes their implementation in health services more viable.21
The potential use of time series techniques in epidemiological studies, disease surveillance and malaria outbreak prediction has been explored in different studies.18 For example, a study with similar design, conducted in the north of Thailand from 1999 to 2004, found deterministic models enabling future prediction of malaria and dengue fever one to four months in advance, to the extent its authors suggest using such models for allocating resources in controlling and preventing these diseases.22 Another study with deterministic models, conducted in Sudan, between 2009 and 2013, showed that the predictive power of the models used varied according to each state (of that country).23 Deterministic models used for predicting malaria in Afghanistan, between 2005 and 2015, led to reliable predictions for 12 to four months in advance.24
Considering that, among deterministic models, ARIMA is the most widely applied in the literature and has predictive characteristics for diseases affected by seasonality,22 we recommend its implementation as a protocol for predicting monthly malaria cases for long-term horizons - 12 or six months – on a state-wide scale in the Brazilian Amazon state of Amapá.
REFERENCES
1. World Health Organization - WHO. World malaria report 2019 [Internet]. Genebra: World Health Organization; 2019 [cited 2020 Sep 28]. 232 p. Available from: https://www.who.int/publications/i/item/world-malaria-report-2019 [ Links ]
2. Organização Mundial da Saúde - OMS. Estratégia técnica mundial para o paludismo 2016-2030 [Internet]. Geneva: Organização Mundial da Saúde; 2015 [citado 2020 set 28]. 30 p. Disponível em: https://apps.who.int/iris/bitstream/handle/10665/176712/9789248564994_por.pdf?sequence=6 [ Links ]
3. Gomez-Elipe A, Otero A, Van Herp M, Aguirre-Jaime A. Forecasting malaria incidence based on monthly case reports and environmental factors in Karuzi, Burundi, 1997-2003. Malar J [Internet]. 2007 Sep [cited 2020 Sep 28];6(129):1-10. Available from: https://doi.org/10.1186/1475-2875-6-129 https://doi.org/10.1186/1475-2875-6-129 [ Links ]
4. The malERA Consultative Group on Modeling. A research agenda for malaria eradication: modeling. PLoS Med [Internet]. 2011 Jan [cited 2020 Sep 28];8(1). Available from: https://doi.org/10.1371/journal.pmed.1000403 [ Links ]
5. The malERA Consultative Group on Modeling. A research agenda for malaria eradication: monitoring, evaluation, and surveillance. PLoS Med [Internet]. 2011 Jan [cited 2020 Sep 28];8(1). Available from: https://doi.org/10.1371/journal.pmed.1000400 [ Links ]
6. Hyndman RJ, Khandakar Y. Automatic time series forecasting: the forecast package for R. J Stat Softw [Internet]. 2008 Jul [cited 2020 Sep 28];27(3):C3. Available from: http://dx.doi.org/10.18637/jss.v027.i03 [ Links ]
7. Hyndman JR, Anne KB, Ralph SD, Simone G. A state space framework for automatic forecasting using exponential smoothing methods. Int J Forecast [Internet]. 2002 Jul-Sep [cited 2020 Sep 28];18(3):439-54. Available from: https://doi.org/10.1016/S0169-2070(01)00110-8 [ Links ]
8. Livera AM, Hyndman RJ, Snyder RD. Forecasting time series with complex seasonal patterns using exponential smoothing. J Am Stat Assoc [Internet]. 2011 Jan [cited 2020 Sep 28];106(496):1513-27. Available from: https://doi.org/10.1198/jasa.2011.tm09771 [ Links ]
9. Dokumentov A, Hyndman RJ. STR: a seasonal-trend decomposition procedure based on regression. Monash Econometrics and Business Statistics Working Papers [Internet]. 2015 [cited 2020 Sep 28]. Available from: https://robjhyndman.com/publications/str/ [ Links ]
10. Cleveland R, Cleveland W, McRae J, Terpenning I. STL: a seasonal-trend decomposition procedure based on Loess (with discussion). J Off Stat [Internet]. 1990;6(1):3-73. Available from: https://www.wessa.net/download/stl.pdf [ Links ]
11. Durbin J, Koopman SJ. Time series analysis by state space methods. Oxford University Press; 2013. [ Links ]
12. Crone SF, Kourentzes N. Feature selection for time series prediction - A combined filter and wrapper approach for neural networks. Neurocomputing [Internet]. 2010 Jun [cited 2020 Sep 28];73(10-12):1923-36. Available from: https://doi.org/10.1016/j.neucom.2010.01.017 [ Links ]
13. Kourentzes N, Barrow DK, Crone SF. Neural network ensemble operators for time series forecasting. Expert Syst Appl [Internet]. 2014 Jul [cited 2020 Seo 28];41(9):4235-44. Available from: https://doi.org/10.1016/j.eswa.2013.12.011 [ Links ]
14. Hyndman RJ, Athanasopoulos G. Forecasting: principles and practice. 2nd ed. [S.l.]: OTexts; 2018. [ Links ]
15. Morettin PA, Toloi CM. Análise de séries temporais: modelos lineares univariados. 3rd ed. São Paulo: Blucher; 2018. [ Links ]
16. Antunes JLF, Cardoso MRA. Uso da análise de séries temporais em estudos epidemiológicos. Epidemiol Serv Saúde [Internet]. 2015 jul-set [cited 2020 set 28];24(3):565-76. Disponível em: http://dx.doi.org/10.5123/S1679-49742015000300024 [ Links ]
17. Helfenstein U. Box-jenkins modelling of some viral infectious diseases. Stat Med [Internet]. 1986 Jan-Feb [cited 2020 Sep 28];5(1):37-47. Available from: https://doi.org/10.1002/sim.4780050107 [ Links ]
18. Briët OJT, Vounatsou P, Gunawardena DM, Galappaththy GNL, Amerasinghe PH. Models for short term malaria prediction in Sri Lanka. Malar J [Internet]. 2008 May [cited 2020 Sep 28];7(76). Available from: https://github.com/MVMLima/artigo_RESS_malaria [ Links ]
19. Lima MVM. Protocolo de programação em ambiente R e banco de dados disponíveis em repositório de acesso público [Internet]. [S.l.]: GitHub; 2020 [citado 2020 ago 5]. Disponível em: https://github.com/MVMLima/artigo_RESS_malaria [ Links ]
20. Baquero OS, Santana LMR, Chiaravalloti-Neto F. Dengue forecasting in São Paulo city with generalized additive models, artificial neural networks and seasonal autoregressive integrated moving average models. PLoS One [Internet]. 2018 Apr [cited 2020 Sep 28];13(4):1-12. Available from: https://doi.org/10.1371/journal.pone.0195065 [ Links ]
21. World Health Organization - WHO. Malaria epidemics: forecasting, prevention, early detection and control. Lesyin: World Health Organization; 2004 [cited 2020 Sep 28]. 48 p. Available from: https://apps.who.int/iris/handle/10665/70073 [ Links ]
22. Sriwattanapongse W, Khanabsakdi S. Modeling and forecasting malaria and dengue hemorrhagic fever incidence and prevalence in Nothern Thailand. J Math Syst Sci [Internet]. 2011 [cited 2020 Sep 28];1(1):52-9. Available from: https://www.semanticscholar.org/paper/Modeling-and-Forecasting-Malaria-and-Dengue-Fever-Sriwattanapongse-Khanabsakdi/b5de80ebedda6ce67bd6e5cdfee666ea2270e98d [ Links ]
23. Hussien HH, Eissa FH, Awadalla KE. Statistical methods for predicting malaria incidences using data from Sudan. Malar Res Treat [Internet]. 2017 [cited 2020 Sep 28]:4205957. Available from: https://doi.org/10.1155/2017/4205957 [ Links ]
24. Anwar MY, Lewnard JA, Parikh S, Pitzer VE. Time series analysis of malaria in Afghanistan: using ARIMA models to predict future trends in incidence. Malar J [Internet]. 2016 Nov [cited 2020 Sep 28];15(1):566. Available from: https://doi.org/10.1186/s12936-016-1602-1 [ Links ]
25. Tohidinik HR, Mohebali M, Mansournia MA, Kalhori SRN, Akbarpour MA, Yazdani K. Forecasting zoonotic cutaneous leishmaniasis using meteorological factors in eastern fars province, Iran: a sarima analysis. Trop Med Int Health [Internet]. 2018 Aug [cited 2020 Sep 28];23(8):860-9. Available from: https://doi.org/10.1111/tmi.13079 [ Links ]
26. Padilha MAO, Melo JDO, Romano G, Lima MVM, Alonso WJ, Sallum MAM, et al. Comparison of malaria incidence rates and socioeconomic environmental factors between the states of Acre and Rondônia: a spatio temporal modelling study. Malar J [Internet]. 2019 Sep [cited 2020 Sep 28];18(306). Available from: https://doi.org/10.1186/s12936-019-2938-0 [ Links ]
*Study financed with resources from the ‘Acre Project – Health in the Western Amazon’, undertaken in partnership between the Acre State Health Department and Centro Universitário Saúde ABC (Agreement No. 007/2015). Gabriel Zorello Laporta received a Research Productivity Fellowship from the National Council for Scientific and Technological Development (CNPq), Ministry of Science, Technology, Innovation and Communication (MCTIC): Grant No. 307432/2019-0.
Received: April 09, 2020; Accepted: September 02, 2020
 This is an Open Access article distributed under the terms of the Creative Commons Attribution Non-Commercial License, which permits unrestricted non-commercial use, distribution, and reproduction in any medium, provided the original work is properly cited.
