


Serviços Personalizados
Journal

Artigo
 texto em
  Inglês (pdf)
 Artigo em XML
 Referências do artigo
 Enviar este artigo por email
Indicadores
-
 Citado por SciELO
Links relacionados
-
 Similares em
SciELO
Similares em
SciELO
Compartilhar

 Permalink
Epidemiologia e Serviços de Saúde
versão impressa ISSN 1679-4974versão On-line ISSN 2237-9622
Epidemiol. Serv. Saúde vol.30 no.1 Brasília 2021 Epub 31-Mar-2021
http://dx.doi.org/10.1590/s1679-4974202100020
Tools for health surveillance management
Rtabnetsp: an R package for retrieving São Paulo State health status indicators, Brazil *
1Fundação Oswaldo Cruz, Escola Nacional de Saúde Pública Sergio Arouca, Rio de Janeiro, RJ, Brazil
2Universidade Federal de São Paulo, Departamento de Medicina Preventiva, São Paulo, SP, Brazil
3Universidade Federal de São Paulo, Instituto de Ciência e Tecnologia, São José dos Campos, SP, Brazil
4Secretaria de Estado da Saúde, Coordenadoria de Regiões de Saúde, São Paulo, SP, Brazil
Health status indicators are an important tool for monitoring the performance of public health actions, identifying trends and priority regions for resource allocation. An R package was developed in order to increase the feasibility of handling and analyzing health status indicator data. The rtabnetsp package requests data from TabNet servers on the São Paulo State Department of Health website, retrieving and preprocessing the data for user manipulation. This article presents the rtabnetsp package and its functions, installation and use; as well as providing examples of its functionalities, which involve listing and searching among available indicators, selecting desired content and obtaining data aggregated according to regionalization level held on the data matrix, enabling greater agility in tasks regarding public health management in the state of São Paulo.
Keywords: Software; Electronic Data Processing; Health Status Indicators; Health Information Systems; Health Management
Introduction
Ever since the Brazilian National Health System (SUS) was implanted, systematic analysis of health data and information has been considered fundamental for evaluating its performance. This process assists System-related decision making and actions to be carried out, as well as service programming and planning, resource allocation and distribution, in addition to evaluation of the impact of interventions undertaken.1,2
Given the importance of the theme, expanding access to data and structured information has been a worldwide priority when planning health information systems3 and, consequently, one of the main work areas of the SUS Information Technology Department (Datasus). Datasus currently makes available data obtained from Ministry of Health information systems by means of interfaces, such as TabDOS (DOS version), TabWin (Windows version), TabNet (internet version) and TabSQL (Oracle database version).4 These tools enable users to manipulate DBF type database files, this being the default file extension of tabulatable database files on which case notification records are held on the different information systems, thus enabling interested parties to tabulate and calculate health status indicators, at different levels of aggregation, such as the municipal, state or federal levels.
On the other hand, the types of software mentioned above have inherent limitations, such as operating system restrictions and manipulation difficulties, data visualization and analysis via the platform. The open source R statistical software is a tool that is able to extend these functionalities and is appropriate for diverse analysis needs.
Some of the tools developed using R language are able to retrieve data from SUS information systems in the form of microdata, such as microdatasus.5 However, in the case of aggregated data, such as health status indicators, no specific tool exists other than TabNet manual retrieval or calculations using microdata.
Within this context, the decision was taken to develop an R package called rtabnetsp, capable of accessing health status indicators available via the TabNet platform on the webpage of the São Paulo State Health Department (SES/SP) and downloading pre-calculated indicator data for the desired period, region and level of aggregation.
The objective of this article was to present the rtabnetsp package and its functions, installation procedures and use; in addition to examples of its functionalities, which enable visualization, searches and selection of contents of interest from a list of indicators, in order to obtain the results desired and thus enabling greater agility in tasks regarding public health management in the state of São Paulo.
Methods
The rtabnetsp package was developed using R language for versions later than version 3.4.4. R is a statistical programming language of excellence, developed as an open source software,6 for manipulation, analysis and graphic visualization of data, as well as being expandable through use of ‘packages’, i.e. libraries to organize and standardize extra R functions, each of which is developed for a specific purpose. Moreover, use of R packages as tools to acquire or handle public health-related data is becoming frequent.5,7,8
Table 1 List of indicators available from the rtabnetsp package default address (http://portal.saude.sp.gov.br/links/matriz)
| Identifier number (ID) in the package | Indicator name | Number of subindicators | Period available |
|---|---|---|---|
| 1 | 1b - Population according to the São Paulo State Data Analysis System Foundation (SEADE) | 1 | 2000-2020 |
| 2 | 2 - Demographic density according to the Brazilian Institute of Geography and Statistics (IBGE) Demographic Census | 3 | 2000-2010 |
| 3 | 3 - Degree of urbanization according to the Brazilian Institute of Geography and Statistics (IBGE) Demographic Census | 3 | 2000-2010 |
| 4 | 4 - Population growth rate (2000-2010) according to the Brazilian Institute of Geography and Statistics (IBGE) Demographic Census | 3 | 2010-2010 |
| 5 | 5 - Proportion of elderly people | 3 | 2000-2018 |
| 6 | 6 - Gross birth rate | 3 | 2000-2018 |
| 7 | 7 and 8 - Percentage of municipalities with fewer than 10,000 inhabitants and with more than 10,000 inhabitants | 2 | 2010-2018 |
| 8 | Proportion (%) of municipalities in groups 4 and 5, by São Paulo State Health Region, Regional Health Department and Regional Health Care Networks - 2008 a 2014 - version 2016 | 1 | 2008-2014 |
| 9 | 10 - Current gross domestic product (GDP) per capita in BRL (R$) | 3 | 2000-2017 |
| 10 | 11-13 - Infant mortality rate and components | 11 | 2000-2019 |
| 11 | 14 - Maternal mortality ratio | 3 | 2000-2018 |
| 12 | 15-17 - Neoplasm mortality rate | 47 | 2000-2019 |
| 13 | 18 - Circulatory system disease mortality rate | 6 | 2000-2019 |
| 14 | 19 - External causes mortality rate | 17 | 2000-2019 |
| 15 | 20-23 - Percentage of deaths from defined causes | 18 | 2000-2019 |
| 16 | 24 and 25 - Percentage of live births with low birth weight | 5 | 2000-2019 |
| 17 | 26 - Percentage of childbirths among mothers under 20 years old | 3 | 2000-2018 |
| 18 | 27a - Case fatality rate for severe forms of dengue (FHD + SCD + DCC) | 3 | 2000-2011 |
| 19 | 27b - Dengue case fatality rate | 3 | 2012-2018 |
| 20 | 28 - AIDS incidence rate | 3 | 2000-2018 |
| 21 | 29 - Congenital syphilis incidence rate | 3 | 2007-2018 |
| 22 | 30 - Prevalence of dialysis patients | 3 | 2000-2017 |
| 23 | 31a - SUS Beds per 1,000 inhabitants | 3 | 2005-2019 |
| 24 | 31b - SES Beds per 1,000 inhabitant in the SUS-dependent population | 3 | 2005-2017 |
| 25 | 32 - Percentage of SUS Beds in intensive care units (ICU) | 3 | 2014-2019 |
| 26 | 33 - Primary Health Care coverage | 3 | 2006-2018 |
| 27 | 34 - Community Health Agent coverage | 3 | 2000-2017 |
| 28 | 35 - Proportion of live births to mothers who had 7 or more prenatal checkups | 3 | 2000-2019 |
| 29 | 36a - Percentage SUS hospitalization among total resident population | 3 | 2000-2018 |
| 30 | 36b - Percentage SUS hospitalization among total resident population for SUS-dependent population | 3 | 2000-2018 |
| 31 | 37a - Ratio of cytopathology tests for cervical cancer among women aged 25-64 | 4 | 2008-2019 |
| 32 | 37b - Ratio of cytopathology tests for cervical cancer among women aged 25-64 in the SUS dependent population | 4 | 2008-2019 |
| 33 | 38 - Quadrivalent vaccine coverage (up to 2012) and pentavalent vaccine coverage (with effect from 2013) in children under 1 year old | 3 | 2000-2018 |
| 34 | 39 - Average medical consultations per inhabitant in primary care specialties | 3 | 2000-2017 |
| 35 | 40 - Proportion of urgent consultations per primary care consultations | 3 | 2000-2017 |
| 36 | 41 - Coverage of 1st programmatic dental consultation | 3 | 2000-2016 |
| 37 | 42 - Percentage of hospitalization for Primary ambulatory care sensitive conditions | 3 | 2000-2018 |
| 38 | 43 - Stroke hospitalization rate in people aged over 40 | 3 | 2000-2019 |
| 39 | 44 - Femur fracture hospitalization rate in people aged over 60 | 3 | 2000-2018 |
| 40 | 45a - Percentage of cesarean sections - Total (Live Birth Information System [Sinasc]) | 3 | 2000-2018 |
| 41 | 45b - Percentage of cesarean sections on the SUS (Hospital Information System [SIH/SUS]) | 4 | 2000-2018 |
| 42 | 46 - Psychosocial Care Center coverage | 9 | 2012-2018 |
| 43 | 47a - Supplementary Health coverage | 3 | 2000-2019 |
| 44 | 47b - Estimated SUS-dependent population (based on Supplementary Health) | 4 | 2000-2019 |
| 45 | 48 - Proportion of cured new cases of bacilliferous pulmonary tuberculosis | 3 | 2000-2018 |
| 46 | 49 - Proportion of cured new diagnosed leprosy cases | 3 | 2001-2017 |
| 47 | 50-52 - Water treatment quality index, according to bacteriological, chlorine and fluoride parameters | 9 | 2008-2016 |
| 48 | 53 - Health expenditure per capita | 3 | 2000-2017 |
| 49 | 54a - Ratio of breast screening among women aged 50-69 | 4 | 2010-2018 |
For this presentation, we considered the indicator matrix of the Health Systems Performance Evaluation Project (Projeto de Avaliação de Desempenho de Sistemas de Saúde - PROADESS),9 given that health status indicators are fundamental for socio-spatial analyses of the health situation in Brazil.10 The list of indicators available on TabNet on the SES/SP webpage is shown in Table 1. The indicators are calculated following the methodology adopted by the Interagency Health Information Network (RIPSA) (http://tabnet.datasus.gov.br/tabdata/livroidb/2ed/indicadores.pdf).11
Rtabnetsp has brought together practical functions for visualizing, exploring and obtaining SES/SP TabNet health status indicator data. The package is available on the GitHub platform (https://github.com/), by accessing this link: https://github.com/joaohmorais/rtabnetsp.
With regard to its technical aspects, rtabnetsp uses other package dependencies as listed in Figure 1.
Figure 1 Dependence on other R packages used in rtabnetsp
| Pacote | Hiperlink | Função |
|---|---|---|
| httr | Makes HTTP requests to the TabNet server | |
| xml2 | Page scraping | |
| rvest | ||
| stringi | Text manipulation and coding treatment for Windows-1252 standard (https://encoding.spec.whatwg.org/#windows-1252) | |
| purrr | Treatment of HTTP request exceptions | |
| tidyr | Data manipulation and treatment | |
| dplyr | ||
| ggplot2 | Building choropleth graphs from the data obtained | |
| sf | Cartographic representation | |
| RColorBrewer | Color palette, for cartographic representation |
Installing R
Access the R webpage (https://www.r-project.org/) and install R following the installation instructions. Before moving on to the next step, the devtools package needs to be installed (https://cran.r-project.org/web/packages/devtools/devtools.pdf) on R.
Installing the rtabnetsp package on R
The rtabnetsp package has to be installed via its repository on the GitHub website (https://github.com/joaohmorais/rtabnetsp). With R open, type:
devtools::install_github(“joaohmorais/rtabnetsp”)
Loading the rtabnetsp package on R
In order to start using rtabnetsp, load the package by typing:
library(“rtabnetsp”)
This makes the rtabnetsp package available for use. This step needs to be performed each time R has been booted.
Rtabnetsp package functions
Rtabnetsp retrieves health status indicators via the SES/SP webpage. The health status indicators are calculated using RIPSA standardized formulae,7 and can be loaded per municipality (município), Regional Health Department (DRS), Health Region (RS) and Regional Health Care Networks (RRAS) in São Paulo State.
The complete list of indicators provided by rtabnetsp can be obtained by typing this command:
tabnet_index()$Nomes
indicator_list() function
indicator_list(url= “http://portal.saude.sp.gov.br/links/matriz”)
The indicator_list() function retrieves the list of indicators available on the TabNet page, along with their respective identification numbers, called IDs, which are used to choose the indicators. When this function is run, it explores a given URL - whereby the SES/SP TabNet address is defined as the default - and retrieves health status indicator names and links identified on the page.
indicator_search() function
indicator_search(keywords, url = “http://portal.saude.sp.gov.br/links/matriz”)
A page’s list of indicators can also be consulted by searching for a specific indicator. The indicator_search() function displays a list with the name and ID of each indicator, and the title corresponding to the term in the “keywords” parameter. It should be noted that this function does not distinguish between uppercase and lowercase letters, but rather differentiates between characters that do or do not have accents.
view_indicator() function
view_indicator(indicator_index, url = “http://portal.saude.sp.gov.br/links/matriz”, timeout = 1)
Once the indicator to be visualized has been defined, it is important to check its available levels of aggregation, periods and contents, before making a request for data. The view_indicator() function returns a list containing information on levels of aggregation, periods (years) and contents. It should be noted that an indicator can have different contents, differentiated by subindicators: e.g. the ‘external causes mortality rate’ indicator has subindicators, such as ‘deaths from homicide’, ‘deaths from suicide’ and other causes, which are available on TabNet. In order to use this function, the indicator’s ID number must be informed as the “indicador_index”.
The “timeout” parameter appears in several functions and represents the time, in seconds, during which the connection will remain open for retrieving information from the indicator’s page, so as to avoid insisting on connections that do not provide return. The “timeout” default is 1 second, although this time span needs to be adjusted in the event of slow connections.
indicator_df() function
indicator_df(indicator_index, region = NULL, subindicator = NULL, years = NULL, onlyMostRecent = FALSE, url = “http://portal.saude.sp.gov.br/links/matriz”, timeout = 1)
The indicator_df() function is that which does in fact make the request for data for an indicator in a given period and level of aggregation. The indicator’s ID is input to the function as the “indicator_index”. The next step is to inform the level of aggregation for the “region”, using the term ‘Município’ (Municipality), ‘Região de Saúde’ (Health Region), ‘RRAS’ (Regional Health Care Network) or ‘DRS’ (Regional Health Department). If this is not informed, the function will automatically take the first available level as the default level (i.e. ‘Município’, in the majority of cases). Similarly, the contents of the indicator (subindicador) can be specified in the “subindicator” parameter, as can the period desired, in “years”; if this content is not specified, the function will default to the indicator’s last available subindicator, for all the periods available. The function also has an “onlyMostRecent” logical parameter (i.e. “TRUE” or “FALSE”), which, if “TRUE”, will only retrieve the observations for the most recent among the years available, or among those specified by using the “years” parameter.
Once the function has been run, the user will receive a data matrix with an identification code and the name of each region, the year of observation and the value of the indicator observed.
fetch_all() function
fetch_all(region = “Município”, url = “http://portal.saude.sp.gov.br/links/matriz”, timeout = 1)
In some types of analyses the need exists to work with several or even all the indicators available. The fetch_all() function meets this need by grouping together all the indicators for the same data matrix. The desired level of regionalization can be specified again using the “region” parameter. In response, the user obtains a new data matrix with an identification number and the name of each region, the year of observation, the names of the indicator and subindicator in question, and the value observed. It is important to note that this function attends to several server requests, one for each indicator, and may take several minutes to run.
tabnet_map() function
tabnet_map(indicator_index, region = “Município”, subindicator = NULL, years = NULL, label = FALSE, nBins = NULL, palette = “Purples”, title = NULL)
Finally, a choropleth map can be obtained based on an indicator’s data, using the tabnet_map() functions, the parameters of which are similar to those of the tabnet_df() function, in which one can specify the desired indicator ID, level of aggregation, contents and period. Moreover, this function supports the following parameters: “label”, which can be true or false, indicating whether the user wants the names of the regions on the map; “nBins”, through which one can define the number of intervals (between 3 and 9) into which the indicator’s values will be defined; “palette”, which enables the map’s color palette to be personalized, in accordance with the RColorBrewer package (https://cran.r-project.org/web/packages/RColorBrewer/RColorBrewer.pdf); and “title”, for defining the title of the map.
Ethical considerations
The rtabnetsp package was developed within the scope of the project entitled ‘Development of an R/Shiny application to assist with visualizing and analyzing health status indicators in the state of São Paulo’, which was approved by the Federal University of São Paulo Research Ethics Committee: Certificate of Submission for Ethical Appraisal No. 94098718.7.0000.5505, issued on September 20th 2018.
Results
This section presents hypothetical situations common to the health service management context, providing illustrative examples of the rtabnetsp functions used in the process.
Situation 1 - Temporal visualization of the dengue case fatality rate by Regional Health Department
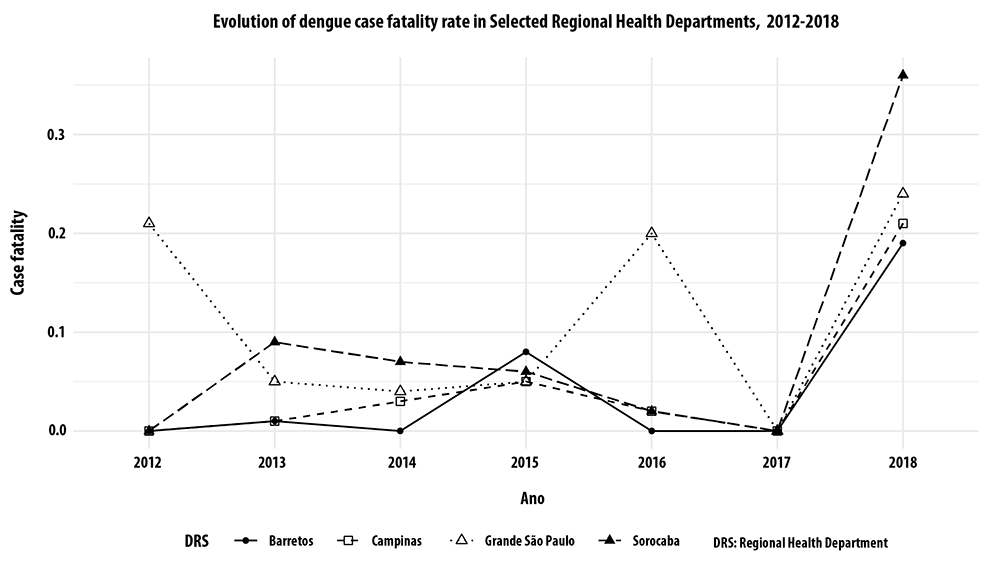
This first scenario intends to enable visualization of the dengue case fatality rate since 2012 in four specific Regional Health Departments (DRS): Grande São Paulo; Campinas; Barretos; and Sorocaba. Once rtabnetsp has been loaded in R, the first step is to find the desired indicator:
> indicator_search(“dengue”)
[1] “18 - Taxa de letalidade por formas graves de dengue até 2011 (FHD+SCD+DCC)”
[2] “19 - Taxa de letalidade de dengue (a partir de 2012)”
As we want recent data, we will opt for indicator ID 19 - Dengue case fatality rate (with effect from 2012). Following this, we will check the levels of aggregation and periods available for the indicator:
> view_indicator(19)
$Indicator.Name
[1] “19 - Taxa de letalidade de dengue “
$Indicator.URL
[1] “http://tabnet.saude.sp.gov.br/deftohtm.exe?tabnet/ind27b_matriz.def”
$Available.Regions
[1] “Município” “DRS” “DRS/Reg Saude” “DRS/Mun” “RRAS” “RRAS-Reg Saude” “RRAS-Municipio”
[8] “Região de Saúde” “Reg Saúde/Mun”
$Available.Years
[1] “2018” “2017” “2016” “2015” “2014” “2013” “2012”
$Available.Subindicators
[1] “Óbitos” “Total de Casos” “Tx Letalidade Dengue”
Based on this information, we will check for the availability of data for this indicator for all years from 2012 to 2018, as well as the desired regionalization (DRS). The desired subindicator is the last on the list: the fatality rate. We will therefore use the indicator_df() function to retrieve the data for this indicator and save them in a data matrix:
> dados <- indicator_df(19, region = “DRS”)
> head(dados)
id DRS Year Value
1 3501 Grande São Paulo 2012 0.21
2 3502 Araçatuba 2012 0.07
3 3503 Araraquara 2012 0.00
4 3504 Baixada Santista 2012 0.09
5 3505 Barretos 2012 0.00
6 3506 Bauru 2012 0.00
Thus we have a data matrix saved in the “data” element, with the identification codes and names of the DRS, year of occurrence and the value of the indicator in that year and in that DRS. A line graph can be used to visualize the trend of the indicator over the years between the desired DRS. The ggplot2 package enables the line graph to be drawn using the data matrix obtained. The result is illustrated in Figure 2: the evolution of the dengue case fatality rates can be seen in the period from 2012 to 2018, in the selected DRS: Grande São Paulo, Campinas, Barretos and Sorocaba. It can be seen, for example, that there is an increase in dengue fatality in Grande São Paulo in 2016, and in Sorocaba in 2018.
recorte.DRS <- c(“Grande São Paulo”, “Campinas”, “Barretos”, “Sorocaba”)
dados <- dados[dados$DRS %in% recorte.DRS,]
ggplot(data=dados, aes(x=Ano, y=Valor, group=DRS)) +
geom_line(aes(linetype = DRS)) +
geom_point(aes(shape = DRS)) +
theme_minimal() +
theme(legend.position = “bottom”, plot.title = element_text(hjust = 0.5)) +
labs(x = “Ano”, y = “Letalidade”) +
ggtitle(“Evolução da taxa de letalidade de dengue nos DRS selecionados, \nde 2012 a 2018”)
Situation 2 - Spatial visualization of the SUS-dependent population
In another scenario, we want to visualize the spatial distribution of SUS-dependent population coverage among the municipalities of the state of São Paulo. Similarly to the previous hypothetical situation, we have to locate the identification number of the indicator we want:
> indicator_search(“dependente”)
[1] “24 - Leitos SUS por 1.000 habitantes para a população SUS-dependente”
[2] “30 - Percentual de internação da população residente para a população SUS-dependente”
[3] “32 - Razão de exames citopatológicos cérvico-vaginais para a população SUS-dependente”
[4] “44 - Estimativa da população SUS-dependente (com Base na Saúde Suplementar)”
The tabnet_map() function can be used to draw a choropleth map of the indicator. By default, the function will retrieve data from the municipal level and for the most recent available year. There is therefore no need to specify, via the function’s parameters, either the level of aggregation or the period desired. We reiterate that dependence on the sf package is needed for this function. Figure 3 shows the map generated by this function, showing the spatial distribution of SUS-dependent population coverage.
> tabnet_map(44, nBins = 5, palette = “Greys”, title = “Estimativa da população SUS dependente por município. Estado de São Paulo, 2019.”)

Discussion
The rtabnetsp package enables practical retrieval of health status indicator data available on the São Paulo State Health Department webpage, directly to R, where they can be manipulated. In both the situations presented as examples, it was possible to accompany use of descriptive analysis resources involving only a few commands within the program. The development of the rtabnetsp package meets the intention of health surveillance to increase information accessibility, enabling systematic analyses in the area of health service management.
Rtabnetsp differs from other packages already covered by the literature, in terms of retrieving information from Ministry of Health information systems. The microdatasus package,5 for example, obtains data on occurrence from the DBF files available on each database made available by Datasus.
The package presented in this study develops a web scraping operation in order to retrieve data already tabulated by the existing TabNet tool. This method is more advantageous for analyzing aggregated data, providing the process with greater agility and reliability, given that the data have already been tabulated by the TabNet system.
We believe that the development of rtabnetsp has met its main objective: to facilitate access to and analysis of indicators and to assist health service decision making in the state of São Paulo. The package also has the potential to contribute to the development of other software, designed for working with health data as well as the possibility of its being used as a mediator for applications that need such data and which seek to monitor indicators.
REFERENCES
1. Hartz ZMA, Silva LMV. Avaliação em saúde: dos modelos teóricos à prática na avaliação de programas e sistemas de saúde [Internet]. Salvador: EDUFBA; Rio de Janeiro: Editora FIOCRUZ; 2005 [citado 2020 jun 19]. Disponível em: http://books.scielo.org/id/xzdnf [ Links ]
2. van Panhuis WG, Paul P, Emerson C, Grefenstette J, Wilder R, Herbst AJ, et al. A systematic review of barriers to data sharing in public health. BMC Public Health [Internet]. 2014 Dec [cited 2020 Aug 22];14(1). Available from: https://doi.org/10.1186/1471-2458-14-1144 [ Links ]
3. Health Metrics Organization. World Health Organization - WHO. Framework and standards for country health information systems [Internet]. 2nd ed. Geneva: World Health Organization; 2008 [cited 2020 Aug 23]. Available from: https://apps.who.int/iris/handle/10665/43872 [ Links ]
4. Ministério da Saúde (BR). Datasus: trajetória 1991 - 2002 [Internet]. Brasília: Ministério da Saúde; 2002 [citado 2020 jun 17]. Disponível em: http://www.saude.gov.br/bvs/publicacoes/trajetoria_datasus.pdf [ Links ]
5. Saldanha RF, Bastos RR, Barcellos C. Microdatasus: pacote para download e pré-processamento de microdados do Departamento de Informática do SUS (DATASUS). Cad Saúde Pública [Internet]. 2019 set [citado 2020 jun 17];35(9). Disponível em: https://doi.org/10.1590/0102-311x00032419 [ Links ]
6. R Development Core Team. A language and environment for statistical computing: reference index [Internet]. Vienna: R Foundation for Statistical Computing; 2010 [cited 2020 Jun 17]. Available from: http://www.polsci.wvu.edu/duval/PS603/Notes/R/fullrefman.pdf [ Links ]
7. Nedel FB. Pacote csapAIH: a lista brasileira de internações por condições sensíveis à atenção primária no programa R. Epidemiol Serv Saúde [Internet]. 2019 [citado 2020 ago 24];28(2):e2019084. Disponível em: https://doi.org/10.5123/s1679-49742019000200021 [ Links ]
8. Rocha TAH, Silva NC, Amaral PVM, Barbosa ACQ, Vissoci JRN, Thomaz EBAF, et al. Geolocalização de internações cadastradas no Sistema de Informações Hospitalares do Sistema Único de Saúde: uma solução baseada no programa estatístico R. Epidemiol Serv Saúde [Internet]. 2018 [citado 2020 ago 24];27(4):e2017444. Disponível em: https://doi.org/10.5123/s1679-49742018000400016 [ Links ]
9. Viacava F, Ugá MAD, Porto S, Laguardia J, Moreira RS. Avaliação de desempenho de sistemas de saúde: um modelo de análise. Ciênc Saúde Coletiva [Internet]. 2012 abr [citado 2020 nov 26];17(4):921-34. Disponível em: https://doi.org/10.1590/S1413-81232012000400014 [ Links ]
10. Barcellos CC, Sabroza PC, Peiter P, Iñiguez Rojas L. Organização espacial, saúde e qualidade de vida: análise espacial e uso de indicadores na avaliação de situações de saúde. Inf Epidemiol SUS [Internet]. 2002 set [citado 2020 jun 17];11(3):129-38. Disponível em: https://www.arca.fiocruz.br/handle/icict/713 [ Links ]
11. Rede Interagencial de Informações para a Saúde, organizador. Indicadores básicos para a saúde no Brasil: conceitos e aplicações [Internet]. 2. ed. Brasília: Organização Pan-Americana da Saúde; 2008 [citado 2020 nov 26]. 349 p. Disponível em: http://tabnet.datasus.gov.br/tabdata/livroidb/2ed/indicadores.pdf [ Links ]
*Article derived from the final course assignment entitled ‘Development of an R/Shiny application to assist with visualizing and analyzing health status indicators in the state of São Paulo’, submitted by João Henrique de Araujo Morais to the Federal University of São Paulo Computer Science Course in 2019.
Received: August 24, 2020; Accepted: October 20, 2020
 Este é um artigo publicado em acesso aberto sob uma licença Creative Commons
