


Servicios Personalizados
Revista

Articulo
 texto en
  Inglés (pdf)
 Articulo en XML
 Referencias del artículo
 Curriculum ScienTI
 Enviar articulo por email
Indicadores
-
 Citado por SciELO
Links relacionados
-
 Similares en
SciELO
Similares en
SciELO
Compartir

 Permalink
Epidemiologia e Serviços de Saúde
versión impresa ISSN 1679-4974versión On-line ISSN 2237-9622
Epidemiol. Serv. Saúde vol.30 no.2 Brasília 2021 Epub 16-Abr-2021
http://dx.doi.org/10.1590/s1679-49742021000200006
Original Article
Dynamic mapping of the probability of infestation by urban arbovirus vectors in the municipalities of Rio Grande do Sul state, Brazil, 2016-2017
1Universidade Federal do Rio Grande do Sul, Departamento de Ecologia, Porto Alegre, RS, Brazil
2Governo do Estado do Rio Grande do Sul, Secretaria de Estado de Saúde, Porto Alegre, RS, Brazil
3Universidade Federal do Rio Grande do Sul, Departamento de Genética, Porto Alegre, RS, Brazil
Objective
To compare official mapping with probabilistic mapping of infestation by Aedes spp. in the municipalities of Rio Grande do Sul state, Brazil.
Methods
This was an ecological study using data from samples of mosquito breeding sites collected in 2016-2017; official classification was obtained from epidemiological reports, and infestation per municipality and week was estimated by fitting a dynamic site-occupancy model to data from municipal epidemiological surveillance.
Results
187,245 samples collected in 473 municipalities returned 10,648 detections of Aedes aegypti, and 8,414 detections of Aedes albopictus; official mapping agrees with probabilistic mapping in municipalities in the northwestern and western regions of the state. The mappings are not in agreement in the eastern, central, northeastern and southern regions, revealing municipalities officially not infested but with high probability of infestation and notification of arbovirus infection.
Conclusion
While official classification identified critically infested municipalities in the state’s northwestern and western regions, it did not identify infestation in municipalities with possible false zero errors and where infestation varies over time.
Key words: Aedes; Ecological Studies; Models, Theoretical; Disease Vectors; Epidemiological Monitoring
Introduction
Entomological monitoring data are useful for mapping disease vector distribution, however they tend to show sampling effort variation between monitored locations.1Hierarchical site-occupancy models enable mapping and prediction of the probability of occurrence of species based on the environment and imperfections in the sampling process.4 Their application to monitoring data has resulted in advancement of ecological,5 economic3 and epidemiological knowledge.1 Of special interest is the mapping of the distribution of Aedes (Stegomyia) aegypti and Aedes (Stegomyia) albopictus mosquitoes, the main urban vectors of dengue, Zika and chikungunya arbovirus infections.2 The distribution of these species is still uncertain, principally in recently infested regions.9 Their presence is of concern to Public Health workers,11 for whom surveillance and control are the most important tools for preventing these infections.1
Brazil eliminated Ae. aegypti in the 1950s.10 However, persistent infestation in neighboring countries and slackening of surveillance in Brazil resulted in recolonization by this vector10 as well as colonization by Ae. albopictus in the decades that followed.15The success of the National Dengue Control Program has been limited,17 not just because of the budget restrictions applied to Public Health but also due to the climate crisis,18 urbanization and intensification of international transport which favor the geographic spread of the Aedes species.9
The infestation classification system, defined by the National Dengue Control Program and adopted by the Brazilian municipalities, considers each municipality to be either ‘infested’ (building infestation index >0%) or ‘not infested’.16 By adopting this system, the epidemiological surveillance service in the state of Rio Grande do Sul has recorded an increase in the number of municipalities officially infested by Ae. aegypti, from 58 in 2008 to 391 in 2020,20 associated with the identification of autochthonous arbovirus infection transmission.20 Using this classification system there is a chance of health service managers underestimating the number of infested municipalities due to to the imperfect detection of infestations,1 as well as reducing surveillance efforts during the winter, which is increasingly milder and incapable of eliminating Aedes populations.6
Instead of proposing further adjustments to the binary classification, a probabilistic classification is proposed, based on estimated probability of infestation. This estimate is made using a statistical model of field observations, which incorporates diverse sources of infestation variation, such as detection errors, the effect of the local environment, and the spatial diffusion of infestation.
The objective of this study was to compare the official mapping with the probabilistic mapping of Aedes spp. infestation in the municipalities of Rio Grande do Sul state, Brazil.
Methods
This ecological study analyzed data from 473 municipalities of the state of Rio Grande do Sul, collected between 2016 and 2017. Rio Grande do Sul is Brazil’s southernmost and fifth most populous state, with approximately 11 million inhabitants in 2014.22 Its highest population density is found in the Porto Alegre metropolitan region, >430 inhab. per km2 in 2013.23 Also in 2013, the state’s most socioeconomically developed region was the northeast, while the least developed was the central/southern region.23 The climate in Rio Grande do Sul is temperate, without a characteristic dry period, with an average annual temperature of between 10 and 15ºC, with minimum temperatures close to 0ºC in the winter and maximum temperatures close to 40ºC in the summer.24
The following municipal scale variables were analyzed:
Field observations (detection; non detection) of Ae. aegypti and Ae. albopictus.
Official binary classification of infestation.
Environmental, spatial and epidemiological variables.
Temperature;25
Precipitation;25
Forest coverage;26
Human density population;22
Spatial vicinity, based on the digital map of Rio Grande do Sul, produced by the Henrique Luiz Roessler State Environmental Protection Foundation;
Notifications of autochthonous dengue, Zika and chikungunya cases from the the Notifiable Health Conditions Information System (Sinan), in relation to the study period.
We analyzed field observation data generated by the by the methods of entomological surveillance house-to-house larval survey (levantamento de índices amostrais - LIA) and Rapid Ae. aegypti Index Survey (levantamento de índice rápido para Ae. aegypti - LIRAa) implemented in the municipalities of Rio Grande do Sul between January 2016 and December 2017. In the LIA and LIRAa surveys, whenever endemic health workers find a mosquito breeding site, they collect the larvae and deposit up to 10 of them into a collection recipient (tube).16 The tubes are sent to public health network laboratories for taxonomic, the results of which are compiled into epidemiological bulletins and published by the State Health Surveillance Center.21
Official binary classification of Ae. aegypti infestation in the municipalities of Rio Grande do Sul was retrieved from the weekly epidemiological bulletins produced by the State Health Surveillance Center, corresponding to the period selected for the study.21 This classification does not exist for Ae. albopictus. The binary classification norms are based on ‘hotspot delimitation’, which is a search for breeding sites in a 300 meter circle around an initial Ae. aegypti detection site. Technical Note 01/2012 was in force in Rio Grande do Sul up until the end of 2017,27 and established that a municipality is ‘infested’ when a hotspot delimitation resulted in at least two new Ae. aegypti detections. In January 2018, Technical Note 01/2018 modified this criterion to just one new detection.28 It also provided that municipalities with notifications of autochthonous arbovirus infections are to be classified as ‘infested’.
The statistical model of probability of infestation applied to the field observation data is a hierarchical dynamic site-occupancy model with spatial diffusion.4As these models separate the analysis into two hierarchical levels – (i) the sampling process, which influences species detection; and (ii) the biological process, which influences species spatiotemporal distribution –, they quantify uncertainty about infestation due to observation flaws, possibly frequent, given the variation in sampling effort between sites (municipalities). The model was applied to the data of Ae. aegypti and Ae. albopictus to estimate the probability of infestation in the state’s 496 municipalities, over the 104 weeks included in the study period, considering each municipality to be a spatial unit, and the epidemiological week (or ‘week’) to be a time unit. Each week can have up to seven sampling days. Each day contains a number of collection tubes to serve as a measurement of sampling effort, due to data on the number of buildings inspected not being available.
In the model specified, when an endemic health worker collects nijt tubes in a municipality i, on day j of week t, the probability of finding one of the Aedes species in the collected tubes is calculated according to the following formula,
where p is the probability of detecting Aedes spp. in an effort unit, measured on the scale of
In addition to taking imperfect detection into consideration, the model relates the dynamics of site occupancy with the environmental conditions of each municipality.4 The probability of Aedes spp. infestation
For this study, the model was specified in Bayesian Inference Using Gibbs Sampling (BUGS) language and fitted to the data in a Bayesian context by a Markov Chain Monte-Carlo (MCMC) algorithm, which enables inference on the statistical distribution of the estimated parameters. The MCMC was run with two chains of 50,000 iterations, an adaptive phase of 20,000 iterations, a burn-in phase of 40,000 iterations, and at every 20 iterations. These specifications provided 1,000 samples of the posterior probability distribution of the model parameters, thus enabling an infestation matrix to be built per municipality and week
Comparison between official and probabilistic infestation
In order to classify a municipality as being ‘infested’, the State Health Surveillance Center uses the premise that endemic health workers detect breeding sites with mosquitoes in all truly infested municipalities (i.e., p=1). The veracity of this premise can be assessed by comparing the official classification with the probability of infestation estimated by the model.
The comparison was done from two perspectives: static and dynamic. In the static comparison, at the end of the study period, for each municipality, the maximum value of probability of infestation that a municipality reached along the study period was subtracted from the official binary classification (‘infested’=1; ‘not infested’=0). Results close to -1 highlight municipalities officially classified as ‘not infested’ and which presented high probability of estimated infestation. In the dynamic comparison, the expected number of weeks with infestation according to the model was subtracted from the number of weeks during which the municipality was officially classified as ‘infested’; the former number is obtained by adding together the values for municipality i for all the period in analysis. Results close to -104 are close to the maximum disagreement between an official classification of ‘not infested’ and a statistical forecast of a long time of infestation (the study covers 104 weeks). These analyses were performed only for Ae. aegypti, due to the lack of a binary classification for Aedes albopictus.
In order to convert a probability of infestation into a binary classification, one has to define a probability threshold above which a municipality is considered to be ‘infested’. In this context, we examined which probability threshold would be necessary to obtain a proportion of infested municipalities equal to the percentage found in the binary classification as per Technical Note. At the extremes, a threshold of 0 results in all municipalities being declared 'infested', while a threshold of 1 results in no municipalities being infested. This analysis enabled assessment of the levels required by Technical Note 01/2012 and Technical Note 01/2018 for a municipality to be considered infested. The same reasoning was applied to the subset of municipalities with notification of autochthonous arbovirus infection transmission, which should necessarily be infested and, therefore, should have lower thresholds. As in the first comparisons, the search for thresholds was only applied to the data of Aedes aegypti. All the analyses were performed in the R programming environment.29
Results
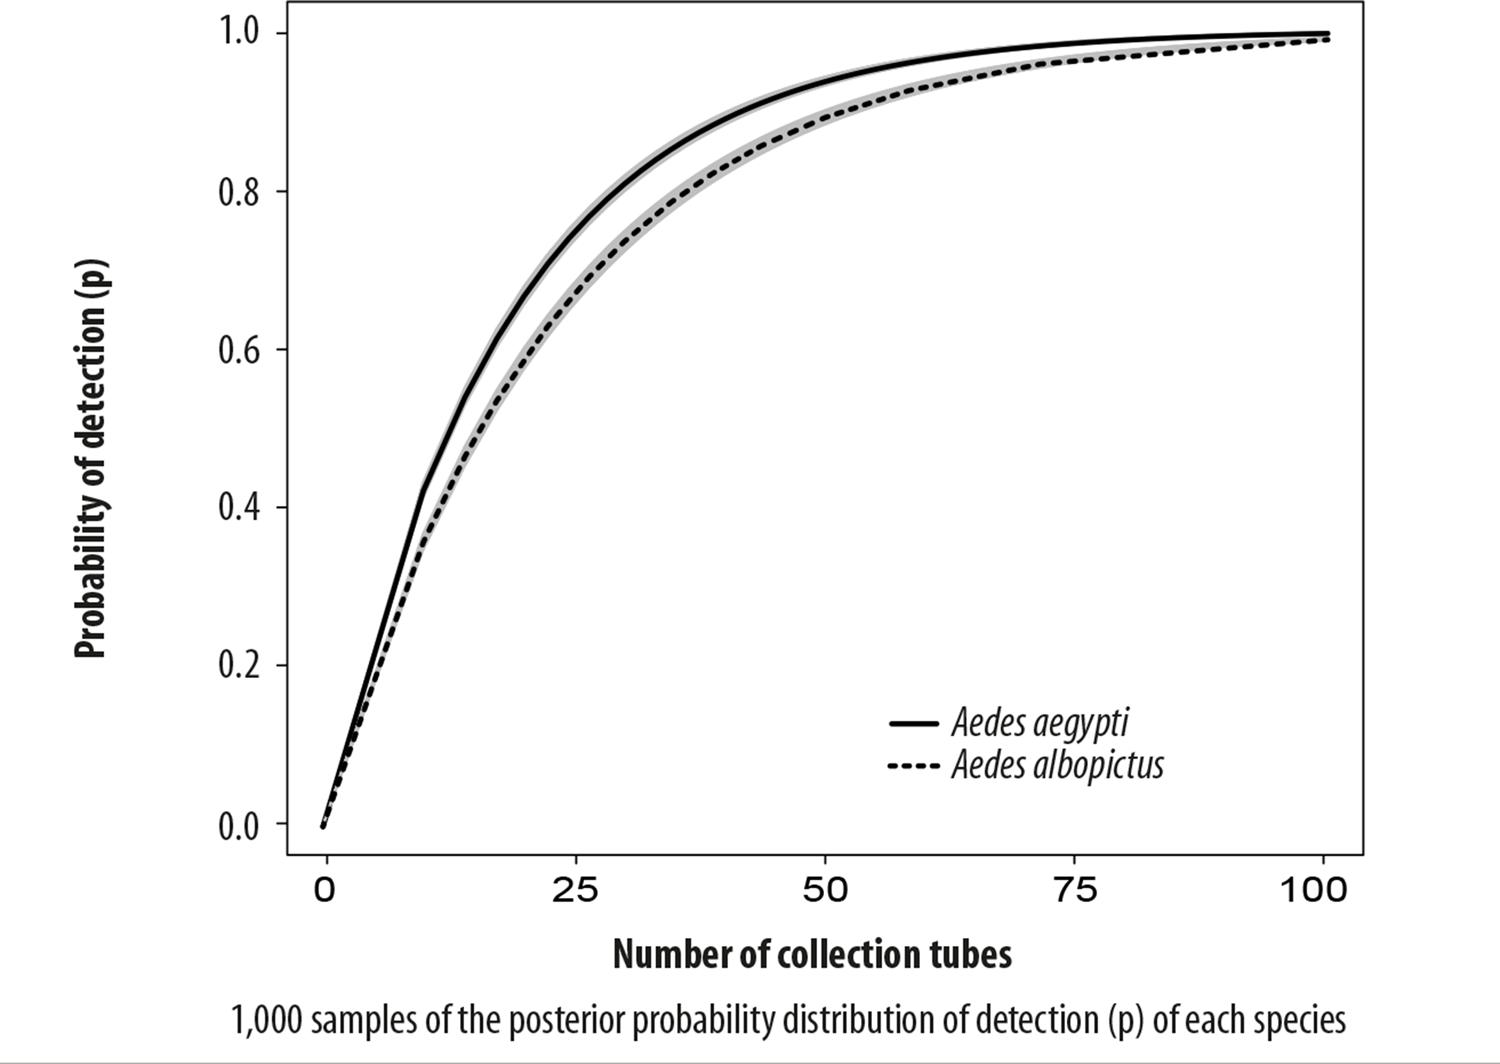
Data from 473 municipalities were analyzed in order to estimate infestation in the 496 municipalities of the state of Rio Grande do Sul, with an average (± standard deviation) of 30.30±25.44 weeks of sampling across municipalities. In all, 187,245 collection tubes were gathered over the 31,894 sampling occasions; Ae. aegypti was detected in 10,648 tubes (5.6%) and Ae. albopictus in e 8,414 tubes (4.5%). The estimated number of infested municipalities, for both Aedes species, always exceeded the number of municipalities which had detection of them (Figure 1A). This difference was greater than or equal to 100 municipalities, for all weeks, with an average difference of 145 for Ae. aegypti and 174 for Ae. albopictus. When a municipality was infested, the average probability of detection on a sampling day was greater for Ae. aegypti (0.420±0.004) than for Ae. albopictus (0.360±0.004), and reached values very close to 1 for both species, with a number of collection tubes above 75 (Supplementary Material).
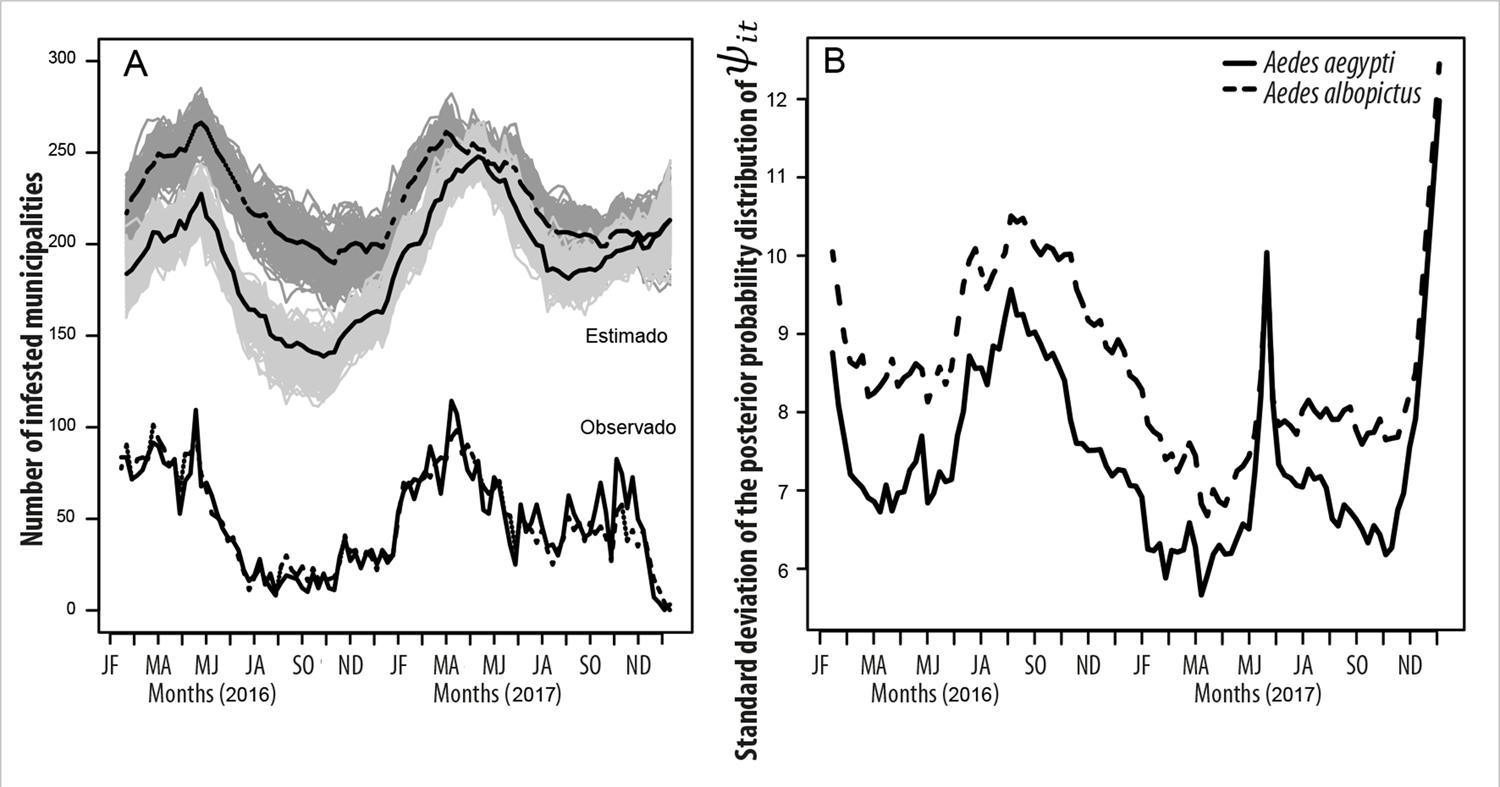
Figure 1 – Temporal variation on the number of infested municipalities (A) and on the uncertainty about infestation (B) by Aedes aegypti and Aedes albopictus, Rio Grande do Sul, 2016-2017
The number of infested municipalities varied over time, in a similar way for both species. The weeks with the highest expected number of infested municipalities were week 16 (April) 2017 for Ae. aegypti, and week 15 (April) 2016 for Ae. albopictus (Figure 1A). In contrast, the weeks with the lowest expected number of infested municipalities were week 39 (September) 2016 for Ae. aegypti, and week 41 (October) 2016 for Ae. albopictus (Figure 1A). The expected number of infested municipalities during the weeks of minimum infestation was 138 for Ae. aegypti and 189 for Ae. albopictus. The expected number of infested municipalities in the weeks of maximum infestation was always close to 50% of the municipalities, with a greater difference between species in 2016 (228 municipalities for Ae. aegypti, 267 for Ae. albopictus) than in 2017 (248 municipalities for Ae. aegypti, 262 for Ae. albopictus) (Figure 1A).
Although temporal variation of infestation was similar between species, their spatial distribution was distinct (Figure 2). The municipalities with a large expected number of weeks with Ae. aegypti infestation were not those that had a large expected number of weeks with Ae. albopictus infestation (Figure 2D). Comparison between observed data (Figures 2A and 2C) and expected data (Figures 2B and 2D) shows that the number of weeks when infestation was observed was lower than the estimated number of weeks with infestation, for both species.
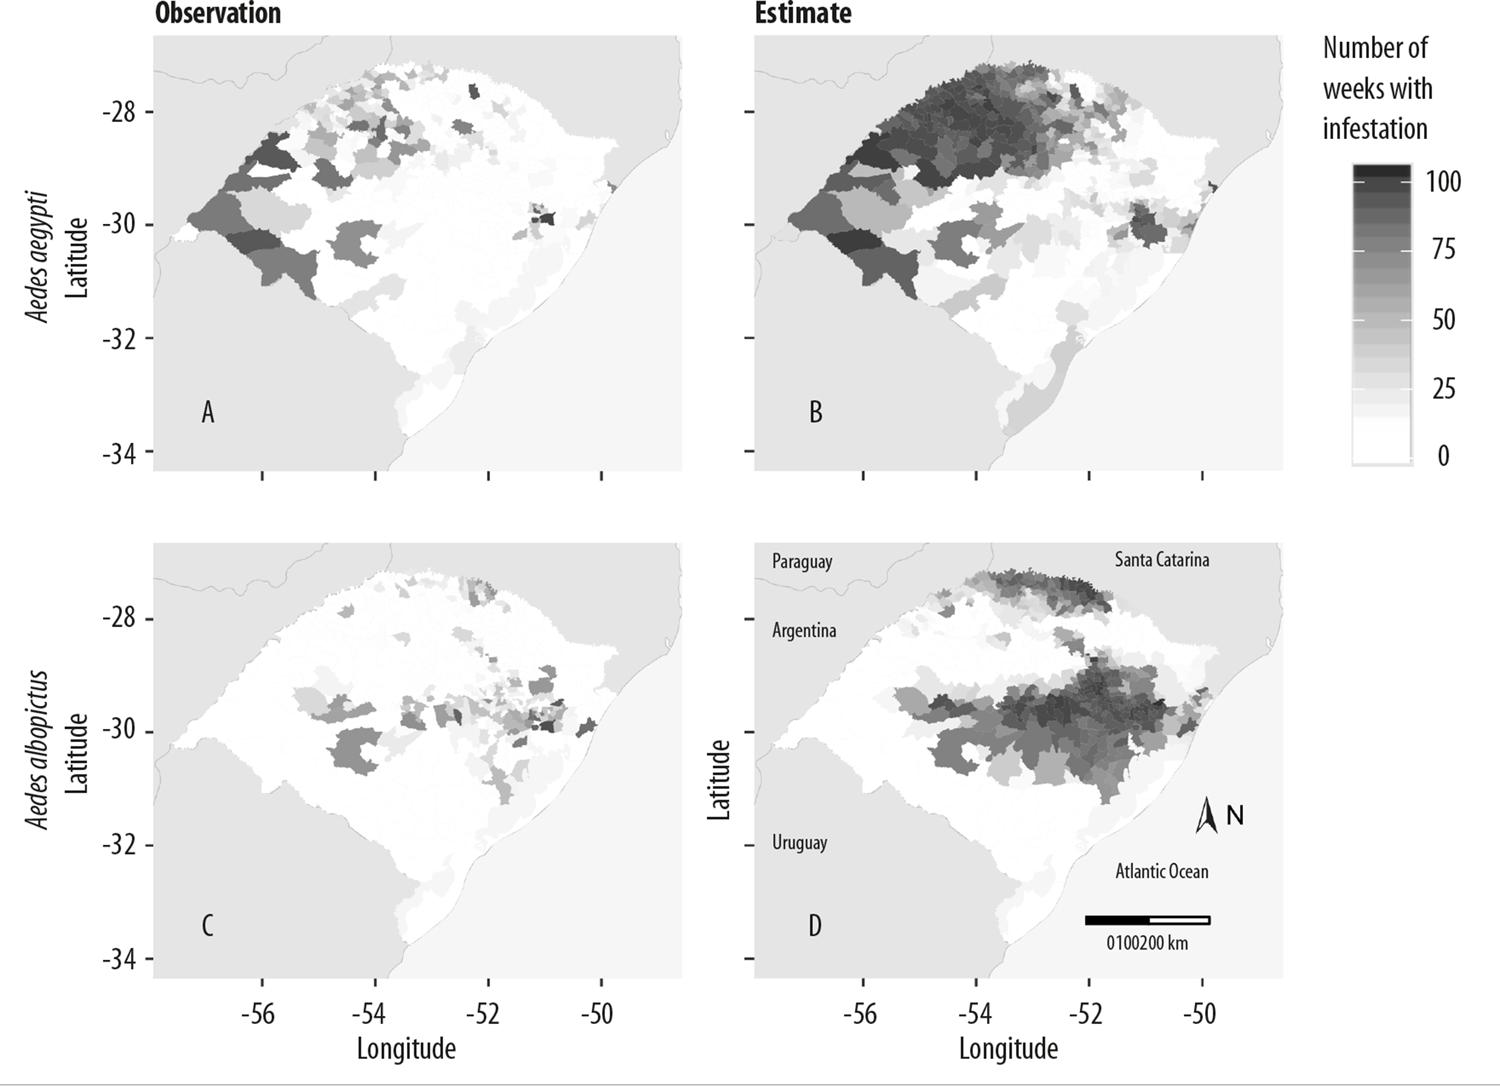
Figure 2 – Geographic distribution of Aedes aegypti (A and B) and Aedes albopictus (C and D), based on number of weeks with at least one detection of the species (A and C) and with presence of the species according to the model (B and D), Rio Grande do Sul, 2016-2017
Comparison between uncertainty associated with the number of municipalities (variation in time) (Figure 1B) and uncertainty associated with the number of weeks (variation in space between municipalities) (Figure 3) revealed that spatial uncertainty was greater than temporal uncertainty for both species. The standard deviation of the number of infested municipalities in each week varied little, over time, with between 6 and 12 municipalities, increasing during the winter and, as a consequence of the structure of the model, at the beginning and the end of the study period (Figure 1B). On the other hand, the standard deviation of the number of weeks with infestation for each municipality was higher at the edge of the infestation patches. In the case of Ae. aegypti, high values (≥15 weeks) appeared in the northern and central region of Rio Grande do Sul, on the east bank of the Lagoa dos Patos lagoon and in the far south of the state (Figure 3A). In the case of Ae. albopictus, high values appeared in the northern, northeastern, plateau and north coast regions of the state (Figure 3B).
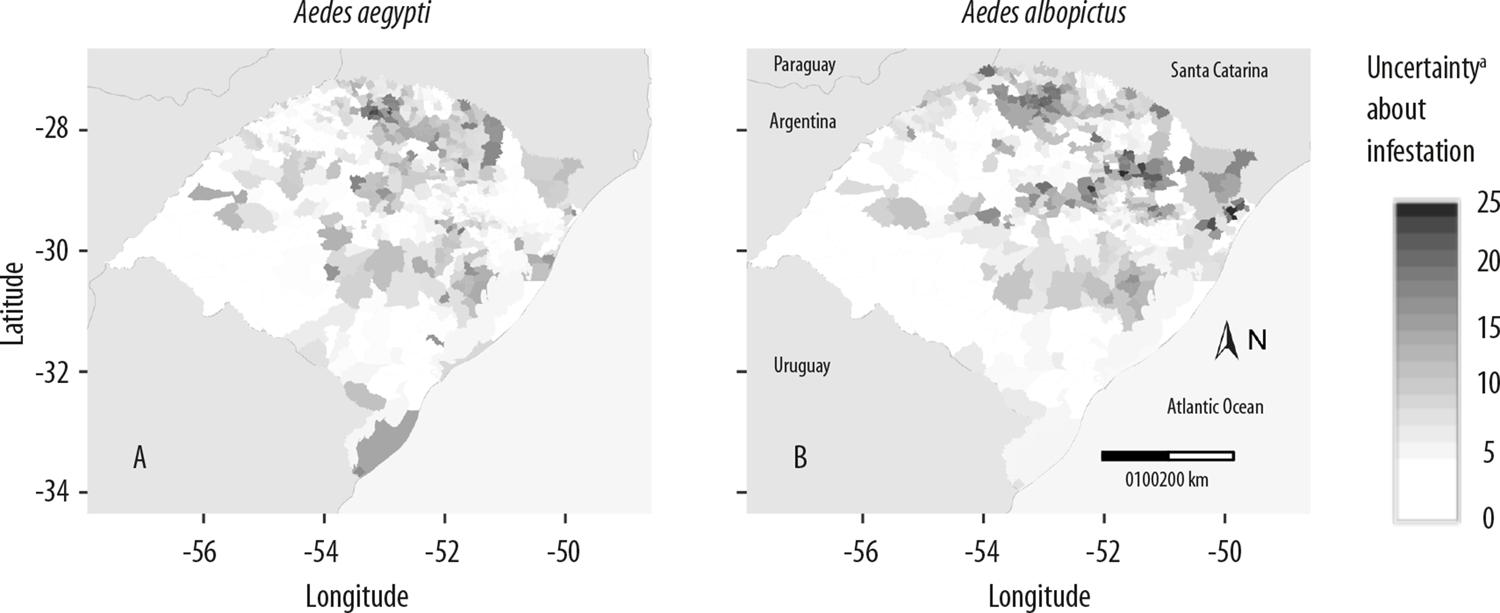
a) Uncertainty about infestation, in terms of the posterior probability distribution of the number of epidemiological weeks with expected infestation.
Figure 3 – Uncertainty about infestation by Aedes aegypti (A) and Aedes albopictus (B) in Rio Grande do Sul, 2016-2017
The statistical comparison between official and probabilistic infestation values revealed disagreement, which was particularly high in municipalities of the eastern, northeastern, central and southern regions of the state (Figure 4A). A different pattern emerged in the dynamic comparison of infestation: the municipalities of the northwestern and western regions appeared as being officially infested for more weeks than was expected according to the infestation estimates (Figure 4B). In the southeastern half of the state, a large part of the municipalities showed disagreement of -20 in the dynamic comparison, indicating that the estimated number exceeded the official number of weeks with infestation by 20. On the other hand, some officially infested municipalities had a very low number of expected weeks of infestation (Figure 4B).
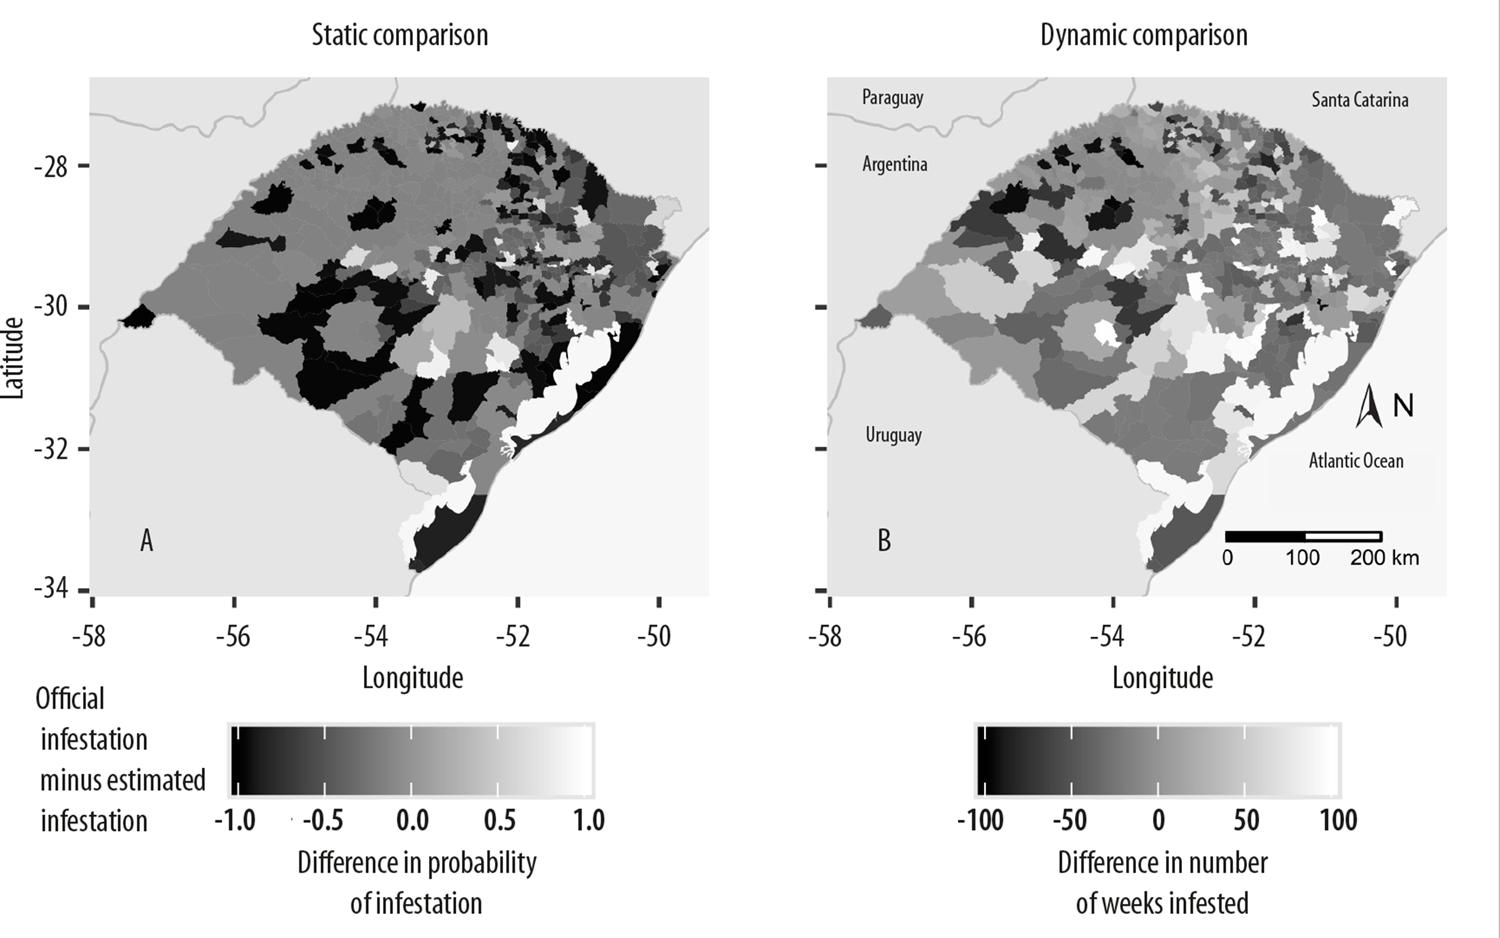
Note: Values close to zero indicate agreement between binary classification and probabilistic classification.
Figure 4 – Comparison between binary classification and probabilistic classification of infestation by Aedes aegypti for each municipality of Rio Grande do Sul state, 2016-2017
The search for probability thresholds revealed that the threshold corresponding to the percentage of infested municipalities, according to the official Technical Note 01/2012 classification, was approximately 0.919, whereas it was 0.741 using Technical Note 01/2018 (Figure 5A). Taking only the 49 municipalities with notified autochthonous arbovirus infection cases in 2016 (Figure 5B), the threshold corresponding to Technical Note 01/2012 was 0.620, which excluded municipalities that presented arbovirus infection, official classification as ‘not infested’ and maximum probability of infestation below 0.620. Within the set of municipalities with notification of disease, the threshold corresponding to Technical Note 01/2018 was 0.241 (Figure 5B), with 100% of the municipalities with autochthonous arbovirus infection cases being officially classified as ‘infested’.
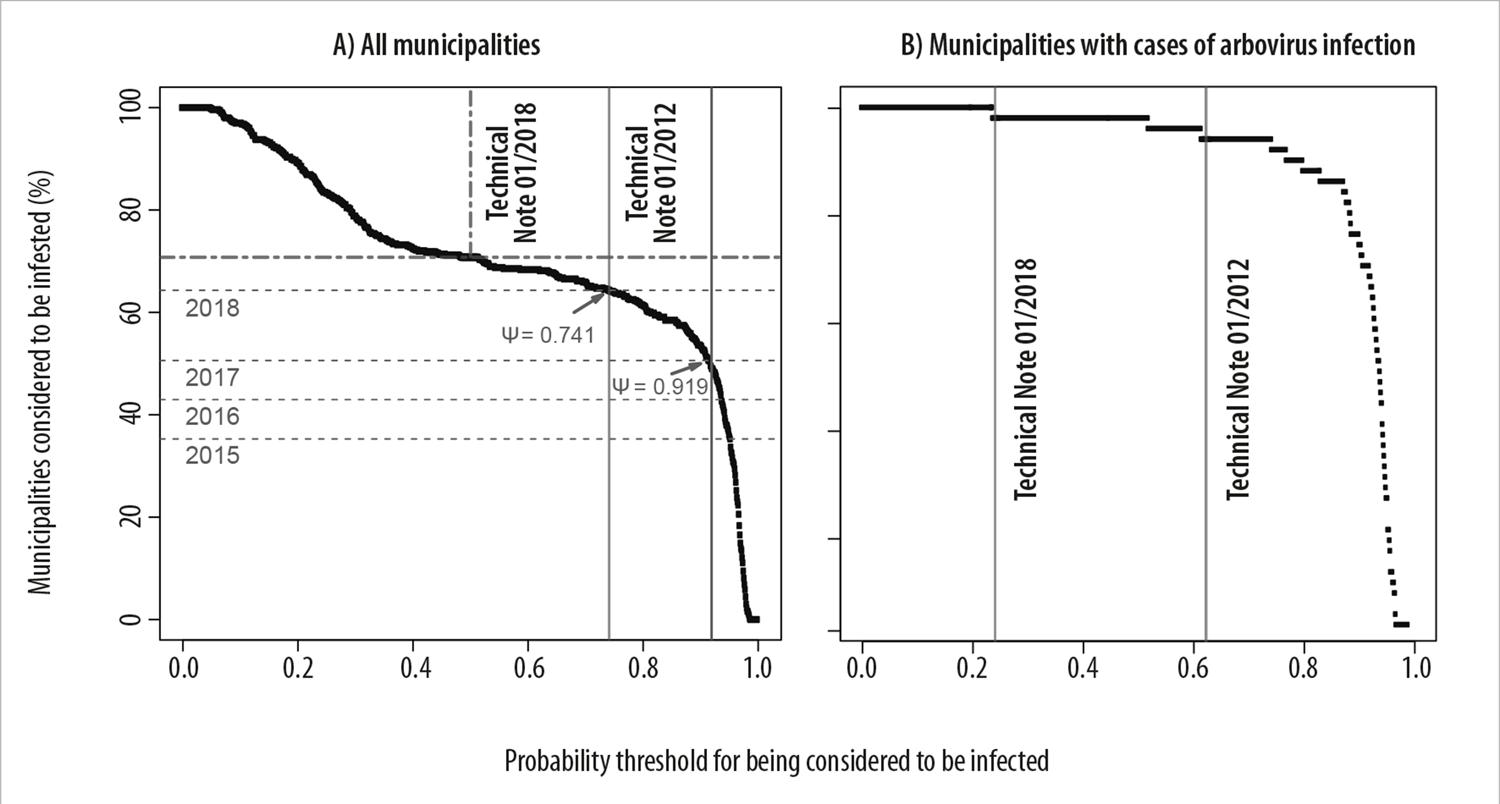
Porcentagem de municípios infestados considerando um limiar de probabilidade igual a 0,5.
Porcentagem de municípios oficialmente infestados no início dos anos incluídos nos dados (2016-2017) e adjacentes aos dados (2015-2018).
Limiar de probabilidade correspondente à porcentagem de municípios infestados segundo a classificação oficial das Normas Técnicas vigentes ao longo do estudo.
Figure 5 – Relationship between the percentage of municipalities officially infested with Aedes aegypti and probability thresholds for binary classification of Aedes aegypti infestation, Rio Grande do Sul, 2016-2017
Discussion
Official mapping of Ae. aegypti infestation was in agreement with probabilistic mapping in municipalities of the northwestern and western regions of Rio Grande do Sul. However, official mapping was in considerable disagreement with probabilistic mapping in municipalities of the eastern, northeastern, central and southern regions of the state, revealing officially uninfested municipalities that had notification of arbovirus infection and high probability of infestation. The estimates also showed that Ae. aegypti and Ae. albopictus had distinct spatial distributions, and that infestations by both species persisted throughout the study in more than a quarter of the state’s municipalities, accounting for more than half at the end of the summer.
The number of infested municipalities was always higher in the probabilistic classifications, compared to the binary classification. The entomological surveillance programs, which provide the basis for the binary classification,16 have an insurmountable limitation: imperfection in the process of detecting breeding sites with mosquitoes.1 As the model corrects this imperfection and incorporates spatial diffusion of infestation, it reduces the frequency of false zeros.1 Three practical recommendations for surveillance emerge from knowledge of biases in mosquito sampling, and they can be extended to other Brazilian states. The first recommendation is that surveillance efforts be regular, in time and in space, in regions with a variable climate, greater heterogeneity in mosquito distribution and facility in infestation and spatial contagion of arbovirus infection.11The second recommendation is to intensify surveillance in municipalities that are on the edges of the geographic distribution of mosquitoes, where uncertainty about infestation is high, resulting from the heterogeneity of the environment.6 The third recommendation is that the entomological surveillance data storage system integrates, on the same platform, the data of the number of buildings inspected, the number of collection tubes gathered and the number of breeding site detected. Lack of this integration prevented us from identifying the municipalities and the epidemiological weeks in which infestation was not detected because of lack of surveillance and lack of collection tubes being gathered.
Comparison between the official mapping and the probabilistic mapping facilitates critical analysis of Aedes surveillance and helps to identify gaps in gaps in knowledge. Such a comparison also maps critical municipalities for allocation of critical municipalities, for allocation of resources to surveillance and vector control. Municipalities in most of the eastern, northeastern, central and southern regions of Rio Grande do Sul, officially taken to be uninfested, reached high probability of Ae. aegypti infestation over the 104 epidemiological weeks analyzed. The analyses showed that binary classification, done as per Technical Note 01/2012, was only sufficiently rigorous to classify municipalities in the northwestern and northwest regions as being infested, where health service managers are aware of the critical situation of infestation and arbovirus infection transmission.11 Technical Note 01/2012 was particularly lenient when classifying as uninfested a large number of municipalities in other regions of the state where infestation varies temporally. The threshold corresponding to Technical Note 01/2018 was some 40% lower than that corresponding to Technical Note 01/2012, resulting in the municipalities of Barão, Barra do Ribeiro and Portão being classified as ‘infested’, while they had low probability of Ae. aegypti infestation but had autochthonous arbovirus infection cases between 2016 and 2017. It can be seen that using arbovirus infection notification as a criterion for classifying a municipality as being infested increased considerably the rigor of the official classification. This criterion is based on a fundamental biological factor fundamental, although neglected until the Technical Note 01/2018: autochthonous arbovirus infection transmission does not take place without the presence of their vectors.19
The maps of the expected numbers of weeks with Ae. aegypti and Ae. albopictus infestation presented differences. Aedes aegypti is sensitive to low temperatures and frequently lives in and around human residences, where it finds food, protected places for laying eggs and temperature stability.6 The results presented reveal longer time of Ae. aegypti infestation in regions with relatively high population density and relatively stable temperature, such as the Porto Alegre metropolitan region and the northwest and western regions of the state.20 These are also regions where the circulation of people and products is high, as well as high availability of artificial breeding sites which result from inadequate basic sanitation.11Aedes albopictus tends to live in regions with more forests and lower temperatures,18 frequently on the edges of forests next to periurban areas and in parks, laying its eggs in hollows of trees and bromeliad species, feeding on the blood of humans and wild animals.8 Its preference for this habitat has been corroborated by greater Ae. albopictus infestation time being found in regions that are colder, densely populated and with greater forestry coverage, such as the Upper Uruguay region of the state and mountains in its central and northeastern regions.23 The differences in the mapped distribution of the species suggest that, depending on the region, arbovirus infections can be transmitted by different vectors. The results also reinforce the importance of considering the role of Ae. albopictus as a vector of arbovirus infections,8 so that vector control in municipalities predominantly infested by this species should be adapted accordingly.
Aedes aegypti and Ae. albopictus persisted throughout the study, in more than a quarter of the state’s municipalities. Persistence of Aedes spp. infestation all year round, with consequent stable arbovirus transmission, is a threat to Public Health in Rio Grande do Sul for the forthcoming decades, when less frost is expected, along with increasing average annual temperature and greater frequency of extreme temperatures and precipitation,30 these being conditions favorable to the development, reproduction and constant egg laying by these mosquitoes.6 Finally, it should be added that the transport of people and products between regions of Brazil facilitates even more the spatial diffusion of infestation, and worsens the future scenario of arbovirus infection transmission.10
Comparing official mapping with probabilistic mapping revealed that the official classification criteria correctly identified critically infested municipalities and those with a history of arbovirus infections being recorded, but they failed to identify infestation in municipalities with possible false zeros and where infestation varies temporally.
Acknowledgements
To Guilherme Barradas Morés, for his suggestions on preparing the statistical model.
REFERENCES
1. Mores GB, Schuler-Faccini L, Hasenack H, Fetzer LO, Souza GD, Ferraz G. Site occupancy by Aedes aegypti in a subtropical city is most sensitive to control during autumn and winter months. Am J Trop Med Hyg [Internet]. 2020 Jul [cited 2020 Jun 07];103(1):445-54. Available from: https://doi.org/10.4269/ajtmh.19-0366 [ Links ]
2. Padilla-Torres SD, Ferraz G, Luz SLB, Zamora-Perea E, Abad-Franch F. Modeling dengue vector dynamics under imperfect detection: three years of site-occupancy by Aedes aegypti and Aedes albopictus in urban Amazonia. PLoS One [Internet]. 2013 Mar [cited 2020 Mar 18];8(3):e58420. Available from: https://doi.org/10.1371/journal.pone.0058420 [ Links ]
3. Veran S, Simpson SJ, Sword GA, Deveson E, Piry S, Hines JE, et al. Modeling spatiotemporal dynamics of outbreaking species: influence of environment and migration in a locust. Ecology [Internet]. 2015 Mar [cited 2020 Mar 18];96(3):737–48. Available from: https://doi.org/10.1890/14-0183.1 [ Links ]
4. Mackenzie DE, Nichols JD, Hines JE, Knutson MG, Franklin AB. Estimating site occupancy, colonization, and local extinction when a species is detected imperfectly. Ecology [Internet]. 2003 Aug [cited 2020 Mar 18];84(8):2200–7. Available from: https://doi.org/10.1890/02-3090 [ Links ]
5. Bled F, Royle JA, Cam E. Hierarchical modeling of an invasive spread: the Eurasian Collared-Dove Streptopelia decaocto in the United States. Ecol Appl [Internet]. 2011 Jan [cited 2020 Mar 18];21(1):290–302. Available from: https://doi.org/10.1890/09-1877.1 [ Links ]
6. Eisen L, Monaghan AJ, Lozano-Fuentes S, Steinhoff DF, Hayden MH, Bieringer PE. The impact of temperature on the bionomics of Aedes (Stegomyia) aegypti, with special reference to the cool geographic range margins. J Med Entomol [Internet]. 2014 May [cited 2020 Mar 18];51(3):496–516. Available from: https://doi.org/10.1603/me13214 [ Links ]
7. Katzelnick LC, Coloma J, Harris E. Dengue: knowledge gaps, unmet needs, and research priorities. Lancet Infect Dis [Internet]. 2017 Mar [cited 2020 Mar 18];17(3):e88–100. Available from: https://doi.org/10.1016/s1473-3099(16)30473-x [ Links ]
8. Pereira-dos-Santos T, Roiz D, Lourenço-de-Lima R, Paupy, C. A systematic review: is Aedes albopictus an efficient bridge vector for zoonotic arboviruses? Pathogens [Internet]. 2020 Apr [cited 2020 Jul 30];9(4):226. Available from: https://doi.org/10.3390/pathogens9040266 [ Links ]
9. Capinha C, Rocha J, Sousa CA. Macroclimate determines the global range limit of Aedes aegypti. EcoHealth [Internet]. 2014 Sep [cited 2020 Dec 16];11(3):420–8. Available from: https://doi.org/10.1007/s10393-014-0918-y [ Links ]
10. Silva AG, Cunha ICL, Santos WS, Luz SLB, Ribolla PEM, Abad-Franch F. Gene flow networks among american Aedes aegypti populations. Evol Appl [Internet]. 2012 Nov [cited 2020 Mar 18];5(4);664–76. Available from: https://dx.doi.org/10.1111%2Fj.1752-4571.2012.00244.x [ Links ]
11. Gregianini TS, Tumioto Giannini GL, Favreto C, Plentz LC, Ikuta N, et al. Dengue in Rio Grande do Sul, Brazil: 2014 to 2016. Rev Med Virol [Internet]. 2018 Jan [cited 2020 Mar 18];28(1):e1960. Available from: https://doi.org/10.1002/rmv.1960 [ Links ]
12. Gregianini TS, Ranieri T, Favreto C, Nunes ZMA, Tumioto Giannini GL, et al. Emerging arboviruses in Rio Grande do Sul, Brazil: Chikungunya and Zika outbreaks, 2014‐2016. Rev Med Virol [Internet]. 2017 Nov [cited 2020 Mar 18];27(6):e1943. Available from: https://doi.org/10.1002/rmv.1943 [ Links ]
13. Zara ALSA, Santos SM, Fernandes-Oliveira ES, Carvalho RG, Coelho GE. Estratégias de controle do Aedes aegypti: uma revisão. Epidemiol Serv Saúde [Internet]. 2016 abr-jun [citado 2020 mar 18];25(2):391-404. Disponível em: http://dx.doi.org/10.5123/S1679-49742016000200017 [ Links ]
14. Kotsakiozi P, Gloria-Soria A, Caccone A, Evans B, Schama R, Martins AJ, et al. Tracking the return of Aedes aegypti to Brazil, the major vector of the dengue, chikungunya and Zika viruses. PLoS Negl Trop Dis [Internet]. 2017 Jul [cited 2020 Mar 18];11(7):e0005653. Available from: https://doi.org/10.1371/journal.pntd.0005653 [ Links ]
15. Carvalho RG, Lourenço-de-Oliveira R, Braga IA. Updating the geographical distribution and frequency of Aedes albopictus in Brazil with remarks regarding its range in the Americas. Mem Inst Oswaldo Cruz [Internet]. 2014 Sep [cited 2020 Mar 18];109(6):787–96. Available from: https://doi.org/10.1590/0074-0276140304 [ Links ]
16. Ministério da Saúde (BR). Fundação Nacional de Saúde. Programa nacional de controle da dengue [Internet]. Brasília: Fundação Nacional de Saúde; 2002 [citado 2020 mar 18]. 34 p. Disponível em: http://bvsms.saude.gov.br/bvs/publicacoes/pncd_2002.pdf [ Links ]
17. Pessanha JEM, Caiaffa WT, César CC, Proietti FA. Avaliação do plano nacional de controle da dengue. Cad Saúde Pública [Internet]. 2009 jul [citado 2020 mar 18];25(7):1637–41. Disponível em: https://doi.org/10.1590/S0102-311X2009000700024 [ Links ]
18. Reinhold JM, Lazzari CR, Lahondère C. Effects of the environmental temperature on Aedes aegypti and Aedes albopictus mosquitoes: a review. Insects [Internet]. 2018 Nov [cited 2020 Mar 18];9(4):E158. Available from: https://doi.org/10.3390/insects9040158 [ Links ]
19. Kraemer MUG, Sinka ME, Duda KA, Mylne AQ, Shearer FM, Barker CM, et al. The global distribution of the arbovirus vectors Aedes aegypti and Ae. albopictus. eLife [Internet]. 2015 Jun [cited 2020 Mar 18];4:e08347. Available from: https://doi.org/10.7554/elife.08347 [ Links ]
20. Centro Estadual de Vigilância em Saúde. Informativo epidemiológico de arboviroses: semana epidemiológica 35/2020 (23/08 a 29/08) [Internet]. Porto Alegre: Centro Estadual de Vigilância em Saúde; 2020 [citado 2020 out 03]. 13 p. Disponível em: https://www.cevs.rs.gov.br/dengue-chikungunya-Zika-virus [ Links ]
21. Tumioto GL, Gregianini TS, Dambros BP, Cestari BC, Nunes ZMA, Veiga ABG, et al. Laboratory surveillance of dengue in Rio Grande do Sul, Brazil, from 2007 to 2013. PLoS One [Internet]. 2014 Aug [cited 2020 Mar 18];9(8):e104394. Available from: https://doi.org/10.1371/journal.pone.0104394 [ Links ]
22. Instituto Brasileiro de Geografia e Estatística - IBGE. Ministério da Economia. Estimativas da população [Internet]. Rio de Janeiro: IBGE; 2017 [citado 2020 mar 18]. Disponível em: https://www.ibge.gov.br/estatisticas/sociais/populacao/9103-estimativas-de-populacao.html?edicao=16985&t=resultados [ Links ]
23. Pessoa ML. Atlas da Fundação Estadual de Estatística [Internet]. Porto Alegre: Governo do Estado do Rio Grande do Sul; Fundação Estadual de Estatística; 2017 [citado 2020 mar 18]. Disponível em: http://atlas.fee.tche.br/ [ Links ]
24. Instituto Brasileiro de Geografia e Estatística - IBGE. Ministério do Planejamento, Orçamento e Gestão. Mapa de clima do Brasil 1:5 000 000 [internet]. Rio de Janeiro: IBGE; 2002 [citado 2020 jun 06]. Disponível em: http://geoftp.ibge.gov.br/informacoes_ambientais/climatologia/mapas/brasil/Map_BR_clima_2002.pdf [ Links ]
25. Instituto Nacional de Meteorologia - INMET (BR). Ministério da Agricultura, Agropecuária e Abastecimento. BDMEP - Banco de dados meteorológicos para ensino e pesquisa [Internet]. Brasília: INMET; 2019 [citado 2020 mar 18]. Disponível em: http://www.inmet.gov.br/portal/index.php?r=bdmep/bdmep [ Links ]
26. Ribeiro MC, Metzger JP, Martensen AC, Ponzoni FJ, Hirota MM. The Brazilian atlantic forest: how much is left, and how is the remaining forest distributed? Implications for conservation. Biol Conserv [Internet]. 2009 Jun [cited 2020 Sep 03];142(6):1141-53. Available from: https://doi.org/10.1016/j.biocon.2009.02.021 [ Links ]
27. Rio Grande do Sul. Centro Estadual de Vigilância em Saúde. Nota técnica nº 01, de 29 de junho de 2012. Regulamenta os critérios para declarar município infestado por Aedes aegypti. Porto Alegre (RS); 2012. [ Links ]
28. Rio Grande do Sul. Centro Estadual de Vigilância em Saúde. Nota técnica nº 01, de 19 de janeiro de 2018. Regulamenta os critérios para declarar município infestado ou não infestado por Aedes aegypti. Porto Alegre (RS); 2018. [ Links ]
29. R Core Team. R: A language and environment for statistical computing. Versão 3.6.1 [Internet]. [Vienna]: R Foundation for Statistical Computing; 2019. Available from: https://www.R-project.org/ [ Links ]
30. Marengo J. O futuro clima do Brasil. Rev USP [Internet]. 2014 [citado 2020 mar 18];103:25–32. Disponível em: https://doi.org/10.11606/issn.2316-9036.v0i103p25-32 [ Links ]
Received: April 24, 2020; Accepted: September 23, 2020
 This is an Open Access article distributed under the terms of the Creative Commons Attribution Non-Commercial License, which permits unrestricted non-commercial use, distribution, and reproduction in any medium, provided the original work is properly cited.
