


Serviços Personalizados
Journal

Artigo
 texto em
  Inglês (pdf)
 Artigo em XML
 Referências do artigo
 Enviar este artigo por email
Indicadores
-
 Citado por SciELO
Links relacionados
-
 Similares em
SciELO
Similares em
SciELO
Compartilhar

 Permalink
Epidemiologia e Serviços de Saúde
versão impressa ISSN 1679-4974versão On-line ISSN 2237-9622
Epidemiol. Serv. Saúde vol.30 no.3 Brasília set. 2021 Epub 04-Ago-2021
http://dx.doi.org/10.1590/s1679-49742021000300008
ORIGINAL ARTICLE
Food intake patterns and high blood pressure levels among Brazilians: a cross-sectional study, 2013*
1Universidade Federal do Ceará, Programa de Pós-Graduação em Saúde Pública, Fortaleza, CE, Brazil
2Universidade Estadual do Ceará, Curso de Nutrição, Fortaleza, CE, Brazil
Objective:
To analyze association between patterns of food intake markers and high blood pressure levels among Brazilians.
Methods:
This was a cross-sectional study using National Health Survey data. Its outcome was high blood pressure levels, measured during interviews between August and November 2013. Food intake marker patterns were identified. These were the exposure variables. Prevalence ratios (PR) and 95% confidence intervals (95%CI) were calculated using multivariate Poisson regression.
Results:
High blood pressure prevalence was 16.0% (95%CI - 15.3;16.7) in the sample of 37,216 participants. It was higher in those with a diet that included meat and alcoholic beverages (PR=1.21 - 95%CI 1.08;1.35). The pattern with greater presence of greens and vegetables did not show statistically significant association with high blood pressure levels (PR=0.94 - 95%CI 0.84;1.06).
Conclusion:
The pattern marked by meat and alcoholic beverages was associated with high blood pressure levels.
Keywords: Nutritional Epidemiology; Noncommunicable Diseases; Cardiovascular Diseases; Feeding Behavior; Health Surveys; Cross-Sectional Studies
Introduction
Hypertension diagnosis prevalence was 29.3% in Brazil in 2019.1 In 2018, 53,205 deaths from hypertensive diseases were recorded, the tenth leading group in absolute numbers of deaths in the country.2 High blood pressure levels contribute to higher incidence and worse outcomes of diseases with that contribute considerably to the burden of mortality in Brazil, such as ischemic heart disease3 and disease caused by the SARS-CoV-2 virus (COVID-19).4
Successful treatment of high blood pressure levels through nutritional measures is considered to depend on the adoption of a healthy and sustainable eating plan.5 Eating patterns describe varied combinations of the total amount of foods and nutrients people consume.5)-(7 In general, to the extent that they define diet, these patterns are studied as potential influencers of various health outcomes.5)-(7 Standing out in particular among the associations found between eating patterns and high blood pressure levels are patterns characterized by foods of animal origin and foods rich in sugar.5
Surveys such as the Brazilian National Health Survey capture markers of food intake.8 Standing out as risk factors when these markers were studied separately from each other with regard to their association with poorer cardiovascular health, were intake of red meat with fat, abusive intake of alcoholic beverages and high salt intake, while adequate intake of fruit and vegetables proved to be a protective factor.9
The impact of high blood pressure levels and their related outcomes justify the refinement and adaptation of techniques for analyzing diet as a protective or risk factor for this condition.6),(9 Multivariate statistical methods enable operationalization of sets of variables. In this sense, identification of patterns that explain, to a greater extent, the variability of food intake in the country can contribute to targeting health interventions.2),(7),(9
The objective of this study was to analyze association between patterns of food intake markers and high blood pressure levels among Brazilians.
Methods
This was a cross-sectional study of association between food intake patterns and high blood pressure levels in Brazilians, based on data retrieved from the 2012 National Health Survey.8
The National Health Survey sample consisted of permanent residents of private households, within the geographical area covered by the survey. ‘Geographic coverage’ was defined as the entire national territory, divided by the 2010 census tracts, excluding areas with special characteristics and small populations.8),(9
One resident aged 18 years or older from each selected household was interviewed. Adults aged 20 years or older whose blood pressure was measured three times were considered eligible for this analysis. Pregnant women or women unaware of their pregnancy status, people taking medication for hypertension, and those with previous diagnosis of hypertension, high cholesterol, diabetes mellitus, or cardiovascular disease were excluded.
The primary outcome of the study was having high blood pressure levels (yes; no). The other variables were:
Adherence to Pattern 1 -- characterized by a larger amount of greens and vegetables (score quartiles);
Adherence to Pattern 2 - characterized by a larger amount of meat and alcoholic beverages (score quartiles);
Brazilian macro-region (Southeast; Northeast; South; North; Midwest);
Sex (female; male);
Race/skin color (white; black; yellow; brown; indigenous);
Age group (in years: 20-29; 30-39; 40-49; 50-59; 60-69; 70 or over);
Schooling (incomplete high school education or lower; complete high school education or above)
Monthly per capita household income (less than one minimum wage [BRL 678.00, in force in 2013,10 the year in which the data were collected]; more than one minimum wage);
Practices physical exercise (yes; no);
Tobacco smoking (yes; no);
Nutritional status (underweight/normal weight; overweight; obesity);
Waist circumference (low risk; increased risk).
Each participant’s systolic and diastolic blood pressure was measured three times using a digital measuring device. When the average of the three systolic blood pressure measurements was ≥140 mmHg or the average of the three diastolic blood pressure measurements was ≥90 mmHg, participants were considered to have high blood pressure levels.11
The practicing physical exercise variable was identified as ‘yes’ when participants answered positively when asked whether during the last three months they had done some form of physical exercise or sport, and ‘no’ when they answered the same question negatively. The ‘tobacco smoking’ variable was identified as ‘yes’ when participants answered positively when asked if they currently smoked any form of tobacco product, and ‘no’ when they answered the same question negatively.
Respondents’ weight and height were measured at the time of the interview.12 Nutritional status was assessed based on body mass index (BMI), calculated by dividing weight (in kilograms: kg) by height (in square meters: m²), classified as follows: underweight (<18.5kg/m²); normal weight (≥18.5kg/m² and <25kg/m²); overweight (≥25kg/m² and <30kg/m²); and obesity (≥30kg/m²).
Waist circumference was measured using an anthropometric tape measure, placed at the midpoint between the twelfth rib and the iliac crest,12 classified as follows: for males, low risk (<88cm) (reference) and increased risk (≥89cm); and for females, low risk (<83cm) (reference) and increased risk (≥84cm).13
The variables relating to food were comprised of food intake markers with information about weekly intake, frequency and characteristics of intake of beans, raw greens and vegetables, cooked greens and vegetables, red meat (with or without fat), chicken (with or without skin), fish, fruit juice, fruit, soda (diet/light/zero or unspecified, including normal or diet/light/zero soda), milk (skimmed or unspecified, including whole and skimmed milk), sweetmeats, savory snacks and alcoholic beverage. The analysis was based on the frequency of food intake, i.e. number of days per week.
Food intake was categorized using the principal component factors (PCF) technique, in which variables referring to weekly frequency of food intake were used to empirically formalize scores related to distinct food intake marker patterns based on the answers given by the sample in question. This technique specifically considers the sample being assessed and studies that aim to capture the uniqueness of specific populations, to which it is applicable according to their own results.7
Bartlett's test of sphericity (p<0.001) and the Kaiser-Meyer-Olkin test for sampling adequacy (KMO=0.590) were applied to the variables related to food intake markers. The main factors associated with weekly food intake were assessed using the scree plot technique, allowing identification of which two factors explained greater proportions of variance (eigenvalues).7
Varimax orthogonal rotation was used, followed by determination of food items with loadings greater than 0.2 for each pattern observed (Table 1). This value was chosen for the purposes of comparability with recently published studies on dietary patterns.14),(15 The dietary patterns found were then named as:
A score was calculated for each food intake marker chosen, based on the sum of the days of food intake per week - centralized so as to have a mean of zero - weighted by their respective loadings. The scores were categorized into quartiles, in order to classify each individual's adherence to each of the observed food intake marker patterns, with the first quartile being taken as the reference for the analyses.7
In order to control for biases, we chose to use measured blood pressure instead of self-reported hypertension, with the aim of achieving greater measurement specificity. We decided to exclude individuals previously diagnosed as having cardiovascular disease in order to avoid the influence of these diagnoses on the choice of more cautious answer options for health-related behaviors (sick-quitter bias).17 Effects arising from changes in the full National Health Survey sample, due to the exclusion criteria used for the sample analyzed here, were attenuated by calibrating the subsample for age group, sex, and schooling.18
The data were analyzed descriptively, in absolute frequencies, according to the number of observations, and in relative frequencies weighted by the sample weights; and 95% confidence intervals (95%CI) for the relative frequencies.
Multivariate Poisson regression was performed. The outcome was having or not having high blood pressure levels. The independent variables were entered manually, in blocks of (i) demographic and socioeconomic aspects, (ii) health behaviors, and (iii) anthropometric indicators. Variance inflation factors were generated among the independent variables, and no multicollinearity was observed. The hypertension prevalence ratio (PR) and respective 95%CI were calculated. The significance of the variables was verified using the Wald test, taking a reference level of p<0.05.19 The variables related to food intake marker patterns were kept in the model, regardless of their p-value, because they were the exposure variables of interest to the study.
All statistical analyses were performed using Stata/MP version 15 software. Its survey module was used to correct for complex sample design effect19 and respondent sampling weight was calibrated for age group, sex, and schooling, based on the total National Health Survey sample.20
The National Health Survey was approved by the National Health Council’s National Research Ethics Committee, as per Opinion No. 328.159 issued on June 26th 2013, and as per Certificate of Submission for Ethical Appraisal No. 10853812.7.0000.0008. The study only used public domain National Health Survey data, with no identification of participants, so that ethical appraisal as recommended by National Health Council Resolution No. 466, dated December 12th 2012, was not required.21
Results
Among the 37,216 individuals assessed (Figure 1), we found high blood pressure prevalence of 16.0%. Most of the population resided in the Southeast (41.8%) and Northeast (27.9%) regions of the country and were mostly female (52.9%), in the 20-29 year age group (31.0%), with incomplete high school education or lower (75.2%) and monthly per capita household income equal to or less than one minimum wage (82.5%) (Table 2).
Individuals with higher adherence to Pattern 2 showed higher prevalence of high blood pressure levels, both in the crude analysis (PR=1.42 - 95%CI 1.27;1.60) and in the analysis adjusted for the other covariates in the final model (PR=1.21 - 95%CI 1.08;1.35) (Table 3).
After adjustment, in the final model, individuals from the North and Midwest regions were found to have lower odds of having high blood pressure levels. The odds of having high blood pressure levels were higher for the following characteristics-variables: males; all age groups in relation to the 20-29 year age group; higher education, complete high school education or less; and monthly per capita household income of up to one minimum wage. High blood pressure levels were less prevalent among those who practiced physical exercise. High blood pressure levels were more prevalent among the obese and overweight, as well as those with large waist circumferences, indicating risk of metabolic complications (Table 3).
Table 1 - Factor loads of patterns related to food intake markers in a sample of Brazilians (n=37,216) and proportion of variance explained by each factor, Brazil, 2013
| Food intake marker | Pattern 1 | Pattern 2 |
|---|---|---|
| Beans | 0.16 | 0.05 |
| Raw vegetables | 0.74 | -0.04 |
| Cooked vegetables | 0.72 | -0.03 |
| Meat without fat | 0.04 | -0.88 |
| Meat with fat | -0.03 | 0.83 |
| Chicken without skin | 0.10 | -0.08 |
| Chicken with skin | 0.02 | 0.20 |
| Fish | 0.05 | 0.13 |
| Fruit juice | 0.51 | -0.01 |
| Fruit | 0.66 | -0.09 |
| Ordinary/unspecified soda | -0.25 | 0.15 |
| Diet/light/zero soda | 0.11 | -0.18 |
| Skimmed milk | 0.23 | -0.07 |
| Whole/whole and skimmed milk | 0.13 | -0.11 |
| Sweetmeats | 0.19 | 0.01 |
| Hamburgers, fried snacks or pizzas | 0.08 | -0.05 |
| Alcoholic beverage | -0.01 | 0.27 |
| Proportion of variance explained (%) | 12% | 10% |
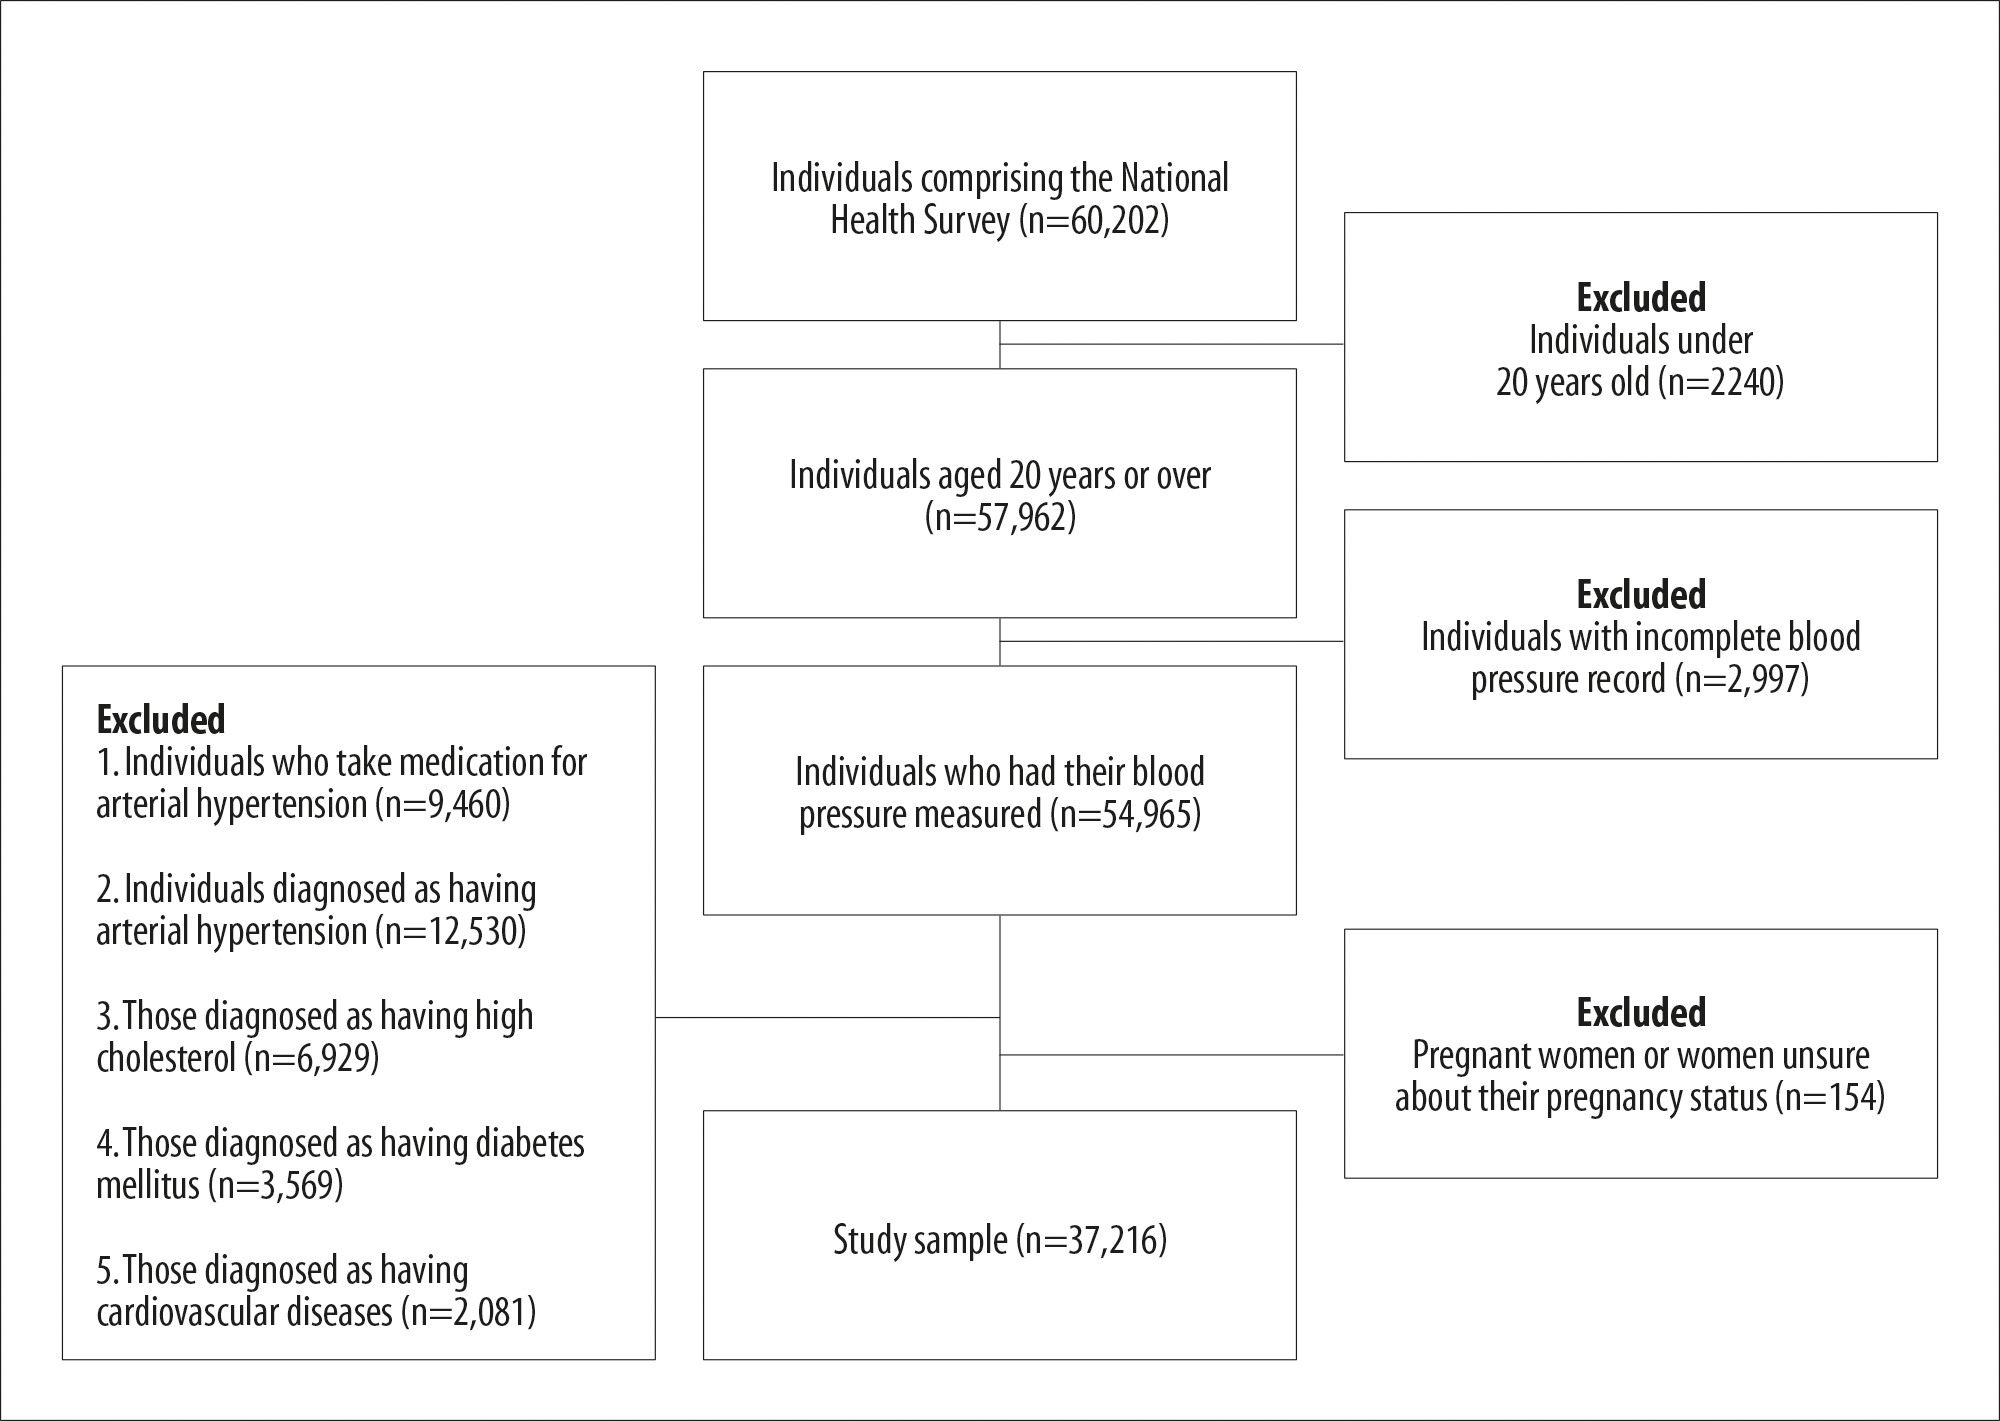
Figure 1 - Variations in the sample size after applying inclusion and exclusion criteria to the National Health Survey sample, Brazil, 2013
Table 2 - Characterization of the sample of Brazilians (n=37,216) with regard to high blood pressure levels and demographic, socioeconomic, health behavior and anthropometric aspects, Brazil, 2013
| Variable | na | %b | 95%CIc |
|---|---|---|---|
| High blood pressure levels | |||
| No | 31,281 | 84.0 | 83.3;84.7 |
| Yes | 5,935 | 16.0 | 15.3;16.7 |
| Eating pattern 1 | |||
| Quartile 1 | 9,318 | 23.8 | 23.0;24.6 |
| Quartile 2 | 9,290 | 25.1 | 24.3;25.9 |
| Quartile 3 | 9,305 | 25.6 | 24.7;26.4 |
| Quartile 4 | 9,303 | 25.5 | 24.7;26.4 |
| Eating pattern 2 | |||
| Quartile 1 | 10,682 | 29.1 | 28.2;30.0 |
| Quartile 2 | 10,412 | 26.7 | 25.8;27.6 |
| Quartile 3 | 7,648 | 19.5 | 18.8;20.3 |
| Quartile 4 | 8,474 | 24.7 | 23.9;25.6 |
| Brazilian macro-region | |||
| Southeast | 8,440 | 41.8 | 40.8;42.7 |
| Northeast | 11,291 | 27.9 | 27.1;28.6 |
| South | 4,452 | 14.5 | 13.9;15.1 |
| North | 8,406 | 8.3 | 8.0;8.6 |
| Midwest | 4,627 | 7.5 | 7.3;7.8 |
| Sex | |||
| Female | 19,519 | 52.9 | 51.9; 53.8 |
| Male | 17,697 | 47.1 | 46.2; 48.0 |
| Race/skin color | |||
| White | 14,489 | 46.0 | 45.0;47.0 |
| Black | 3,430 | 9.2 | 8.7;9.8 |
| Yellow | 325 | 0.9 | 0.8;1.1 |
| Brown | 18,710 | 43.4 | 42.4;44.4 |
| Indigenous | 262 | 0.4 | 0.3;0.5 |
| Age group (years) | |||
| 20-29 | 10,167 | 31.0 | 30.2;31.9 |
| 30-39 | 11,008 | 28.6 | 27.7;29.5 |
| 40-49 | 7,567 | 20.7 | 19.9;21.3 |
| 50-59 | 4,562 | 13.7 | 13.0;14.4 |
| 60-69 | 2,320 | 3.6 | 3.4;3.9 |
| ≥70 | 1,592 | 2.4 | 2.2;2.7 |
| Schooling | |||
| Incomplete high school education or lower | 26,741 | 75.2 | 74.3;76.1 |
| Complete high school education or above | 10,475 | 24.7 | 23.8;25.7 |
| Monthly per capita household income | |||
| Up to 1 minimum wage | 28,558 | 82.5 | 81.7;83.2 |
| More than 1 minimum wage | 8,658 | 17.5 | 16.8;18.2 |
| Practices physical exercise | |||
| No | 25,775 | 68.2 | 67.2;69.1 |
| Yes | 11,441 | 31.8 | 30.9;32.8 |
| Tobacco smoking | |||
| No | 31,427 | 84.6 | 84.0;85.3 |
| Yes | 5,789 | 15.4 | 14.7;16.0 |
| Nutritional statusd | |||
| Underweight/normal weight | 17,638 | 48.6 | 47.6;49.6 |
| Overweight | 13,219 | 35.6 | 34.8;36.5 |
| Obesity | 5,786 | 15.7 | 15.1;16.4 |
| Waist circumferencee | |||
| Low risk | 16,128 | 44.9 | 43.9;45.9 |
| Increased risk | 20,571 | 55.1 | 54.0;56.1 |
a) Number of observations; variations in the number of observations due to non-inclusion of empty values in the analyses; b) Weighted relative frequency of the variables (column); c) 95%CI: 95% confidence interval of the weighted relative frequency; d) 573 missing data due to no information on weight and/or height; e) 517 missing data due to no information on waist circumference.
Table 3 - Association between high blood pressure levels, food intake marker patterns demographic, socioeconomic, health behavior and anthropometric aspects in a sample of Brazilians (n=37,216), Brazil, 2013
| Variable | Crude model | Model 1a | Model 2b | Model 3c | ||||||||
|---|---|---|---|---|---|---|---|---|---|---|---|---|
| PRd (95%CIe) | p-valuef | PRd (95%CIe) | p-valuef | PRd (95%CIe) | p-valuef | PRd (95%CIe) | p-valuef | |||||
| Pattern 1 | ||||||||||||
| Quartile 1 | 1.00 | 0.417 | 1.00 | 0.446 | 1.00 | 0.815 | 1.00 | 0.510 | ||||
| Quartile 2 | 0.92 (0.82;1.03) | 0.92 (0.82;1.02) | 0.92 (0.83;1.03) | 0.91 (0.82;1.02) | ||||||||
| Quartile 3 | 0.92 (0.82;1.03) | 0.90 (0.81;1.01) | 0.92 (0.82;1.03) | 0.91 (0.81;1.02) | ||||||||
| Quartile 4 | 0.95 (0.84;1.07) | 0.93 (0.83;1.05) | 0.96 (0.85;1.08) | 0.94 (0.84;1.06) | ||||||||
| Pattern 2 | ||||||||||||
| Quartile 1 | 1.00 | <0.001 | 1.00 | <0.001 | 1.00 | <0.001 | 1.00 | <0.001 | ||||
| Quartile 2 | 1.01 (0.90;1.13) | 1.02 (0.91;1.14) | 1.02 (0.91;1.14) | 1.03 (0.92;1.15) | ||||||||
| Quartile 3 | 1.16 (1.03;1.31) | 1.09 (0.96;1.23) | 1.09 (0.97;1.23) | 1.10 (0.97;1.24) | ||||||||
| Quartile 4 | 1.42 (1.27;1.60) | 1.23 (1.10;1.38) | 1.23 (1.09;1.37) | 1.21 (1.08;1.35) | ||||||||
| Brazilian macro-region | ||||||||||||
| Southeast | 1.00 | <0.001 | 1.00 | <0.001 | 1.00 | <0.001 | 1.00 | <0.001 | ||||
| Northeast | 0.93 (0.84;1.02) | 0.91 (0.82;1.01) | 0.91 (0.82;1.01) | 0.91 (0.82;1.01) | ||||||||
| South | 0.98 (0.85;1.12) | 1.03 (0.90;1.17) | 1.03 (0.90;1.17) | 1.01 (0.89;1.15) | ||||||||
| North | 0.60 (0.53;0.69) | 0.63 (0.54;0.72) | 0.63 (0.55;0.72) | 0.63 (0.55;0.73) | ||||||||
| Midwest | 0.83 (0.74;0.93) | 0.85 (0.76;0.96) | 0.85 (0.76;0.96) | 0.85 (0.76;0.96) | ||||||||
| Race/skin color | ||||||||||||
| White | 1.00 | 0.469 | 1.00 | 0.799 | 1.00 | 0.842 | 1.00 | 0.499 | ||||
| Black | 1.38 (1.20;1.58) | 1.38 (1.21;1.58) | 1.38 (1.21;1.57) | 1.4 (1.22;1.60) | ||||||||
| Yellow | 0.83 (0.51;1.33) | 0.96 (0.63;1.48) | 0.97 (0.63;1.49) | 1.06 (0.69;1.63) | ||||||||
| Brown | 0.99 (0.91;1.09) | 1.10 (1.00;1.20) | 1.09 (1.00;1.20) | 1.11 (1.01;1.22) | ||||||||
| Indigenous | 0.79 (0.47;1.31) | 0.93 (0.57;1.53) | 0.93 (0.57;1.52) | 0.97 (0.60;1.57) | ||||||||
| Age group (years) | ||||||||||||
| 20-29 | 1.00 | <0.001 | 1.00 | <0.001 | 1.00 | <0.001 | 1.00 | <0.001 | ||||
| 30-39 | 1.69 (1.46;1.94) | 1.66 (1.44;1.91) | 1.63 (1.41;1.89) | 1.49 (1.29;1.72) | ||||||||
| 40-49 | 2.65 (2.31;3.03) | 2.59 (2.26;2.96) | 2.53 (2.20; 2.90) | 2.21 (1.92;2.53) | ||||||||
| 50-59 | 3.85 (3.35;4.43) | 3.59 (3.12;4.14) | 3.49 (3.02;4.03) | 3.03 (2.61;3.52) | ||||||||
| 60-69 | 4.4 (3.77;5.14) | 4.30 (3.68;5.02) | 4.16 (3.55;4.86) | 3.65 (3.12;4.26) | ||||||||
| ≥70 | 6.02 (5.15;7.04) | 5.77 (4.91;6.77) | 5.58 (4.74;6.58) | 5.15 (4.35;6.09) | ||||||||
| Sex | ||||||||||||
| Female | 1.00 | <0.001 | 1.00 | <0.001 | 1.00 | <0.001 | 1.00 | <0.001 | ||||
| Male | 1.68 (1.54;1.82) | 1.60 (1.47;1.74) | 1.61 (1.48;1.75) | 1.67 (1.53;1.81) | ||||||||
| Schooling | ||||||||||||
| Complete high school education or above | 1.00 | <0.001 | 1.00 | <0.001 | 1.00 | <0.001 | 1.00 | <0.001 | ||||
| Incomplete high school education or lower | 1.78 (1.59;1.99) | 1.33 (1.18;1.50) | 1.31 (1.16;1.48) | 1.29 (1.15;1.46) | ||||||||
| Monthly per capita household income | ||||||||||||
| Up to 1 minimum wage | 1.00 | 0.147 | 1.00 | 0.165 | 1.00 | 0.257 | 1.00 | 0.044 | ||||
| More than 1 minimum wage | 1.07 (0.98;1.18) | 0.92 (0.83;1.02) | 0.93 (0.84;1.03) | 0.89 (0.81;0.99) | ||||||||
| Practices physical exercise | ||||||||||||
| No | 1.00 | <0.001 | - | 1.00 | 0.019 | 1.00 | 0.028 | |||||
| Yes | 0.72 (0.65;0.80) | - | 0.9 (0.81;1.00) | 0.9 (0.82;1.00) | ||||||||
| Tobacco smoking | ||||||||||||
| No | 1.00 | <0.001 | - | 1.00 | 0.207 | 1.00 | 0.004 | |||||
| Yes | 1.34 (1.21;1.49) | - | 1.03 (0.93;1.14) | 1.13 (1.02;1.25) | ||||||||
| Nutritional status | ||||||||||||
| Underweight/normal weight | 1.00 | <0.001 | - | 1.00 | <0.001 | |||||||
| Overweight | 1.59 (1.44;1.74) | - | - | 1.19 (1.06;1.33) | ||||||||
| Obesity | 1.91 (1.71;2.12) | - | - | 1.45 (1.28;1.65) | ||||||||
| Waist circumference | ||||||||||||
| Low risk | 1.00 | <0.001 | - | - | 1.00 | <0.001 | ||||||
| Increased risk | 2.05 (1.86;2.25) | - | - | 1.44 (1.27;1.62) | ||||||||
a) Model adjusted by demographic and socioeconomic variables; b) Model adjusted by health behavior-related variables and all other Model 1 variables; c) Model adjusted by anthropometric variables and all other Model 2 variables; d) PR: prevalence ratio; e) 95%CI: 95% confidence interval; f) Wald test.
Discussion
Prevalence of high blood pressure levels was greater among those adhering to Pattern 2. This pattern provides the best explanation of the variation in the weekly food intake of Brazilians, even when adjusted for risk factors already well defined in the literature, such as advanced age, male gender, sedentary lifestyle, tobacco smoking, overweight, and large waist circumference.11),(13
This study has certain limitations. One of them is the lack of data on food and nutritional security, considering that this is one of the intermediary situations between socioeconomic aspects and inadequate food intake patterns, capable of leading to high blood pressure levels and other noncommunicable chronic diseases.22 In addition, more detailed data on food intake would be desirable, as measured by a food frequency questionnaire, for instance.6),(7
In turn, Pattern 1 showed no statistically significant association with high blood pressure levels. It is noteworthy that the method usually used differs from the method used in this study because it is based on more detailed patterns, obtained by applying food frequency questionnaires, which allows a more detailed estimate of healthy food intake, compared to that obtained by food intake markers based on days per week of intake according to food groups.6),(7
The fact that high blood pressure levels were less prevalent in the portion of the sample corresponding to those who practiced some form of leisure-time exercise allows us to infer the benefits of frequent exercise, in its various degrees of intensity. The results of this study are corroborated by reports of conclusive meta-analyses, either in relation to practicing light exercise (e.g., doing movements of the tai chi chuan martial art for more than 12 weeks23), or in relation to doing aerobic exercise, dynamic strength training, and isometric strength training for at least four weeks,24 as being effective in reducing blood pressure levels.
Associations were found between hypertension and socioeconomic status, possibly due to its relationship with educational aspects, food insecurity, occupation, and income.25),(26 Using measured blood pressure instead of self-reported hypertension may have increased the representation of individuals from lower socioeconomic levels, since the beneficiaries of private health plans are proportionally more diagnosed as having hypertension.27 It is considered, however, that specificity of blood pressure measurement12 and non-interference of previous diagnoses in the interviewees' behaviors17 should clarify the inferences of this study.
Nutritional status and large waist circumference were associated with high blood pressure levels, even when adjusted for behavioral aspects related to diet, exercise, and tobacco smoking. This may be considered to be a reflection of the chronic and multicausal nature of the outcome in question, given the underlying risk factors that the anthropometric indicators employed represent, such as levels of total cholesterol, HDL cholesterol and blood glucose.13
Prevalence of high blood pressure levels was lower in individuals with higher family income. This was statistically significant after adjusting for the other variables, possibly because households with higher incomes have greater chances of food and nutritional security, as well as greater access to adequate and healthy food.25
In conclusion, we identified two patterns of food intake markers and higher prevalence of high blood pressure levels in the group with the eating pattern characterized by higher presence of meat and alcoholic beverages. The pattern with higher presence of greens and vegetables did not show statistically significant association with blood pressure levels. Moreover, this information can be used to guide health education actions based on the two patterns identified, focusing on the most influential food intake markers in each pattern.
REFERENCES
1. Instituto Brasileiro de Geografia e Estatística. Pesquisa nacional de saúde 2019: tabelas [Internet]. [local desconhecido]: IBGE; 2020 [acesso em 08 dez. 2020]. Disponível em: Disponível em: https://www.ibge.gov.br/estatisticas/sociais/saude/9160-pesquisa-nacional-de-saude.html?=&t=resultados [ Links ]
2. Ministério da Saúde (BR). Informações de saúde (TABNET):. estatísticas vitais: mortalidade - 1996 a 2018, pela CID-10 [internet]. [Brasília, DF]: MS; 2020 [acesso 8 dez. 2020]. Disponível em:Disponível em:http://www2.datasus.gov.br/DATASUS/index.php?area=0205 . [ Links ]
3. Lessa I. Epidemiologia das doenças cardiovasculares. In: Almeida-Filho N, Barreto ML. Epidemiologia e saúde: fundamentos, métodos, aplicações. Rio de Janeiro: Guanabara Koogan; 2011. p. 488-500. [ Links ]
4. Rodgers GP, Gibbons GH. Obesity and hypertension in the time of COVID-19. JAMA. 2020 Sep 22;324(12):1163-5. doi: http://doi.org/10.1001/jama.2020.16753. [ Links ]
5. Shridhar K, Satija A, Dhillon PK, Agrawal S, Gupta R, Bowen L, et al. Association between empirically derived dietary patterns with blood lipids, fasting blood glucose and blood pressure in adults: the India migration study. Nutr J . 2018 Feb. 8;17(1):15. doi: https://doi.org/10.1186/s12937-018-0327-0. [ Links ]
6. Ocké MC. Evaluation of methodologies for assessing the overall diet: dietary quality scores and dietary pattern analysis. Proc Nutr Soc. 2013;72(2):191-9. doi: http://doi.org/10.1017/S0029665113000013. [ Links ]
7. Santos RO, Gorgulho BM, Castro MA, Fisberg RM, Marchioni DM, Baltar VT. Principal Component Analysis and Factor Analysis: differences and similarities in Nutritional Epidemiology application. Rev Bras Epidemiol. 2019 Jul. 29;22:e190041. doi: https://doi.org/10.1590/1980-549720190041. [ Links ]
8. Instituto Brasileiro de Geografia e Estatística. Pesquisa nacional de saúde 2013. Rio de Janeiro: IBGE; 2015. ISBN 978-85-240-4346-8. [ Links ]
9. Gonçalves RPF, Haikal DS, Freitas MIF, Machado IE, Malta DC. Diagnóstico médico autorreferido de doença cardíaca e fatores de risco associados: pesquisa nacional de saúde. Rev Bras Epidemiol. 2019 out. 7;22(Suppl 02):E190016.SUPL.2. doi: https://doi.org/10.1590/1980-549720190016.supl.2. eCollection 2019. [ Links ]
10. Brasil. Decreto n.º 7.872, de 26 de dezembro de 2012. Regulamenta a Lei nº 12.382, de 25 de fevereiro de 2011, que dispõe sobre o valor do salário mínimo e a sua política de valorização de longo prazo [Internet]. Brasília, DF: Diário Oficial da União, 2012 [acesso 13 jan. 2021]. Disponível em: Disponível em: http://www.planalto.gov.br/ccivil_03/_Ato2011-2014/2012/Decreto/D7872.htm [ Links ]
11. Williams B, Mancia G, Spiering W, Rosei EA, Azizi M, Burnier M, et al. 2018 ESC/ESH Guidelines for the management of arterial hypertension: the task force for the management of arterial hypertension of the European Society of Cardiology (ESC) and the European Society of Hypertension (ESH). Eur Heart J. 2018 Sep. 1;39(33):3021-104. doi: https://doi.org/10.1093/eurheartj/ehy339. [ Links ]
12. Instituto Brasileiro de Geografia e Estatística. Pesquisa nacional de saúde 2013: manual de antropometria. Rio de Janeiro: IBGE ; 2013. [ Links ]
13. Pitanga FJG, Lessa I. Indicadores antropométricos de obesidade como instrumento de triagem para risco coronariano elevado em adultos na cidade de Salvador - Bahia. Arq Bras Cardiol. 2005;85(1):26-31. doi: https://doi.org/10.1590/S0066-782X2005001400006. [ Links ]
14. Kim JH, Lee J, Choi IJ, Kim YI, Kim J. Dietary patterns and gastric cancer risk in a Korean population: a case-control study. Eur J Nutr. 2021;60(1):389-97. doi: https://doi.org/10.1007/s00394-020-02253-w. Epub 2020 Apr 29. [ Links ]
15. Karageorgou D, Magriplis E, Mitsopoulou AV, Dimakopoulos I, Bakogianni I, Micha R, et al. Dietary patterns and lifestyle characteristics in adults: results from the Hellenic National Nutrition and Health Survey (HNNHS). Public Health. 2019;171:76-88. doi: https://doi.org/10.1016/j.puhe.2019.03.013. [ Links ]
16. Ministério da Saúde (BR), Secretaria de Atenção à Saúde, Departamento de Atenção Básica. Guia Alimentar para a População Brasileira. 2a ed. Brasília, DF: MS; 2014. 156 p. [ Links ]
17. Sarich P, Canfell K, Banks E, Paige E, Egger S, Joshy G, et al. A prospective study of health conditions related to alcohol consumption cessation among 97,852 drinkers aged 45 and over in Australia. Alcohol Clin Exp Res. 2019;43(4):710-21. doi: https://doi.org/10.1111/acer.13981. [ Links ]
18. Souza-Júnior PRB, Freitas MPS, Antonaci GA, Szwarcwald CL. Desenho da amostra da pesquisa nacional de saúde 2013. Epidemiol Serv Saude. 2015;24(2):207-16. doi: https://doi.org/10.5123/S1679-49742015000200003. [ Links ]
19. Bruce N, Pope D, Stanistreet D. Quantitative methods for health research: a practical interactive guide to epidemiology and Statistics. 2a. ed. Hoboken: John Wiley & Sons; 2018. [ Links ]
20. Secretaria de Vigilância em Saúde (BR). Departamento de Vigilância de Doenças e Agravos não Transmissíveis e Promoção da Saúde. Orientações sobre o uso das bases de dados [Internet]. [Brasília, DF]: MS ; 2019 [acesso 4 maio 2020]. Disponível em: Disponível em: https://www.saude.gov.br/images/pdf/2019/janeiro/10/Orientacoes-sobre-o-uso-das-bases-de-dados.pdf . [ Links ]
21. Ministério da Saúde (BR). Resolução n. 466, de 12 de dezembro de 2012. Aprova as normas regulamentadoras de pesquisas envolvendo seres humanos. Brasília, DF: Diário Oficial da União; 13 jun. 2013. [ Links ]
22. Nagata JM, Palar K, Gooding HC, Garber AK, Bibbins-Domingo K, Weiser S. et al. Food insecurity and chronic disease in us young adults: findings from the national longitudinal study of adolescent to adult health. J Gen Intern Med. 2019;34(12):2756-62. doi: https://doi.org/10.1007/s11606-019-05317-8. [ Links ]
23. Guan Y, Hao Y, Guan Y, Wang H. Effects of Tai Chi on essential hypertension and related risk factors: a meta-analysis of randomized controlled trials. J Rehabil Med. 2020 May 11;52(5):jrm00057. doi: https://doi.org/10.2340/16501977-2683. [ Links ]
24. Cornelissen VA, Smart NA. Exercise training for blood pressure: a systematic review and meta-analysis. J Am Heart Assoc. 2013 Feb. 1;2(1):e004473. doi: https://doi.org/10.1161/JAHA.112.004473. [ Links ]
25. Leng B, Jin Y, Li G, Chen L, Jin N. Socioeconomic status and hypertension: a meta-analysis. J Hypertens. 2015;33(2):221-9. doi: https://doi.org/10.1097/HJH.0000000000000428. [ Links ]
26. Nagata JM, Palar K, Gooding HC, Garber AK, Bibbins-Domingo K, et al. Food Insecurity and Chronic Disease in US Young Adults: Findings from the National Longitudinal Study of Adolescent to Adult Health. J. Gen. Intern. Med. 2019; 34:12. doi: https://doi.org/10.1007/s11606-019-05317-8 [ Links ]
27. Monteiro CN, Lima MG, Szwarcwald CL, Bastos TF, Barros MBA. Utilização de anti-hipertensivos e antidiabéticos no Brasil: análise das diferenças socioeconômicas: pesquisa nacional de saúde 2013. Rev Bras Epidemiol. 2019 Oct. 7:22(Supp 02):E190014. Supl.2. doi: https://doi.org/10.1590/1980-549720190014.supl.2. eCollection 2019. [ Links ]
*Article derived from the Lato Sensu Postgraduate Specialization Final Paper entitled ‘Pattern of food intake markers, sedentary lifestyle and other factors associated with arterial hypertension among Brazilians’, defended by Italo Wesley Oliveira Aguiar at the Lato Sensu Postgraduate Nutrition and Physical Exercise Course/Universidade Estadual do Ceará in 2020.
Received: October 14, 2020; Accepted: February 15, 2021
 Este é um artigo publicado em acesso aberto sob uma licença Creative Commons
