


Serviços Personalizados
Journal

Artigo
 texto em
  Inglês (pdf)
 Artigo em XML
 Referências do artigo
 Curriculum ScienTI
 Enviar este artigo por email
Indicadores
-
 Citado por SciELO
Links relacionados
-
 Similares em
SciELO
Similares em
SciELO
Compartilhar

 Permalink
Epidemiologia e Serviços de Saúde
versão impressa ISSN 1679-4974versão On-line ISSN 2237-9622
Epidemiol. Serv. Saúde vol.30 no.3 Brasília set. 2021 Epub 13-Ago-2021
http://dx.doi.org/10.1590/s1679-49742021000300013
ORIGINAL ARTICLE
Health service utilization and associated factors, among students at the Federal University of Pelotas, Brazil: a cross-sectional study, 2018*
1Universidade Federal de Pelotas, Departamento de Medicina Social, Pelotas, RS, Brazil
2Universidade Federal de Pelotas, Departamento de Enfermagem, Pelotas, RS, Brazil
Methods:
This was a cross-sectional study conducted with a sample of 2,708 students at the Federal University of Pelotas between November 2017 and July 2018.
Results:
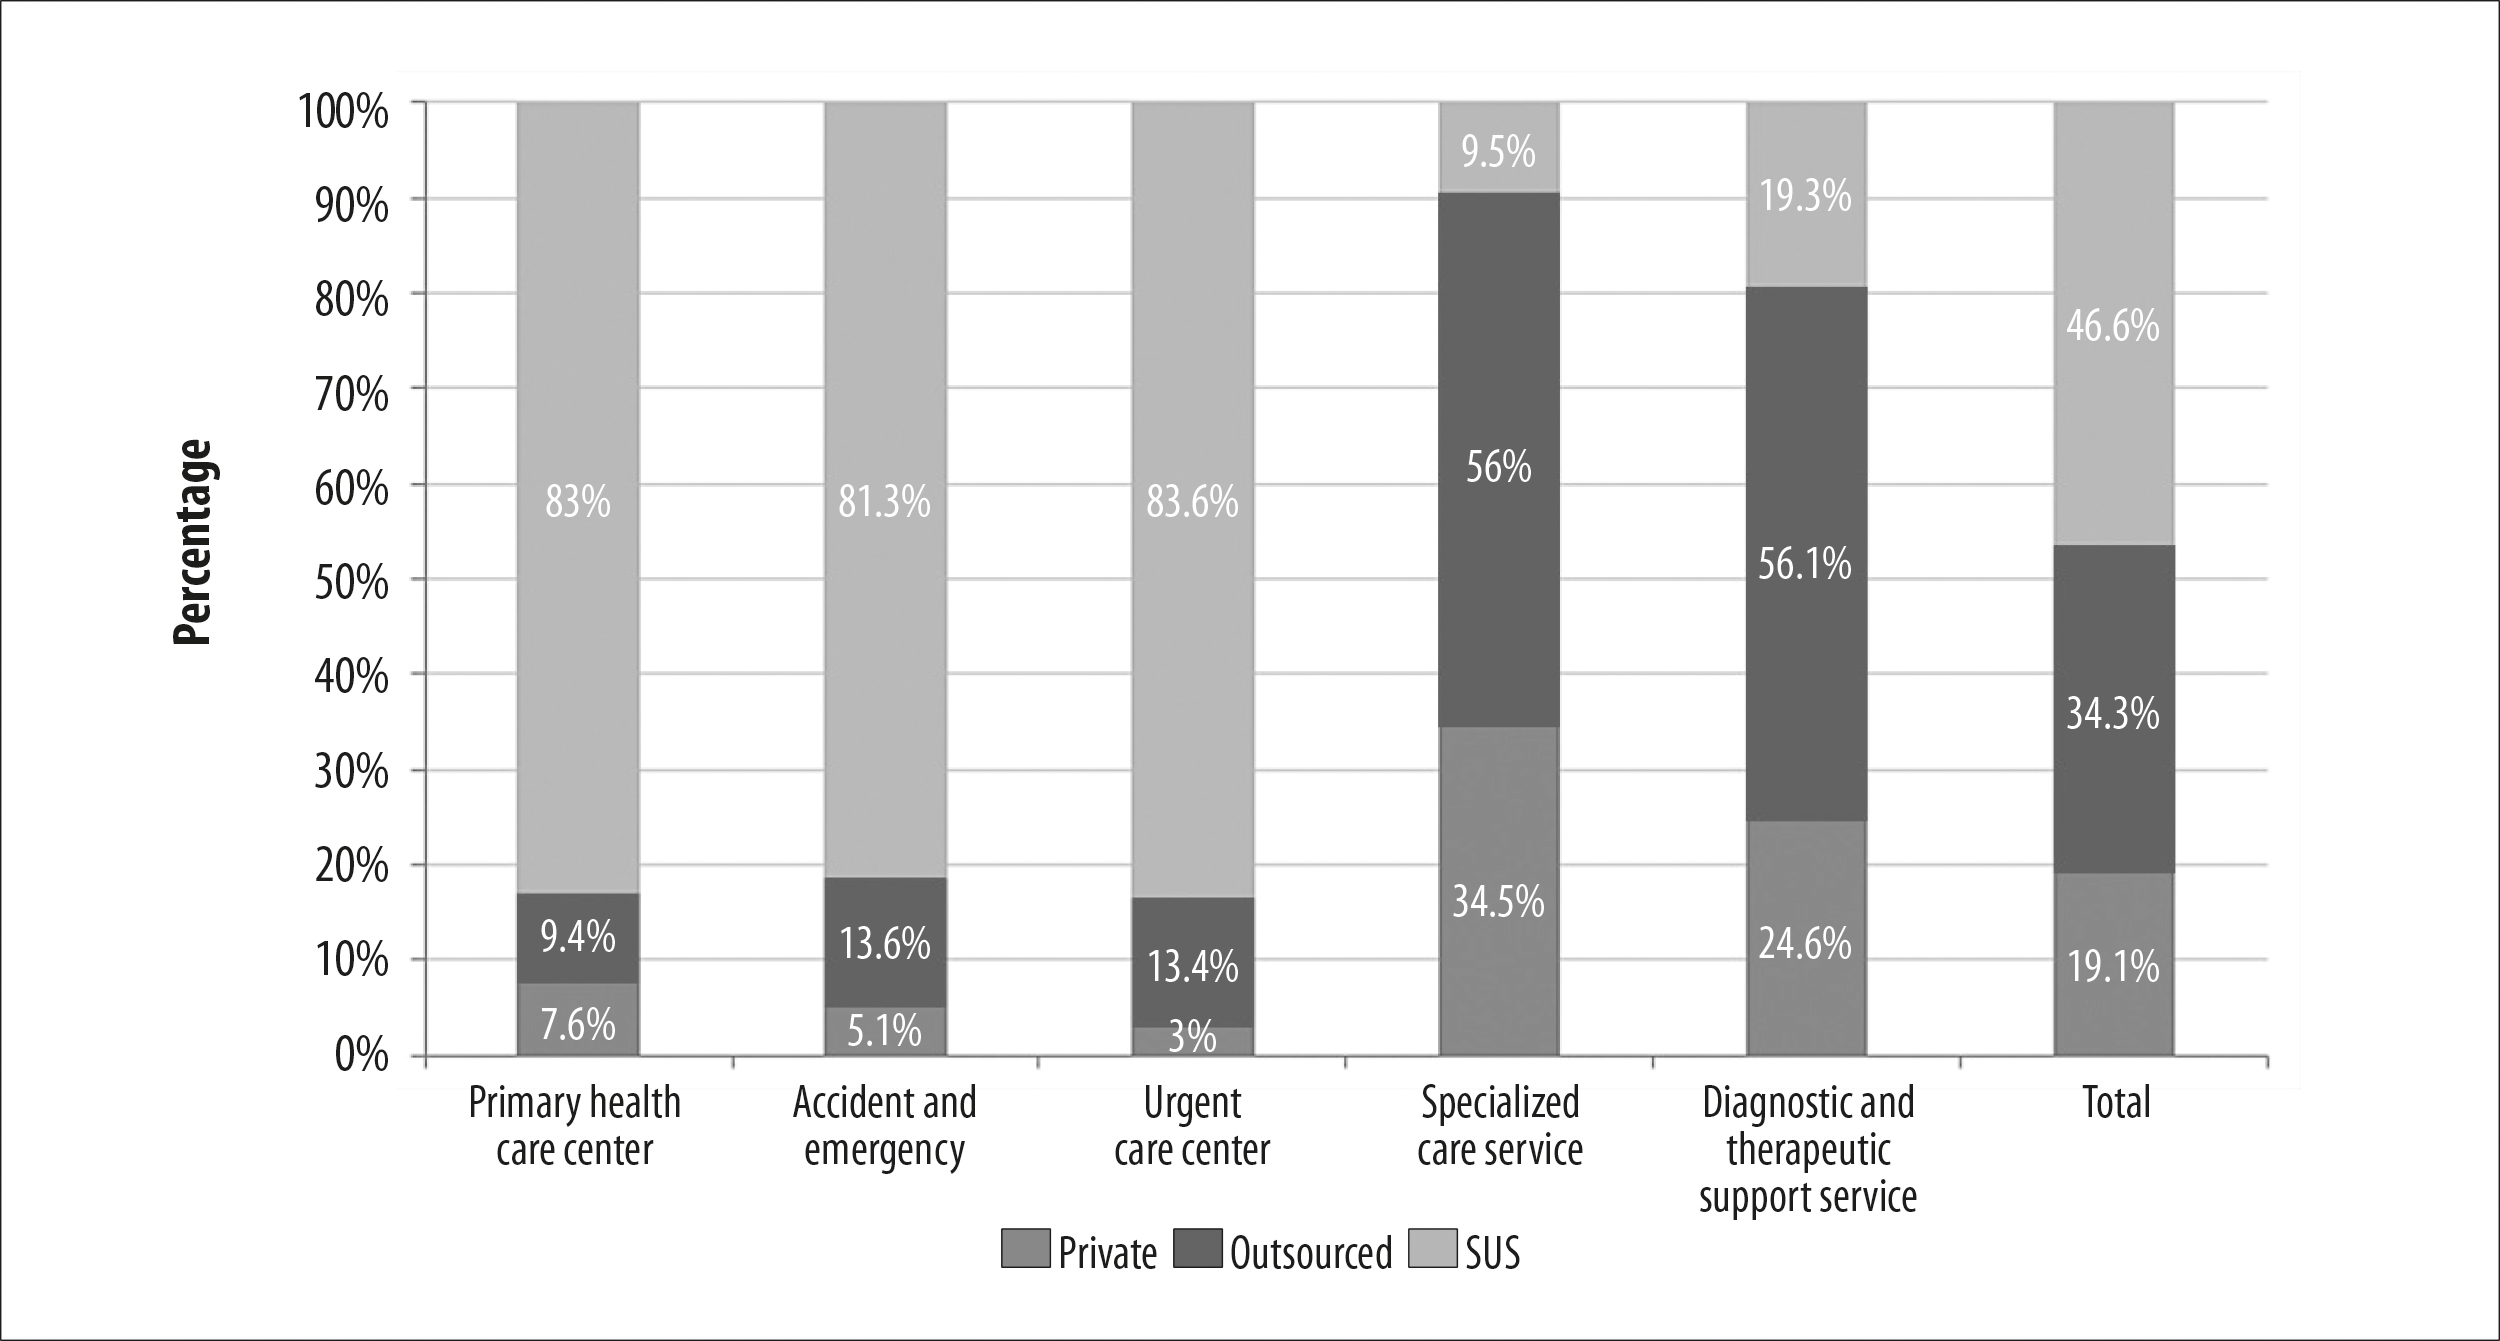
Of the 1,865 individuals included in the study, 55.8% used health services in the last 12 months, 39.3% used specialized services, and 22.6% used health centers; 45.9% used services funded by the Brazilian National Health System (SUS); 49.1% used health services for the purposes of prevention. There was greater use among females (prevalence ratio, PR=1.34 - 95%CI 1.23;1.46) and students with health needs (PR=1.51 - 95%CI 1.40;1.63). Greater association was found with SUS-funded services: primary health care center (83.0% [95%CI 77.3;87.5]), accident and emergency (81.3% [95%CI 73.2;87.5]) and urgent care center (83.6% [95%CI 76.2;89.0]).
Conclusion:
The analysis indicated that women and people with health needs use health services more and that the SUS is the main service provider.
Keywords: Health Services Accessibility; Students; Brazilian National Health System; Health Promotion; Health Services Needs and Demand; Cross-sectional Studies.
Introduction
With effect from the 1988 Constitution, Brazilians have been guaranteed the universal right to public health care through the Brazilian National Health System (SUS). It is estimated that the SUS is the only form of access to health services for over 150 million people and, according to the 2013 National Health Survey, 95% of those who sought a SUS health service received care there.1,2 Comprehensive health care is a right of all people and a duty of the State, from birth on. Most of the population seeks public health care at some point in their lives, from among the various types of health services available.2
Service utilization measurement enables an understanding of access to health care in general. As a positive expression of such access, service utilization measurement can impact the health of populations, preventing diseases from occurring, reducing mortality and increasing survival rates.2 Health service utilization is influenced by a complex combination of factors, ranging from health needs, how services are perceived by service users and health workers, service availability and organization, to type of service funding. In addition, it can also vary according to individual service user characteristics, type of coverage and the service used.3,4
Studies specifically dedicated to the population of young adults between 20 and 40 years old are rare in Brazil, despite the fact that this population requires comprehensive health care with emphasis on preventive actions.5 In this stage of life, young adults tend to be exposed to many different types of behaviors, possibly harmful to their health, such as drug use, poor diet and risk of contracting sexually transmitted infections (STIs).6,7 This is a part of the population for which there are fewer programs and actions in comparison to children and the elderly, who are considered to be more vulnerable.8-10
The objective of this study was to analyze health service utilization and associated factors among students at the Federal University of Pelotas, Rio Grande do Sul, Brazil.
Methods
This was a cross-sectional census-type study, with fresher students at the Federal University of Pelotas (UFPel), located in the municipality of Pelotas, in the first semester of 2017. The study was part of a UFPel Postgraduate Program in Epidemiology research consortium.11
The city of Pelotas has approximately 342 million inhabitants and is located in the south of the state of Rio Grande do Sul, 250 km from its capital, Porto Alegre.12 UFPel offers in-class and online courses, and currently has 16 million students spread over the institution’s six campi: Capão do Leão Campus, Porto Campus, Center Campus, North Campus, Fragata Campus, and Anglo Campus. Eighty of its 96 courses are in-class and enrollment takes place in the second semester of each year.13
All students 18 years old or more who started any of the 80 in-class courses at UFPel in the first semester of 2017 and remained enrolled in the second semester were considered eligible. In order to identify them, we consulted the official lists provided by UFPel's Chancellor’s office to find the disciplines of each course with the highest number of eligible students.
With regard to the variables, the outcome was considered to be health service utilization verified by asking the following question: In the last 12 months, have you used any health service in Pelotas or in any other city?
Health services were taken to be primary health care centers, outpatient clinics, psychosocial care centers, accident and emergency and other urgent care services, consulting rooms, hospitals and diagnostic and therapeutic support services.
With regard to the variables, the number of contacts with health services in the last twelve months, the type of service stated in the definition of the study outcome - and the type of funding of the last health service used (SUS; outsourced to SUS; private) were obtained from those who used health services. In this subgroup, the reasons for using health services were investigated by asking the following question: Why did you use the last health service you attended?
The answer options were categorized as follows: prevention; follow-up; accidents or injuries; psychological problems; and dental problems. The ‘prevention’ category included investigation of problems, vaccination, preventive examination and nutritional guidance; ‘follow-up’ included rehabilitation; and ‘accidents or injuries’ included trauma treatment and having been submitted to surgery.
The independent variables selected were:
origin - where the student lived for most of the previous year before starting at UFPel, (Pelotas; another city in the State of Rio Grande do Sul; another Brazilian state);
sex (male; female);
age (in complete years: 18-20; 21-24; 25 or over);
maternal schooling (incomplete elementary education; complete elementary education; complete high school education; complete higher education; postgraduate education);
race/skin color (white; black; brown; other);
economic classification (for the year 2017, according to the Brazilian Association of Survey Companies [ABEP], adapted for this study: A; B; C; D-E);14
living situation (living alone; living with parents or relatives; living with friends or colleagues; living with spouse or partner or boy/girlfriend; and
health need, determined by the question: In the last 3 months, did you stop doing something you usually do because of health reasons? (no; yes); those who answered ‘yes’, were asked what the main reason was.
A digital questionnaire was prepared for this survey using the Research Electronic Data Capture (REDCap) application,15 answered anonymously on tablets. The instrument was structured in two blocks. The first block consisted of general information related to the undergraduate course and the student's view of the university, demographic and socioeconomic characteristics, religious practice, occupation and social benefits. The second block consisted of questions related to health service utilization. The answers to the questionnaires that were filled in using tablets were transferred to a single database, with automatic checking of the amplitude and consistency of the variables. Fifty-one students opted to fill in printed questionnaires and their answers were input twice to the REDCap application platform in order to include them in the final database.
Data collection took place between November 2017 and July 2018, except for the summer recess in January. Master's degree students were trained to provide a standardized explanation of the study and to conduct the interviews which were held in classrooms. After meeting with the course teaching groups, times were scheduled with the teachers to let students leave their classes for a period of 40 to 50 minutes in order to answer the questionnaire. Prior to this process, a pilot study was carried out with a sub-sample at the same institution to test their understanding of the instrument and its suitability for the target population.
In order to measure prevalence of health service utilization, the sample size was calculated based on 60% prevalence, a 95% confidence level and acceptable error of two percentage points. This required 1,304 individuals for the sample. With regard to analysis of association, we adopted a 5% significance level and 80% statistical power, 8.3% prevalence of the outcome in those who had no health needs, a minimum prevalence ratio of 1.8, and a 1:6 exposure ratio. We added 10% for losses and refusals, resulting in a sample size of 897 individuals to be interviewed.
“Losses” were considered to be students not found during the data collection period, while "refusals" were those who refused to participate in the study after it had been explained in the classroom. To minimize losses and refusals, we made at least three attempts to visit the classes, at different times, until we achieved 70% of respondents. The questionnaire was self-administered in order to ensure the participants' anonymity.
The complete database was exported to the statistical package Stata version 14.2 for the analyses to be performed. We used descriptive analysis to characterize the sample, and crude and multivariable analysis to investigate the associations. A 5% significance level was used in all hypothesis tests. In the descriptive analysis, calculations of proportions and 95% confidence intervals (95%CI) were performed for the categorical variables.
The tests applied in the crude analyses were (i) Pearson's chi-square and (ii) linear trend when suggested. In the multivariate analysis, the 'sex', 'age' and 'health need' variables were adjusted for each other, adopting a 20% significance level. Effect measurements were estimated using Poisson regression with robust variance, which provided adjusted prevalence ratios (PR) and respective 95%CI. In the adjusted analysis, the final model to take confounding variables into account was created from an association matrix, in which all exposure variables were tested with the outcome and also between each other, using a p-value of less than 0.20.
The study project had no conflict of interest and was approved by the Federal University of Pelotas Faculty of Medicine Research Ethics Committee, as per Opinion No. 2.352.451, issued on October 27, 2017 (Certificate of Submission for Ethical Appraisal No. 79250317.0.0000.5317). The questionnaire was only administered with students who agreed to participate in the study and who signed the Informed Consent form.
Results
Out of 2,708 eligible students, 1,865 students who started at UFPel in the first semester of 2017 (69%) were interviewed (Figure 1). Losses and refusals in the survey represented 31.1% of those eligible. Among the total number of respondents (n=1,865), 52.8% were male, aged 23 years and older (46.7%). Regarding the respondents: 45.9% were from Pelotas; 54.8% were female; 56.3% were between 18 and 20 years old; 72.0% reported being of white race/skin color; 44.2% were in economic category B and 36.5% in category C; 32.1% of the students had a mother with complete high school education; 50.4% lived with parents or relatives; and 35.1% reported having perceived some health need that prevented them from performing their usual activities at some point in the last three months (Table 1).
Prevalence of health service utilization in the last 12 months was 55.8% (95%CI 53.5;58.1). In the crude analysis, association was found between the outcome and the 'gender' and 'health need' variables. The probability of female students using health services was 1.34 (95%CI 1.23;1.46), compared to male students; while the probability of students with health needs using them was 1.51 (95%CI 1.40;1.63), compared to those who reported having no health needs (Table 1).
After adjusting for 'age' and 'health needs', health service utilization was higher among females (PR=1.27 - 95%CI 1.16;1.38) than among males. Service utilization by students with health needs was also higher (PR=1.47 - 95%CI 1.36;1.59) compared to those who did not report having health needs, after controlling for 'sex' and 'age' (Table 2).
Among those who did use health services, 40.7% had only one contact over 12 months, and 34.2% had three or more contacts. Using specialized care services (outpatient clinics, consulting rooms, or psychosocial care centers) was mentioned by 39.3% of the students. Regarding the type of funding of the services used by the students, the most recurrent was the SUS (45.9%), while private services were used the least (19.5%). Prevention accounted for almost half the use of the last health service attended (49.1%), followed by health problem follow-up (37.4%) (Table 3).
Analysis of the main reasons for using a service in the last 12 months, according to type of funding (Figure 2), revealed a statistically significant difference. Taking this sub-sample as a whole, the SUS was the most commonly reported type of funding, accounting for 45.9% (95%CI 42.8;49.0). Individuals having follow-up used SUS outsourced services more (41.7% - 95%CI 36.7;46.9), while the private sector had the highest share among those who reported using services for psychological problems (47.8% - 95%CI 33.4;62.6) and dental problems (44.0% - 95%CI 25.2;64.7).
A statistical difference was also found when analyzing the type of service used in the last visit and the type of funding (Figure 3). Again, SUS service coverage was the type of funding most used (45.9% - 95%CI 42.8;49.0). This source of funding accounted for a large share of primary health care center services (39.9% - 95%CI 35.4;44.6), urgent care (25.4% - 95%CI 21.5;29.7), and emergency care (21.8% - 95%CI 18.1;25.9). With regard to use of SUS outsourced services, the highest proportions corresponded to specialized care services (63.6% - 95%CI 58.2;68.7) and diagnostic and therapeutic support services (19.8% - 95%CI 15.8;24.5).
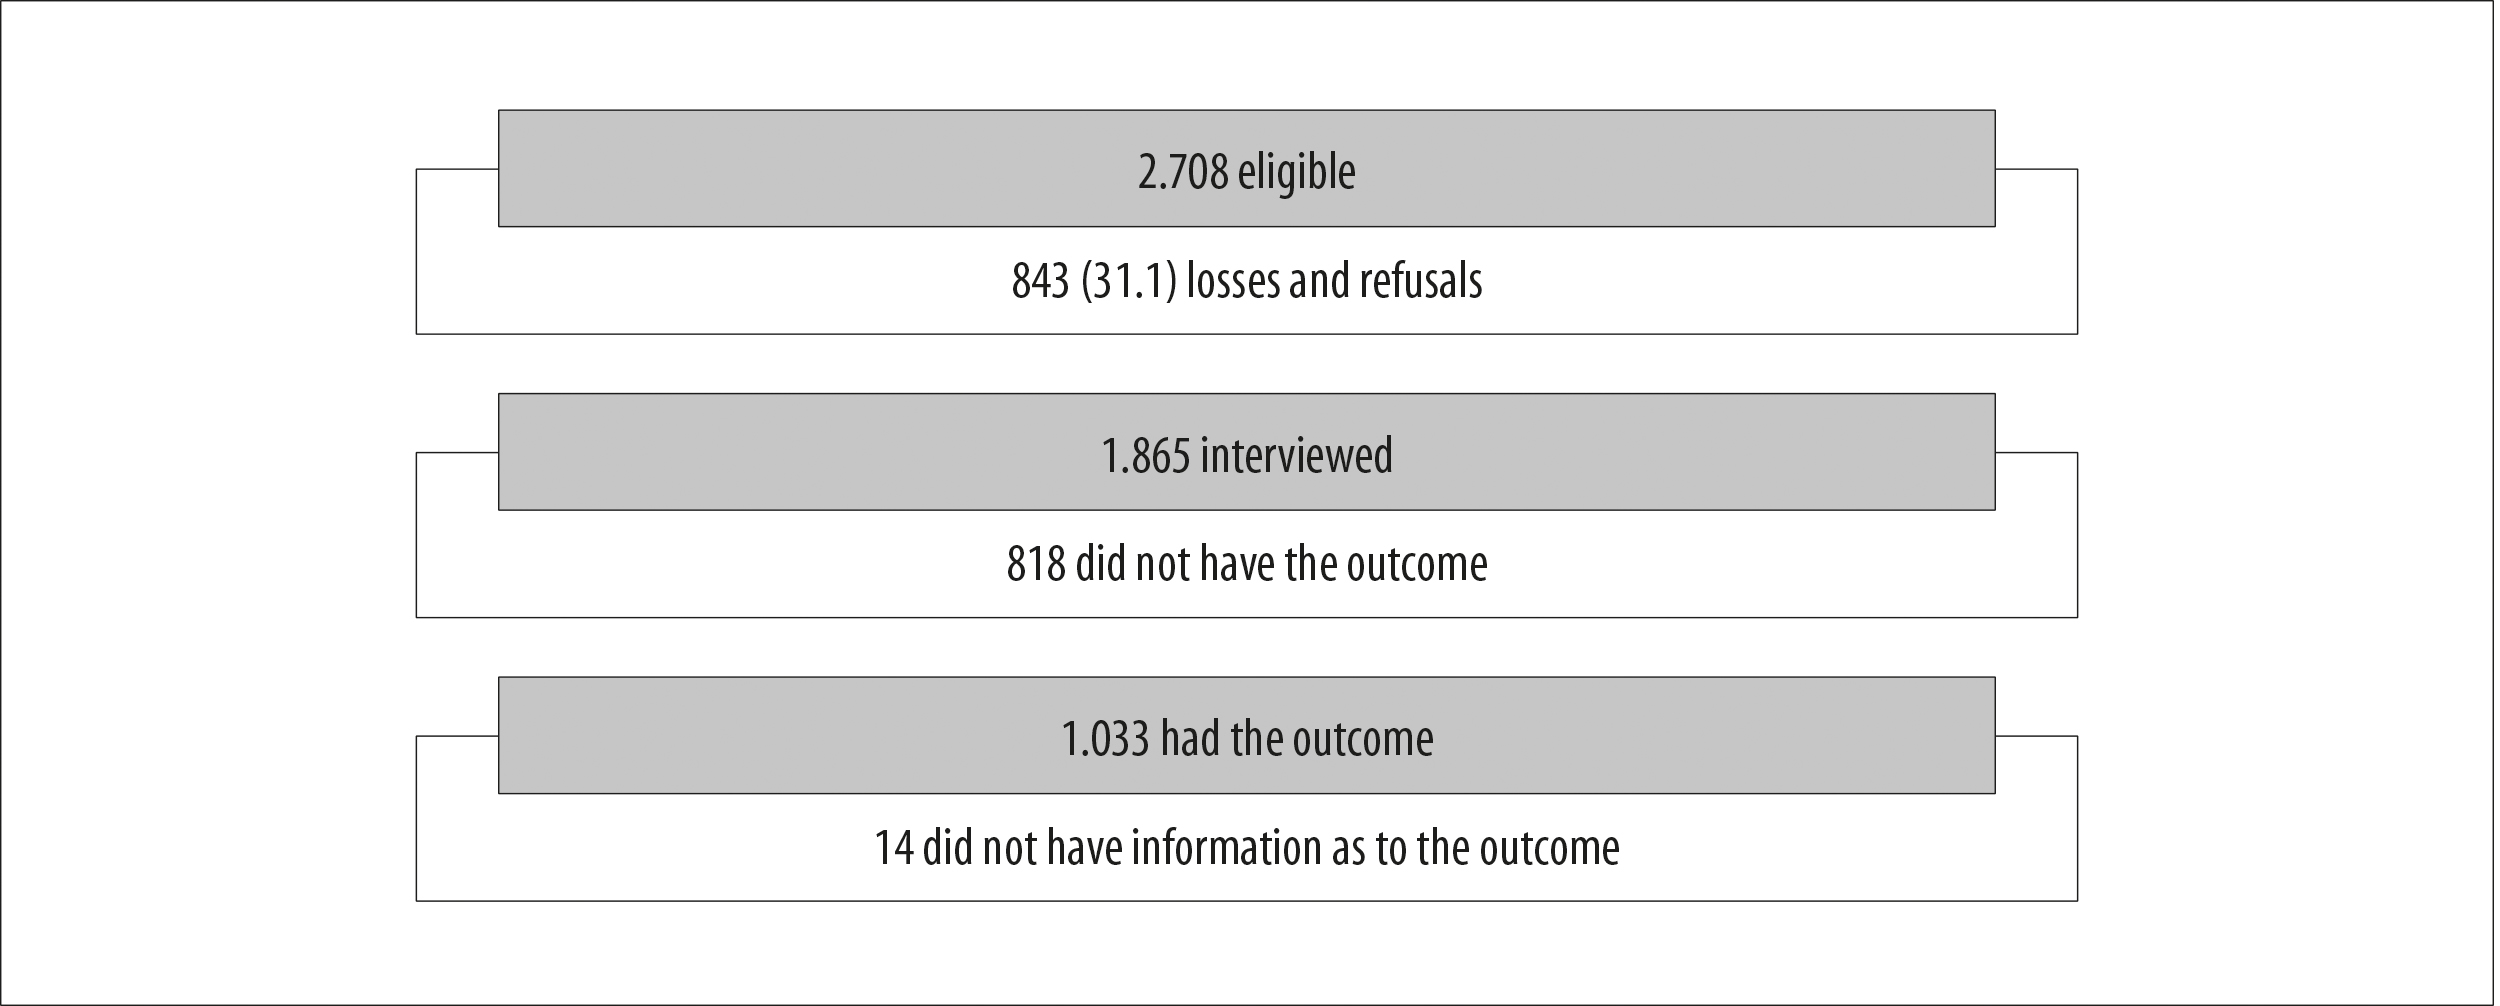
Figure 1 - Process of recruiting university students and inclusion of the sample in the analyses, Pelotas, Rio Grande do Sul, Brazil, 2018
Table 1 - Sociodemographic, health, origin, prevalence and health service utilization characteristics among university students (n=1,865), Pelotas, Rio Grande do Sul, Brazil, 2018
| Participant characteristics | n (%) | Health service utilization (%) | PRa (95%CI)b | p-valuec |
|---|---|---|---|---|
| Origind | 0.897 | |||
| Pelotas | 855 (45.9) | 56.2 | 1.00 | |
| Other city in the State of Rio Grande do Sul | 647 (34.8) | 55.1 | 0.98 (0.89;1.07) | |
| Other Brazilian state | 360 (19.3) | 56.2 | 1.00 (0.90;1.11) | |
| Sexe | <0.001 | |||
| Male | 841 (45.2) | 46.9 | 1.00 | |
| Female | 1,021 (54.8) | 63.0 | 1.34 (1.23;1.46) | |
| Age (years)f | 0.195 | |||
| 18-20 | 1,043 (56.3) | 57.7 | 1.00 | |
| 21-24 | 491 (26.5) | 53.0 | 0.92 (0.83;1.01) | |
| ≥25 | 318 (17.2) | 54.6 | 0.95 (0.85;1.06) | |
| Maternal schoolingg | 0.275 | |||
| Incomplete elementary education | 415 (22.4) | 59.4 | 1.00 | |
| Complete elementary education | 222 (12.0) | 53.0 | 0.89 (0.77;1.03) | |
| Complete high school education | 595 (32.1) | 53.2 | 0.90 (0.80;1.00) | |
| Complete higher education | 410 (22.1) | 56.6 | 0.95 (0.85;1.07) | |
| Postgraduate education | 212 (11.4) | 58.5 | 0.98 (0.86;1.13) | |
| Race/skin colorh | 0.214 | |||
| White | 1,343 (72.0) | 57.2 | 1.00 | |
| Black | 242 (13.0) | 52.3 | 0.91 (0.80;1.04) | |
| Brown | 247 (13.3) | 53.0 | 0.93 (0.82;1.05) | |
| Other | 31 (1.7) | 45.2 | 0.79 (0.53;1.17) | |
| Economic classificationi | 0.536 | |||
| A | 266 (14.9) | 59.8 | 1.00 | |
| B | 787 (44.2) | 54.7 | 0.92 (0.81;1.03) | |
| C | 649 (36.5) | 55.5 | 0.93 (0.82;1.05) | |
| D-E | 78 (4.4) | 57.7 | 0.96 (0.78;1.20) | |
| Living situationj | 0.524 | |||
| Living alone | 234 (12.6) | 54.7 | 1.00 | |
| Living with parents or relatives | 937 (50.4) | 54.4 | 0.99 (0.87;1.13) | |
| Living with friends or colleagues | 480 (25.8) | 57.4 | 1.05 (0.91;1.21) | |
| Living with spouse or partner or boy/girlfriend | 210 (11.3) | 58.9 | 1.08 (0.91;1.27) | |
| Health needk | <0.001 | |||
| No | 1,202 (64.9) | 47.3 | 1.00 | |
| Yes | 650 (35.1) | 71.4 | 1.51 (1.40;1.63) | |
| Total | 1,865 (100.0) | 55.8 |
a) PR: prevalence ratio; b) 95%CI: 95% confidence interval; c) Pearson’s chi-square test; d) 1,852 with valid information;13 did not reply; e) 1,862 with valid information;3 did not reply; f) 1,863 with valid information; 2 did not reply; g) 1,780 with valid information; 85 did not reply; h) 1,861 with valid information; 4 did not reply; i) 1,852 with valid information; 13 did not reply.
Table 2 - Adjusted analysisa between health service utilization and sociodemographic and health need variables (n=1,834), Pelotas, Rio Grande do Sul, Brazil, 2018
| Variable | PRb (95%CI)c | p-valued |
|---|---|---|
| Sex | <0.001 | |
| Male | 1.00 | |
| Female | 1.27 (1.16;1.38) | |
| Age (years) | 0.106 | |
| 18-20 | 1.00 | |
| 21-24 | 0.90 (0.82;0.99) | |
| ≥25 | 0.96 (0.86;1.08) | |
| Health need | <0.001 | |
| No | 1.00 | |
| Yes | 1.47 (1.36;1.59) |
a) Analysis based on hierarchical model; b) PR: prevalence ratio; c) 95%CI: 95% confidence interval; d) Poisson regression: heterogeneity test.
Table 3 - Distribution of number of contacts, type of service used, type of funding and reason for health service utilization among university students (n=1,033), Pelotas, Rio Grande do Sul, Brazil, 2018
| Variable | n | % | |
|---|---|---|---|
| Number of contactsa | |||
| 1 | 412 | 40.7 | |
| 2 | 254 | 25.1 | |
| 3-11 | 346 | 34.2 | |
| Services usedb | |||
| Specialized care | 383 | 39.3 | |
| Primary health care center | 220 | 22.6 | |
| Urgent care center | 134 | 13.8 | |
| Accident and emergency | 122 | 12.5 | |
| Diagnostic and therapeutic support service | 115 | 11.8 | |
| Type of fundingc | |||
| Brazilian National Health System | 456 | 45.9 | |
| Outsourced to SUS | 344 | 34.6 | |
| Private | 194 | 19.5 | |
| Reasonsd | |||
| Prevention | 491 | 49.1 | |
| Follow-up | 374 | 37.4 | |
| Accidents or injuries | 62 | 6.2 | |
| Psychological problems | 48 | 4.8 | |
| Dental problems | 25 | 2.5 | |
a) 1,012 with valid information; 21 did not reply; b) 974 with valid information; 59 did not reply; c) 994 with valid information; 39 did not reply; d) 1,000 with valid information; 33 did not reply.
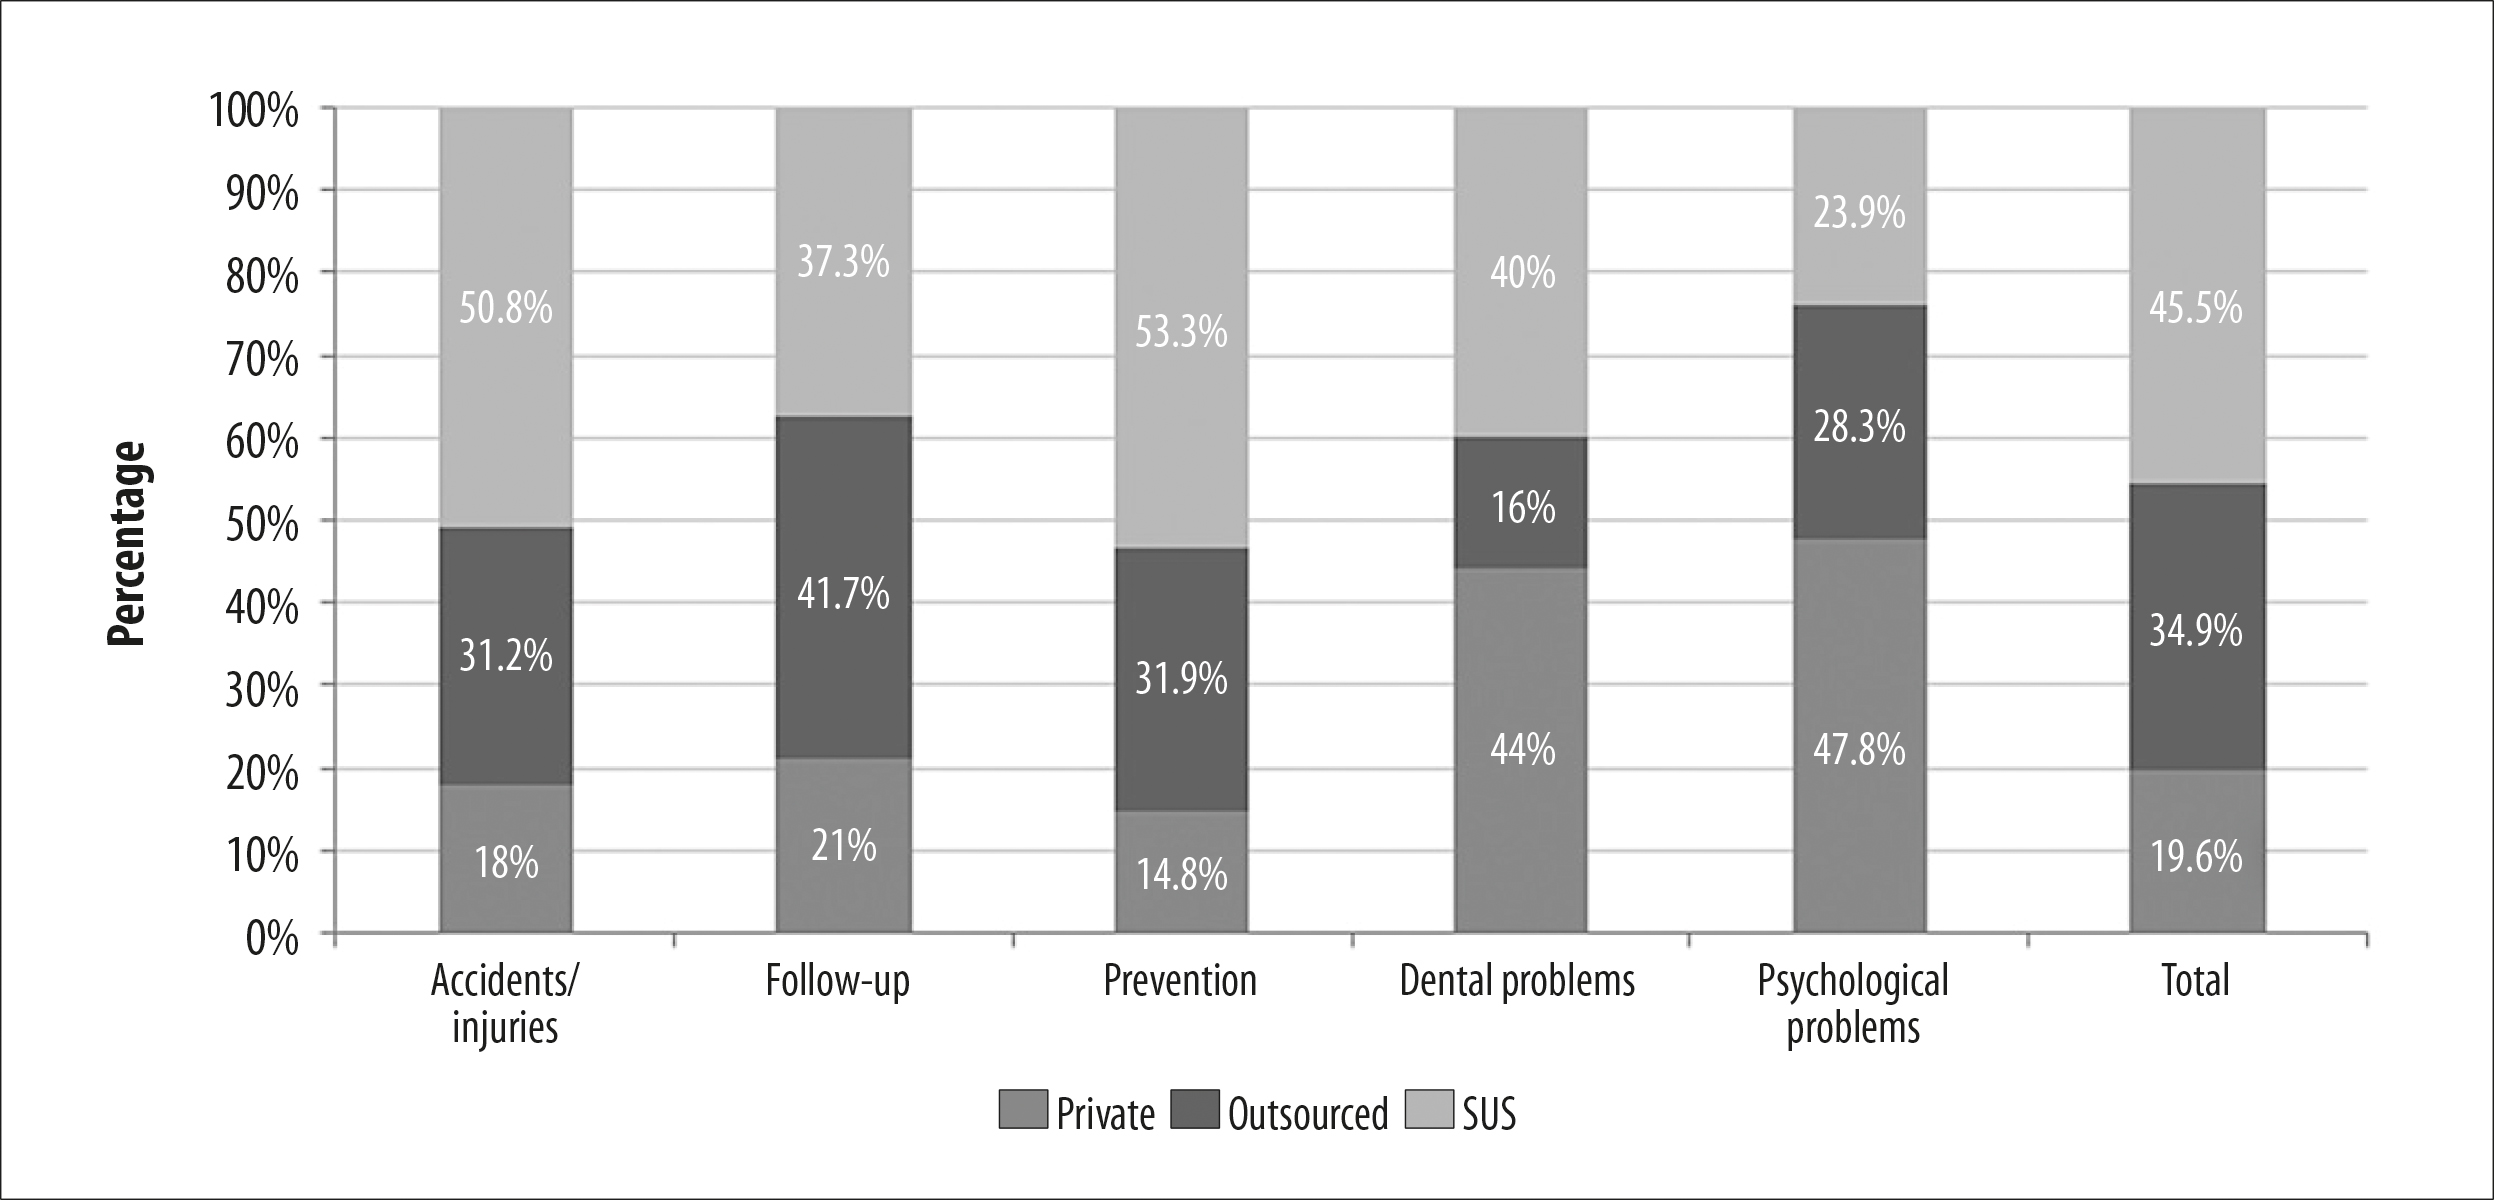
Figure 2 - Reasons for health service utilization according to funding type (n=1,000), Pelotas, Rio Grande do Sul, Brazil, 2018
Discussion
This study found that slightly more than half of the UFPel undergraduate students interviewed had used health services in the last 12 months. Their demand for health services was therefore frequent. In comparison to males, females used these services more. With regard to greater demand among people with health needs, it is possible to assume that they mainly used prevention services. This conclusion is reinforced by the fact that approximately one in two students reported using health services for preventive reasons. The SUS was the most reported funding type among the university students who used health services.
The study had a high proportion of losses, and it is possible that these students could have greater health needs and therefore have greater demand for health services. Their health needs may be why the frequency of their class attendance was lower, resulting in their being lost to the study. In this sense, the frequency of university students surveyed during classes may not fully reflect the demand and profile of health service utilization by this target population of young adults (selection bias). Another limitation of the study lies in the self-administered questionnaire interview format, as the answers to the questions are anonymous and are therefore likely to induce analyses and conclusions influenced by response bias. We encountered difficulties in precisely composing the response categories depending on the 12-month recall period, in addition to the possibility of misunderstanding by interviewees - even after a pilot study - leading to possible measurement problems. Nevertheless, the format of some of the categories was maintained, with the aim of their being able to be compared with other studies.
Health service utilization was lower than that found by a study conducted in 2011, also in Pelotas, with young adults from the 1982 birth cohort, among whom there was 72% prevalence of health service appointments.8 In turn, the 2013 National Health Survey found prevalence close to 11% for seeking and using health services in the two weeks prior to the interview.1 One of the reasons for this difference in the prevalence rate we found and the prevalence rate found by the 2013 National Health Survey lies in the recall periods being of different length. In addition, according to data from the 2009 National Household Sample Survey, in the Brazil there are considerable differences in access to higher education depending on family income: only around 5% of the poorest go to university compared to 60% of the wealthiest.16 This reality may explain the health service utilization profile found in our sample.
Two out of five university students at UFPel used at least one health service in the last tewleve months, while a study conducted at the University of Pretoria, South Africa, in 2007, found average prevalence of 12.5% of health service use by the university population at that South African institution over five years.17 These results indicate that young adults, not only in Brazil, rarely seek and use health services, even though they represent a key opportunity for education and adoption - or maintenance - of healthy lifestyles, provided by qualified multiprofessional care. Even when it comes to the use of any type of health service and not only primary health care centers, this finding is in agreement with that found by the second edition of the 2012 National School Health Survey: in Brazilian state capitals, 52.9% of students used a primary health care center only once or twice in the last twelve months.18
Among the sociodemographic and health factors investigated, the person’s sex and health needs were associated with health service utilization. Regarding sex, a study conducted in 2011 in Brazil showed that women have been standing out as the main service users.3,8-10 In our survey in Pelotas, aside from exclusively female gynecological and reproductive reasons - investigation or screening for cervical cancer and human papillomavirus infection - and prenatal, labor and puerperium follow-up, women reported having more health needs. They also reported greater utilization of services related to mental health problems compared to men, possibly due to their greater ease in perceiving and expressing their emotional difficulties. Compared to women, men accounted for highest health service utilization due to accidents and injuries. A parallel can be drawn here with deaths from external causes in Brazil: according to Ministry of Health data for the period from 1996 to 2018, deaths from external causes are, on average, 4.9 times higher among males when compared to females.19
Approximately two out of five university students used specialized services, and for about a quarter of them the primary health care center was where they last received care in the 12 months prior to the survey. The relationship between this finding and another variable - the use of prevention services, the most prevalent reason - may explain this demand for specialized care. According to the study conducted by Dias-da-Costa et al., the main reason for the use of health services by young adults was the presence of diseases, although the authors did not collect data on the use of preventive services.8 Another study conducted in Pelotas, this time in 2012 with an adolescent population, found prevalence of consulting room and primary health care center use similar to that found in our study.10 These results suggest that university students use primary and secondary health care services more.
The findings of this study are in agreement with those of other studies, revealing the SUS as the main source of health service funding, followed by outsourced Supplementary Health services.3,8,10 After investigating association between type of funding and the 'services used' and 'reason' variables for most recent use of a health service, the SUS was found to have a greater share in the results of both analyses. Even with the precariousness and underfunding of public health services, these were still the main providers of primary health care, as the entry point to the SUS.20 The differences found in the type or nature of funding of the service used can be attributed to the profile of service supply. Private services are more focused on health problems, while outsourced services are more focused on general consultations in certain specialties.
The SUS provides health care that ranges from preventive measures to more complex services, based on comprehensive care, including between different levels of service complexity, despite it being recognized that there are problems in accessing the system at the regional and/or local level.
Use of Public Health services is higher not only among young adults. The 2012 study with adolescents in the city of Pelotas found a prevalence rate of 52.1% for SUS service utilization.10 Another study conducted in Brazil in 2014, with residents in the urban area of municipalities in the five major Brazilian regions, identified that 53.6% of individuals seen by physicians in the last three months used services funded by the SUS.21
We conclude that this research, carried out with a population of students from the UFPel identified health service utilization associated with females and people with health needs. The majority of those who used these services in the last twelve months mentioned having sought health care for preventive reasons, mostly specialized care services, funded by the Brazilian National Health System. It is therefore important to adopt specific strategies and actions for disease prevention among the population of university students.
REFERENCES
1. Instituto Brasileiro de Geografia e Estatística. Pesquisa nacional de saúde 2013: acesso e utilização dos serviços de saúde, acidentes e violências: Brasil, grandes regiões e unidades da federação [Internet]. Rio de Janeiro: IBGE; 2015 [acesso17 nov. 2018]. Disponível em: Disponível em: https://biblioteca.ibge.gov.br/visualizacao/livros/liv94074.pdf [ Links ]
2. Ministério da Saúde (BR). SUS: a saúde do Brasil [Internet]. Brasília, DF; MS; 2011 [acesso 17 nov. 2018]. Disponível em: Disponível em: http://bvsms.saude.gov.br/bvs/publicacoes/sus_saude_brasil_3ed.pdf [ Links ]
3. Silva ZP, Ribeiro MCSA, Barata RB, Almeida MF. Perfil sociodemográfico e padrão de utilização dos serviços de saúde do sistema único de saúde (SUS), 2003-2008. Cien Saude Colet. 2011;16(9):3807-16. doi: http://doi.org/10.1590/S1413-81232011001000016. [ Links ]
4. Travassos C, Martins M. Uma revisão sobre os conceitos de acesso e utilização de serviços de saúde. Cad Saude Publica. 2004;20(suppl. 2):S190-S198. doi: http://doi.org/10.1590/S0102-322X2004000800014. [ Links ]
5. Linhares MBM. Ciclo vital II: adolescente, adulto e idoso [Internet]. [São Paulo]: Departamento de Neurociências e Ciências do Comportamento 21; 2017 [acesso 20 dez. 2018]. Disponível em: Disponível em: https://edisciplinas.usp.br/pluginfile.php/3997540/mod_resource/content/1/Aula 4 O Ciclo Vital Adolescente Adulto Idoso 2017.pdf [ Links ]
6. Currie C, Ziglio E, Barnekow V, Negru L. Inequalities in young people’s health: Key findings 2005/2006 survey. Copenhagen: Health Policy for Children and Adolescents; 2008. [ Links ]
7. Sawyer SM, Afifi RA, Bearinger LH, Blakemore SJ, Dick B, Ezeh AC, et al. Adolescence: a foundation for future health. Lancet. 2012 Apr 28;379(9826):1630-40. doi: http://doi.org/10.1016/S0140-6736(12)60072-5. [ Links ]
8. Dias-da-Costa JS, Gigante DP, Horta BL, Barros FC, Victora CG. Utilização de serviços de saúde por adultos da coorte de nascimentos de 1982 a 2004-5, Pelotas, RS. Rev Saude Publica. 2008;42(suppl. 2):51-9. doi: http://dx.doi.org/10.15090/S0034-89102008000900008. [ Links ]
9. Palazzo LS, Béria JU, Tomasi E. Adolescentes que utilizan servicios de atención primaria: ¿Cómo viven? ¿Por qué buscan ayuda y cómo se expresan? Cad Saude Publica. 2003;19(6):1655-65. doi: http://dx.doi.org/10.1590/S0102-311X2003000600010. [ Links ]
10. Nunes BP, Flores TR, Duro SMS, Saes MO, Tomasi E, Santiago AD, et al. Utilização dos serviços de saúde por adolescentes: estudo transversal de base populacional, Pelotas-RS, 2012. Epidemiol Serv Saude. 2015;24(3):420-11. doi: http://dx.doi.org/10.5123/S1679-49742015000300007. [ Links ]
11. Barros AJD, Menezes AMB, Santos IS, Assunção MC, Gigante D, Fassa AG, et al. O Mestrado do programa de pós-graduação em epidemiologia da UFPel baseado em consórcio de pesquisa: uma experiência inovadora. Rev Bras Epidemiol. 2008;11(suppl. 1):133-44. doi: http://dx.doi.org/10.1590/S1415-790X2008000500014. [ Links ]
12. Instituto Brasileiro de Geografia e Estatística. Panorama das cidades brasileiras [Internet].. [Rio de Janeiro]: IBGE; 2018 [acesso 11 set. 2018]. Disponível em: Disponível em: https://cidades.ibge.gov.br/brasil/rs/pelotas/panorama [ Links ]
13. Universidade Federal de Pelotas. Institucional: histórico [Internet]. [Pelotas]: UFPEL; c2021 [acesso 23 jan. 2021]. Disponível em: Disponível em: https://portal.ufpel.edu.br/historico/ [ Links ]
14. Associação Brasileira de Empresas de Pesquisa. Critério de classificação econômica Brasil [Internet]. São Paulo: ABEP; 2017 [acesso 23 jan. 2021]. Disponível em: Disponível em: http://www.abep.org/criterio-brasil [ Links ]
15. National Institutes of Health. Research Electronic Data Capture: REDCap. [software]. [local desconhecido: REDCap; 2004 [acesso 5 set. 2017]. Disponível em: Disponível em: https://projectredcap.org/software/ [ Links ]
16. Instituto Brasileiro de Geografia e Estatística. Pesquisa nacional por amostra de domicílios: síntese de indicadores [Internet]. Rio de Janeiro: IBGE; 2009 [acesso 23 abr. 2018]; Disponível em: Disponível em: https://biblioteca.ibge.gov.br/visualizacao/livros/liv45767.pdf [ Links ]
17. van Papendorp HD, Coetzee M, Koorts AM. The student health services at the University of Pretoria from 2000 to 2005. Health SA. 2007;12(1):48-54. doi: http://doi.org/10.4102/hsag.v12i1.243. [ Links ]
18. Oliveira MM, Andrade SSCA, Campos MO, Malta DC. Fatores associados à procura de serviços de saúde entre escolares brasileiros: uma análise da Pesquisa Nacional de Saúde do Escolar (PeNSE), 2012. Cad Saude Publica. 2015;31(8):, 1603-14. doi: http://doi.org/10.1590/0102-311X00165214. [ Links ]
19. Ministério da Saúde (BR). Óbitos por causas externas [Internet]. Brasília, DF: MS; 2019 [acesso 25 aog. 2019]. Disponível em: Disponível em: http://tabnet.datasus.gov.br/cgi/tabcgi.exe?sim/cnv/ext10uf.def [ Links ]
20. Reis AAC, Sóter APM, Furtado LAC, Pereira SSS. Tudo a temer: financiamento, relação público e privado e o futuro do SUS. Saude Debate. 2016;40:122-35. doi: http://doi.org/10.1590/0103-11042016S11. [ Links ]
21. Dilélio AS, Tomasi E, Thumé E, Silveira DS, Siqueira FCV, Piccini RX, et al. Padrões de utilização de atendimento médico-ambulatorial no Brasil entre usuários do Sistema Único de Saúde, da saúde suplementar e de serviços privados. Cad Saude Publica. 2014;30(12):2594-606. doi: http://doi.org/10.1590/0102-311X00118713. [ Links ]
*Articles derived from the Master’s Degree dissertation entitled ‘Health service utilization by fresher students at a federal university in Southern Brazil’, defended by Bruno Iorio Könsgen at the Universidade Federal de Pelotas Postgraduate Program in Epidemiology, on December 13th 2018. The study received funding from the Academic Excellence Program/Coordination for the Improvement of Higher Education Personnel/Ministry of Education - File No. 0185/2017/23038.000288/2014-47.
Received: October 20, 2020; Accepted: February 22, 2021
 Este é um artigo publicado em acesso aberto sob uma licença Creative Commons
