


Servicios Personalizados
Revista

Articulo
 texto en
  Inglés (pdf)
 Articulo en XML
 Referencias del artículo
 Enviar articulo por email
Indicadores
-
 Citado por SciELO
Links relacionados
-
 Similares en
SciELO
Similares en
SciELO
Compartir

 Permalink
Epidemiologia e Serviços de Saúde
versión impresa ISSN 1679-4974versión On-line ISSN 2237-9622
Epidemiol. Serv. Saúde vol.30 no.4 Brasília dic. 2021 Epub 22-Oct-2021
http://dx.doi.org/10.1590/s1679-49742021000400004
Original Article
Restructuring of emergency services to COVID-19 in Brazil: a space-time analysis from February to August 2020
1 Organização Pan-Americana da Saúde/Organização Mundial da Saúde, Unidade Técnica de Vigilância, Brasília, DF, Brazil.
2 Organização Pan-Americana da Saúde/Organização Mundial da Saúde, Gabinete da Representante Adjunta, Brasília, DF, Brazil.
Methods
We conducted an ecological, descriptive-exploratory study with analysis of spatio-temporal clusters by epidemiological week in Brazilian municipalities. Secondary data sources were used, from the National Health Establishment Registry (April 2020) and on COVID-19 cases, February to August 2020. Intensive Care Units (ICU) availability was overlaid on incidence and mortality hot spots in order to assess expanded access in critical regions.
Results
Of the 5,570 municipalities analyzed, 54% were identified as incidence hot spots and 31% as mortality hot spots. Of the municipalities in incidence hot spots and with scarce access, 28% were covered by ICU expansion, while with regard to mortality 14% were covered.
Conclusion
The opening of new beds was not able to provide broad coverage for critical regions and could be optimized with the use of spatial analysis techniques.
Keywords: Ecological Studies; Geographic Information Systems; Barriers to Access of Health Services; Effective Access to Health Services; Coronavirus Infections; Intensive Care Units
Introduction
COVID-191,2 was reported for the first time in China, on December 31st 2019. It spread rapidly and soon afterwards was declared to be a pandemic by the World Health Organization (WHO).3 Globally, over 11 million people contracted COVID-19, resulting in 500,000 deaths due to the disease by August 28th 2020. Brazil is in second place among the most affected countries,4 accounting for 3,761,391 cases and 118,649 deaths also as at 28/08/2020.5 COVID-19 has already affected all the Brazilian Federal Units and 99% of Brazilian municipalities had notified at least one case by August 2020.6 It is estimated that between 13% and 24% of cases progress to the more severe form of the disease, with acute respiratory failure.7 Other estimates indicate that 19% (95% confidence interval: 95%CI 13%;26%) of individuals with COVID-19 need to be hospitalized in intensive care units (ICU), and that 9% (95%CI 6%;13%) need lung ventilators.8
In order to structure a timely response to COVID-19, a critical element to consider is understanding where cases and deaths are concentrated. The emergence of clusters of COVID-19 cases and the dynamics of increases and decreases in these cases must be monitored so that timely interventions can be conducted. Analyses of spatio-temporal clusters are useful9 for identifying significant clusters of cases and deaths and for performing trend analyses.10-12
In turn, analysis of spatio-temporal clusters using the emerging hot spot approach enables identification of trends to be shared by neighbors in time and space, creating conditions for the generation of useful insights for the evidence-based decisions.13 Despite being used in several different areas, such as Traffic Engineering14 and Veterinary Medicine,15 this tool is still little explored by Epidemiology.16
The objective of this study was to explore possibilities of reorganizing the health system with regard to tertiary care for COVID-19, by means of an approach based on spatio-temporal clusters, considering the epidemiological situation of the disease in Brazil and the possible benefits obtained by using emerging hot spot analysis.
Methods
This is a longitudinal ecological study based on a spatio-temporal approach using secondary data.17
Three secondary data sources taken from public administration databases were used for the analysis of the urgency and emergency care network regarding COVID-19. As such, it was not necessary to submit the study project to a Research Ethics Committee for approval.
The first database used was the COVID-19 case record database released by the Brazilian Ministry of Health.5 This database contained the historical record of confirmed COVID-19 cases, as well as reported deaths, right from the confirmation of the first case in Brazil on February 26, 2020 until August 27, 2020, this being the period selected by the researchers. For the purposes of analysis, the number of confirmed new cases per day was used.
The second database contained the municipal population projections for the year 2019. Information was retrieved from this source on the total number of inhabitants in each of the country’s 5,570 municipalities.
The third and final database used was the National Health Establishment Registry. The information retrieved from the Registry allowed us to characterize ICU beds in Brazil, both regular ICU beds and those dedicated exclusively to people with COVID-19. Moreover, this database enabled geolocalization of all registered health care facilities. The data on beds related to April 2020.
The study’s unit of analysis consisted of each of the 5,570 Brazilian municipalities. To evaluate the adequacy of the efforts to reorganize the Brazilian National Health System (SUS) in relation to COVID-19, three analytical steps were structured. First, we investigated spatial-temporal clustering patterns, by epidemiological week, of COVID-19 incidence in Brazil, using emerging hot spot analysis. In parallel, we assessed the degree of accessibility to hospital ICU beds in Brazil in the period before the pandemic, as well as the access patterns to new ICU beds introduced to respond to COVID-19. The data from the clustering process and the characterization of ICU bed accessibility were compared in order to identify care gaps in regions with COVID-19 incidence and mortality above the national medians. In this way, it was possible to identify regions with care gaps and high volumes of cases and deaths, weighted by population. Once these regions had been identified, the accessibility index for new ICU beds for COVID-19 was overlaid spatially, with the purpose of identifying priority regions for efforts to reorganize the urgency and emergency network, regarding emergency service coverage of health care gaps.
Step one
Spatio-temporal Clustering Analysis
COVID-19 incidence and mortality rates were calculated for each Brazilian municipality, by epidemiological week, up until August 27, 2020. Each week, new cases and deaths were grouped and divided by the estimated population. The indicators obtained from this calculation were submitted to ARCGIS PRO 2.5 emerging hot spot analysis. The spatio-temporal cluster analysis sought to identify clusters of municipalities with a pattern of COVID-19 incidence and mortality that was maximally homogeneous, with respect to their intra-group characteristics, and minimally homogeneous, with respect to comparison with the other clusters. Emerging hot spot analysis is based on a space-time cube with a three-dimensional structure, in which each layer of the Z axis represents a point in time, and the X and Y axes represent distribution in space. In this study, the municipalities were distributed on the X and Y axes, while the incidence and mortality indicator data, per epidemiological week, were distributed on the Z axis. Thus, the technique scans the three axes, seeking groupings that are statistically significant, so as to allow the characterization of up to 16 different types of clusters18 eight clusters indicating different warming patterns, over time; and eight indicating cooling trends.19 The analysis was performed twice, once for COVID-19 incidence and once for COVID-19 mortality. Thus, municipalities identified in clusters with a warming trend indicate an increase in magnitude, observed in the indicators analyzed over the epidemiological weeks. The opposite trend can be observed in municipalities categorized in the cooling spectrum.
Step two
Analysis of ICU bed accessibility
The two-step floating catchment area (2SFCA)19,20 technique was applied in order to calculate the ICU bed accessibility index. This technique enables an index to be created, weighted by population, which characterizes each municipality analyzed in terms of ICU bed availability per inhabitant. The capacity index for each hospital (according to the first step) was calculated based on data of the entire resident population up to 120 kilometers away from hospitals with ICU beds. The number of beds in e population residing in these areas ach hospital was divided by the captured population and thus, a measurement of bed capacity per inhabitant was assigned to each hospital. This second step captures all hospitals - and their respective capacity indices - that are within 120 kilometers of the centroid of a Brazilian municipality. The capacity indices of each hospital within the 120-kilometer buffer for each municipality were added together. In this way, it was possible to obtain the accessibility index, which reflects the number of ICU beds weighted by available population within 120 kilometers of the centroid of the municipality in question. A higher index means greater availability of ICU beds per population. The 120-kilometer limit was adopted based on the recommendations of a Lancet commission regarding surgical safety and access to emergency services. The accessibility analysis was performed twice: the first time for structure of regular ICU beds existing in the Brazil in February 2020; and the second time for ICU beds dedicated exclusively to individuals with COVID-19 that had been made available as at May 1, 2020.
Step three
Spatial overlay analysis for the identification of care gaps and hierarchization of efforts to reorganize emergency and urgency services
The third step involved spatial overlaying of the results obtained in the two previous steps. We therefore selected those municipalities classified as hot spots in the spatial clustering analysis. Once the municipalities had been selected, according to the spatial-temporal clustering patterns described above, a spatial overlay analysis was performed. This analysis selected the intersection between the municipalities the ICU bed accessibility index of which was below the national median (0.000204/inhab.) and those municipalities selected based on the hot criteria in the spatio-temporal cluster analysis. All municipalities selected up to this point reflected those places with high COVID-19 incidence and mortality patterns constant in space-time, concomitantly with low or no availability of ICU beds within a distance of 120km. The accessibility indices for ICU beds available exclusively for COVID-19 were therefore overlaid on all municipalities selected according to these criteria. For the purpose of analyzing the adequacy of the response to COVID-19, we selected those municipalities with access to new ICU beds specifically for COVID-19 above the national median (0.00003132/inhab.). Our option to select those municipalities met the need to identify cities covered by systematic efforts to respond to COVID-19. Thus, it was possible to evaluate whether the new beds made available had been directed to regions with a care gap, regarding ICU access, and which, simultaneously, had a pattern of high incidence of cases and deaths. It was also possible to identify regions with high incidence of cases and deaths in territories with a shortage of urgency and emergency care services and which were therefore a priority for expanding access to ICU beds.
Results
As of August 27, 2020, Brazil had confirmed 3,761,391 COVID-19 cases and 118,649 COVID-19 deaths (Table 1). The Southeast (35%) and Northeast (30%) regions had the highest percentage of cases and deaths: 45% and 29%, respectively. Figure 1 represents COVID-19 incidence and mortality in Brazil. In all, data from 8,023 hospitals were analyzed, totaling 59,695 existing ICU beds, distributed over 3,543 cities. Data on a further 14,671 ICU beds exclusively for COVID-19 in 646 hospitals distributed over 340 cities in April 2020 were added to this total.
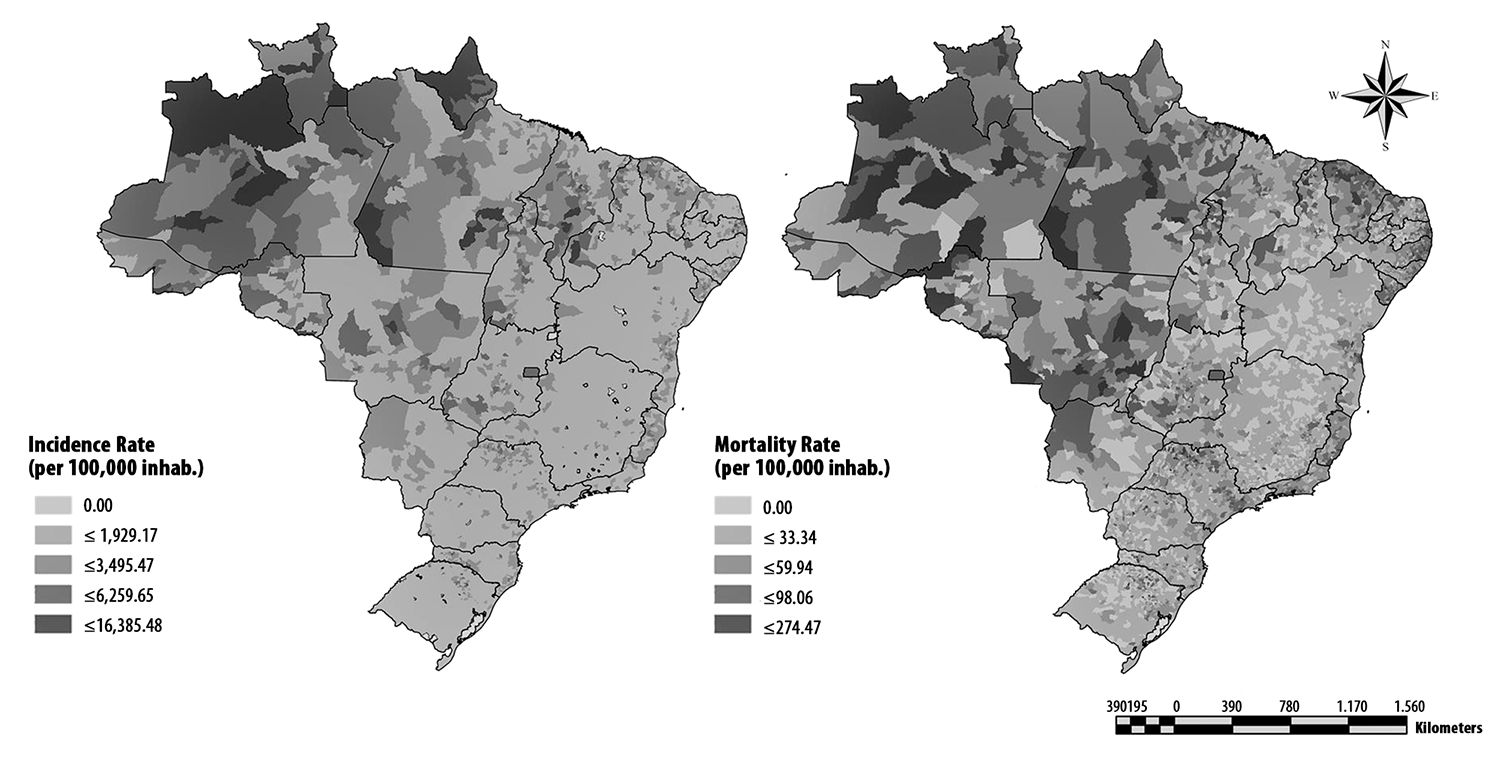
Source: COVID.SAUDE/Ministry of Health.
Figure 1 COVID-19 case incidence rate (per 100,000 inhab.) and COVID-19 case mortality rate (per 100,000 inhab.), Brazil, as at Epidemiological Week 35/2020
When analyzing the COVID-19 incidence clustering in space and time, 54% of the 5,570 Brazilian municipalities were categorized as having an increasing pattern over time, concomitant with statistically significant spatial clustering (Figure 2; Table 1). The oscillating hot spot category was present in 81% of the 3,695 municipalities that had a detected pattern. This category marks a transition of the pattern between cold and hot spots. If in the past these municipalities had a small number of cases, as the epidemiological weeks progressed, they transitioned to a statistically significant spatio-temporal pattern of increasing cases. Eighty-four percent (84%) of the municipalities in the Midwest region fell into the oscillating hot spot category, followed by the Southern region with 63% and the Northern region with 62% of its municipalities categorized in this way (Figure 2; Table 1). In the state of Santa Catarina, 100% of its municipalities fell into this category, and in the states of Rondônia, Sergipe, Tocantins, Goiás and Espírito Santo, more than 90% of the municipalities followed the same pattern.
Table 1 - Distribution, incidence and mortality rates, regular ICUa bed accessibility index and exclusive COVID-19 ICUa bed accessibility index, Brazil, February-August 2020
| States/region | Cases | Deaths | Incidence (100,000 inhab,) | Mortality (100,000 inhab,) | Hospitals | Regular ICUa beds | Hospitals with exclusive COVID-19 beds | Exclusive COVID-19 ICUa beds | ICUa accessibility | Exclusive COVID-19 ICUa bed accessibility | ||
|---|---|---|---|---|---|---|---|---|---|---|---|---|
| Average | Standard deviation | Average | Standard deviation | |||||||||
| Rondônia | 53,805 | 1,109 | 3,027 | 62 | 110 | 446 | 3 | 26 | 0.0018228 | 0.0007994 | 0.0000119 | 0.0000184 |
| Acre | 24,269 | 607 | 2,752 | 69 | 34 | 194 | 2 | 24 | 0.0013165 | 0.0008922 | 0.0000149 | 0.0000192 |
| Amazonas | 118,083 | 3,616 | 2,849 | 87 | 121 | 919 | 5 | 47 | 0.0010374 | 0.0007319 | 0.0000036 | 0.0000128 |
| Roraima | 42,69 | 586 | 7047 | 97 | 23 | 100 | 0 | 0 | 0.0011803 | 0.0010269 | 0.0 | 0.0 |
| Pará | 195,297 | 6,102 | 2,270 | 71 | 286 | 1,574 | 9 | 130 | 0.0013877 | 0.0007757 | 0.0000121 | 0.0000208 |
| Amapá | 42,285 | 652 | 5,000 | 77 | 20 | 170 | 1 | 26 | 0.0011732 | 0.0006841 | 0.0000148 | 0.0000198 |
| Tocantins | 47,558 | 635 | 3,024 | 40 | 77 | 365 | 0 | 0 | 0.001745 | 0.0008311 | 0.0000107 | 0.0000211 |
| North | 523,987 | 13,307 | 2,843 | 72 | 671 | 3,768 | 20 | 253 | 0.0013804 | 0.0001131 | 0.0000097 | 0.0000076 |
| Maranhão | 148,923 | 3,402 | 2,105 | 48 | 323 | 1,240 | 11 | 144 | 0.0016034 | 0.0005227 | 0.0000198 | 0.0000206 |
| Piauí | 75,16 | 1,765 | 2,296 | 54 | 202 | 590 | 18 | 249 | 0.0015302 | 0.0005288 | 0.0000463 | 0.0000344 |
| Ceará | 210,727 | 8,365 | 2,308 | 92 | 349 | 1,944 | 32 | 857 | 0.0017162 | 0.0005386 | 0.0000659 | 0.0000435 |
| Rio Grande do Norte | 60,893 | 2,219 | 1,736 | 63 | 208 | 774 | 15 | 241 | 0.0016683 | 0.0003698 | 0.0000424 | 0.0000246 |
| Paraíba | 104,096 | 2,388 | 2,591 | 59 | 204 | 948 | 1 | 6 | 0.0017934 | 0.0004776 | 0.0000311 | 0.0000287 |
| Pernambuco | 122,147 | 7,480 | 1,278 | 78 | 397 | 2,472 | 47 | 963 | 0.0017827 | 0.0006036 | 0.0000534 | 0.0000393 |
| Alagoas | 77,755 | 1,853 | 2,330 | 56 | 114 | 723 | 17 | 363 | 0.0013918 | 0.0004144 | 0.0000396 | 0.0000222 |
| Sergipe | 71,599 | 1,830 | 3,115 | 80 | 81 | 503 | 4 | 74 | 0.001362 | 0.000181 | 0.0000386 | 0.0000083 |
| Bahia | 247,853 | 5,178 | 1,666 | 35 | 722 | 3,045 | 43 | 1,070 | 0.0014796 | 0.0004535 | 0.0000306 | 0.0000373 |
| Northeast | 1,119,153 | 34,480 | 1,961 | 60 | 2,600 | 12,239 | 188 | 3,967 | 0.001592 | 0.0001243 | 0.0000409 | 0.0000111 |
| Minas Gerais | 205,942 | 5,049 | 973 | 24 | 779 | 5,333 | 64 | 1,252 | 0.0015436 | 0.0004598 | 0.0000358 | 0.0000369 |
| Espírito Santo | 108,662 | 3,105 | 2,704 | 77 | 123 | 1,391 | 11 | 414 | 0.0019287 | 0.0005486 | 0.0000832 | 0.0000538 |
| Rio de Janeiro | 219,198 | 15,859 | 1,270 | 92 | 509 | 7,424 | 70 | 1,963 | 0.0019955 | 0.0004172 | 0.0000508 | 0.000023 |
| São Paulo | 784,453 | 29,415 | 1,708 | 64 | 1,274 | 15,753 | 219 | 4,199 | 0.0019904 | 0.0005888 | 0.0000401 | 0.0000236 |
| Southeast | 1,318,255 | 53,428 | 1492 | 60 | 2,685 | 29,901 | 364 | 7,828 | 0.0018645 | 0.0000789 | 0.0000525 | 0.0000145 |
| Paraná | 124,074 | 3,153 | 1,085 | 28 | 529 | 3,603 | 63 | 861 | 0.0021045 | 0.0005035 | 0.0000821 | 0.000055 |
| Santa Catarina | 139,638 | 2,170 | 1,949 | 30 | 289 | 1,582 | 30 | 313 | 0.0021434 | 0.0004534 | 0.0000292 | 0.0000114 |
| Rio Grande do Sul | 118,315 | 3,275 | 1,040 | 29 | 359 | 3,252 | 49 | 499 | 0.002593 | 0.000566 | 0.0000447 | 0.0000174 |
| South | 382,027 | 8,598 | 1,274 | 29 | 1,177 | 8,437 | 142 | 1,673 | 0.0022803 | 0.0000564 | 0.000052 | 0.0000236 |
| Mato Grosso do Sul | 46,261 | 800 | 1,665 | 29 | 138 | 668 | 5 | 27 | 0.0014844 | 0.0006714 | 0.0000192 | 0.0000372 |
| Mato Grosso | 87,484 | 2,649 | 2,511 | 76 | 197 | 1,148 | 25 | 406 | 0.0015926 | 0.0008119 | 0.0000338 | 0.0000493 |
| Goiás | 127,361 | 2,962 | 1,815 | 42 | 472 | 1,866 | 19 | 497 | 0.0023034 | 0.0008626 | 0.0000332 | 0.0000319 |
| Distrito Federal | 156,863 | 2,425 | 5,202 | 80 | 83 | 1,668 | 1 | 20 | 0.0015344 | - | 0.0000156 | - |
| Midwest | 417,969 | 8,836 | 2,565 | 54 | 890 | 5,350 | 50 | 950 | 0.0017287 | 0.0000991 | 0.0000254 | 0.0000089 |
| Brazil | 3,761,391 | 118,649 | 1,790 | 56 | 8,023 | 59,695 | 764 | 14,671 | 0.0018219 | 0.0006702 | 0.0000396 | 0.000037 |
a) ICU: unit care intensive.
It can be seen that 67% of the municipalities in the state of Roraima were categorized as consecutive hot spots. This category indicates that the location was uninterruptedly categorized as a statistically significant hot spot in the final time intervals analyzed (Figure 2; Table 1).
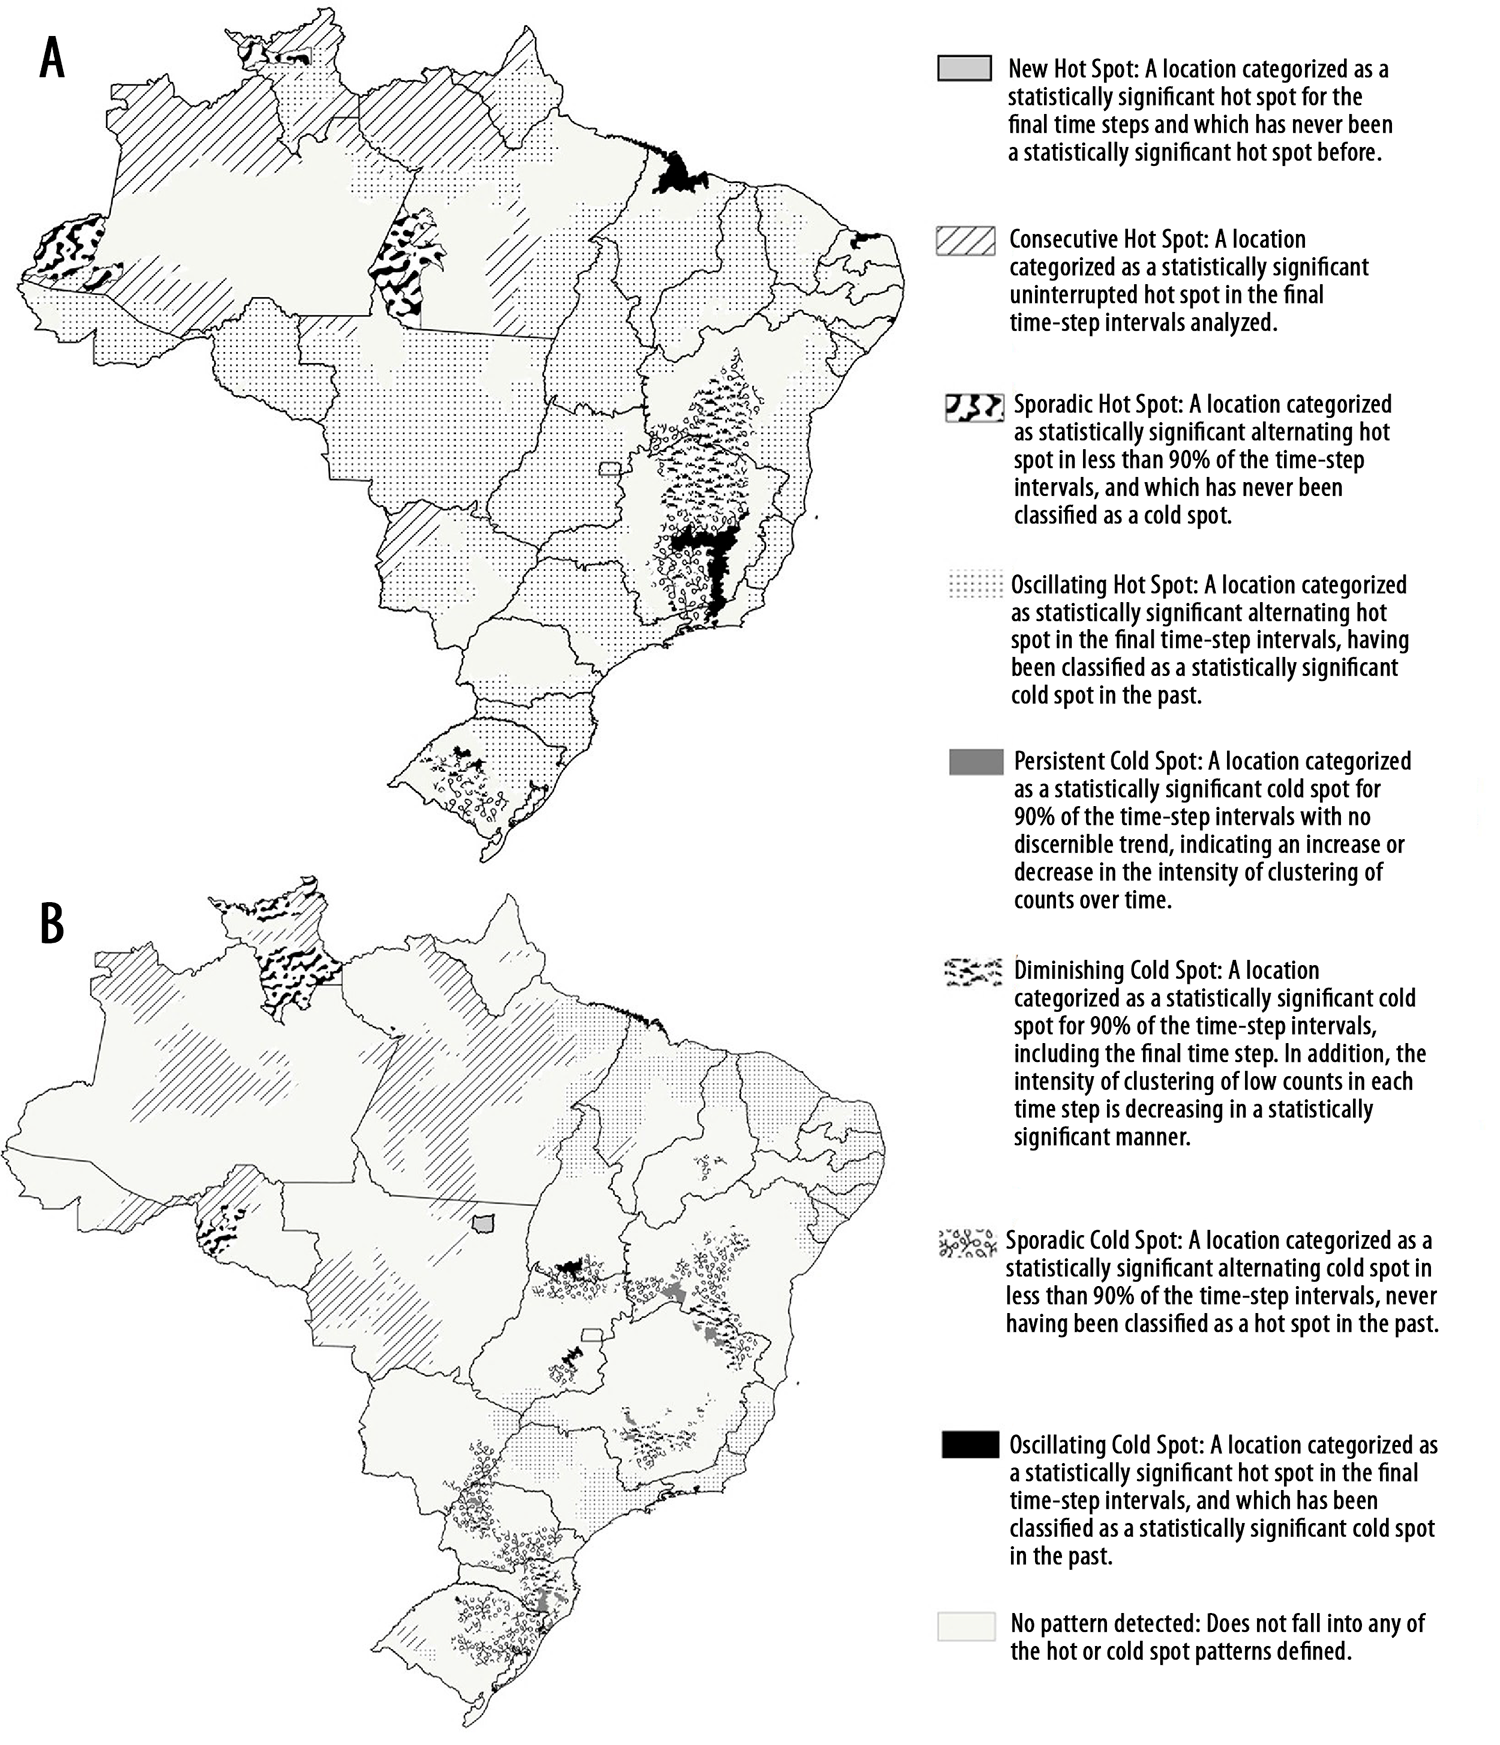
Figure 2 Spatio-temporal cluster analysis of COVID-19 cases (A) and spatio-temporal cluster analysis of COVID-19 deaths (B), Brazil, Epidemiological Week 35/2020
There are variations in the categorizations found in the Southeast region of Brazil. The state of Minas Gerais, for example, has 13% of municipalities classified as diminishing cold spots, that is: clusters that in the past were cold spots but for which statistical association has been weakening (Figure 2; Table 1). This means that in the near future those municipalities may be taken as proxies for regions with the potential to become hot spots.
Spatio-temporal clustering of mortality indicated the same increasing pattern in 31% of municipalities over the epidemiological weeks studied. Of the municipalities for which a mortality rate pattern was determined, 29% were classified in the oscillating hot spot category (Figure 2; Table 1). The Northeast region had the highest percentage (16%) of municipalities in transition from cold spots to hot spots (oscillating hot spots). More than 80% of the municipalities in the states of Alagoas, Ceará, Espírito Santo and Sergipe were categorized as oscillating hot spots (Figure 2; Table 1)
It can be seen that the states of Acre (45%) and Roraima (40%) had a high percentage of municipalities considered to be consecutive hot spots. Forty-seven percent (47%) of the municipalities in Roraima were categorized as sporadic hot spots.
Figure 3 shows the accessibility indices for all ICU beds (A) and for ICU beds exclusively for COVID-19 (B). We found that 25% (1,380) of Brazilian municipalities had the lowest accessibility index (≤0.000112/inhab.) for regular ICU beds, with 47% (213 of 450) of the Northern region municipalities falling into this category. Only 250 cities achieved the highest accessibility index (≤0.001075/inhab), mostly in the Midwest region (16.1%) (Figure 3; Table 1)
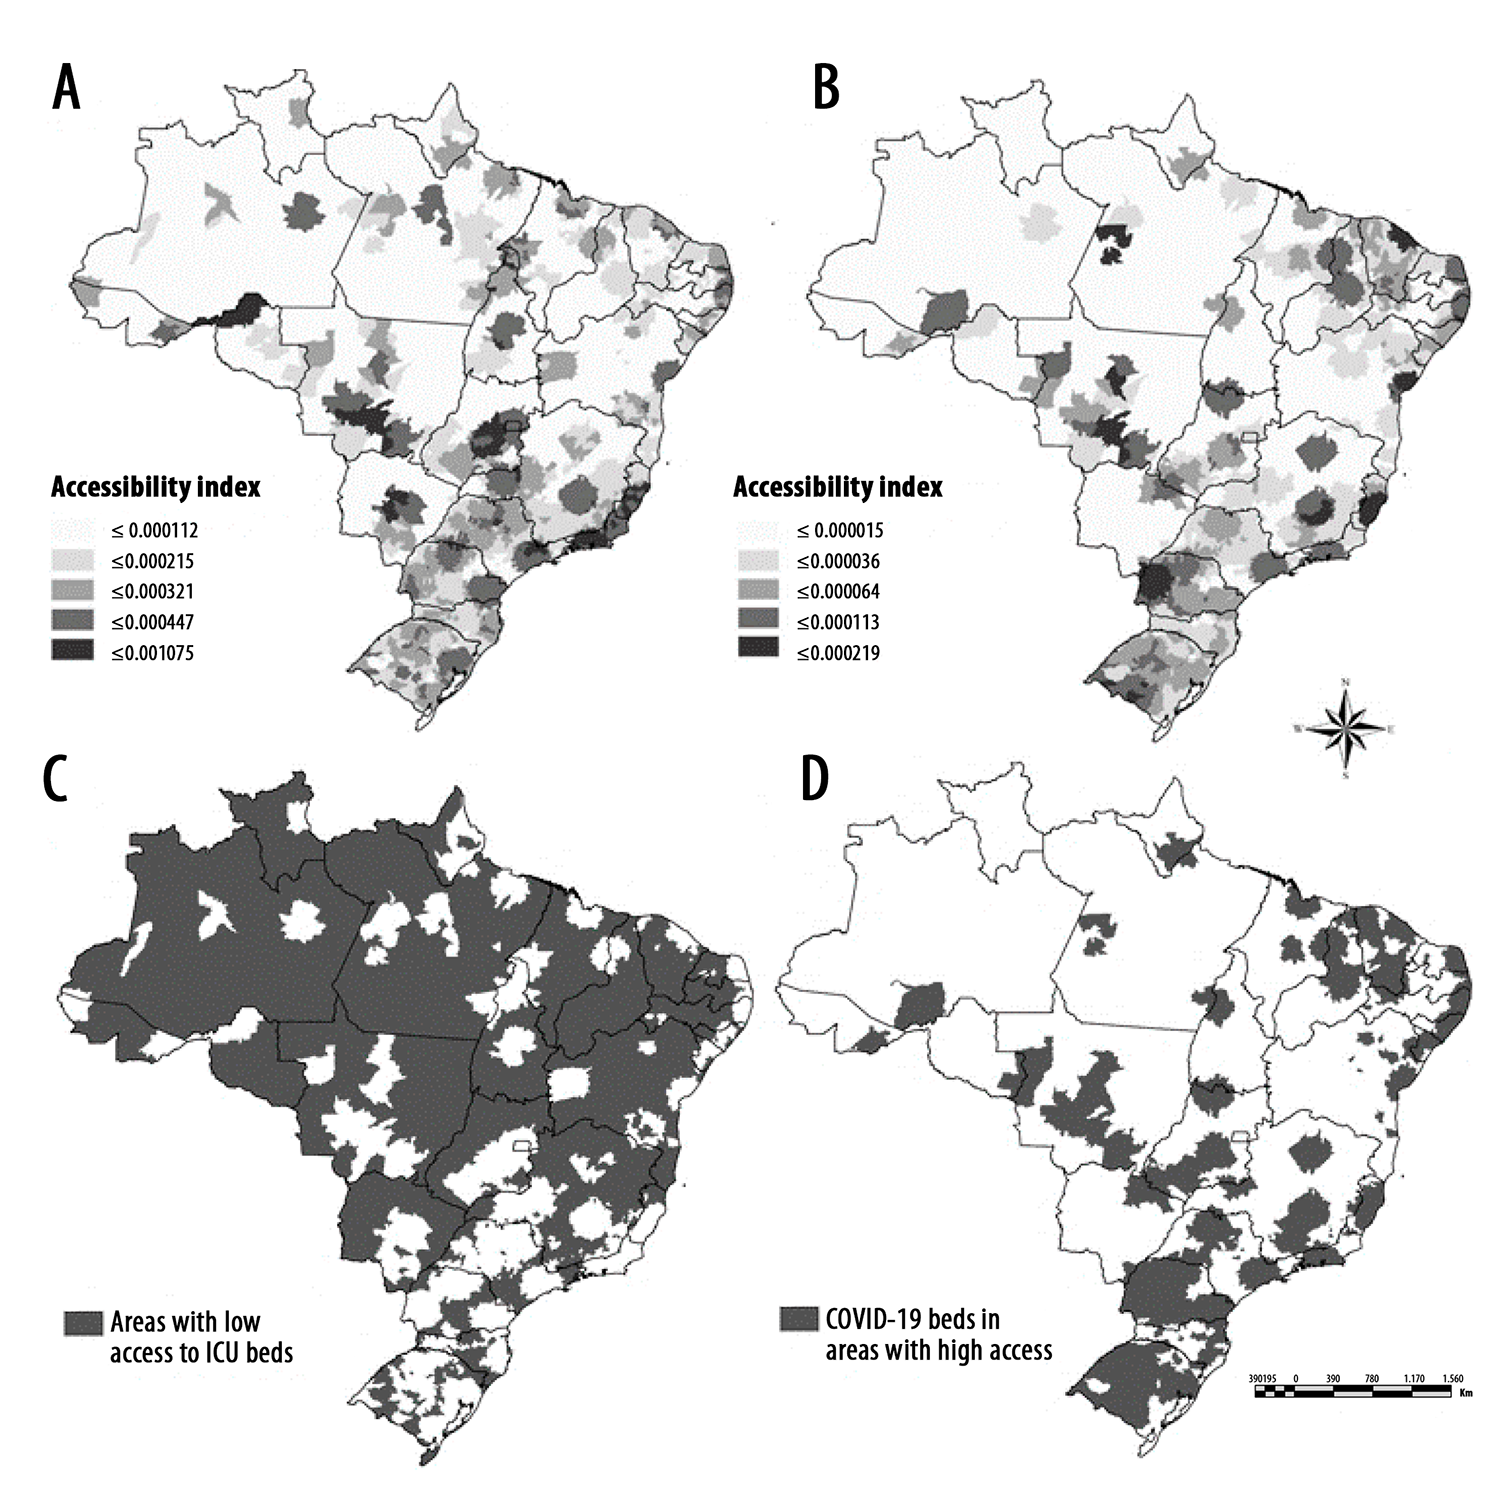
a) ICU: unit care intensive.
Figure 3 Accessibility index for ICUa beds (A), accessibility index for ICUa beds exclusively for COVID-19 (B), municipalities with a low accessibility index for ICUa beds (C) and municipalities with a high accessibility index for ICUa beds exclusively for COVID-19 (D), Brazil, May 1, 2020
Regarding exclusive beds for COVID-19, 29% (1,614) of Brazilian municipalities had an accessibility index ≤0.000036/inhabitant and only 5.3% (293) reached the highest index on the scale, that is, ≤0.000219/inhabitant. In the Northern region, which is strongly affected by lack of access, 76.2% (343) of its municipalities had the lowest accessibility indices (Figure 3; Table 1).
With regard to municipalities with accessibility below the national median (0.000204/inhab.), low access to ICU beds was attributed to municipalities in the interior regions areas of the country. This pattern of spatial distribution of access draws attention to the challenge of responding to COVID-19 as the disease spreads to interior regions over time. Taking hot spots selected based on the spatio-temporal clustering of COVID-19 incidence and overlaying accessibility of regular ICU beds revealed that the Midwest and Northern regions both had 44% of their municipalities in hot spots with a care gap for regular ICU beds. Regarding mortality, the regions with the highest number of municipalities in hot spots with a care gap were the Northeast (25%) and the North (21%) (Figure 4).
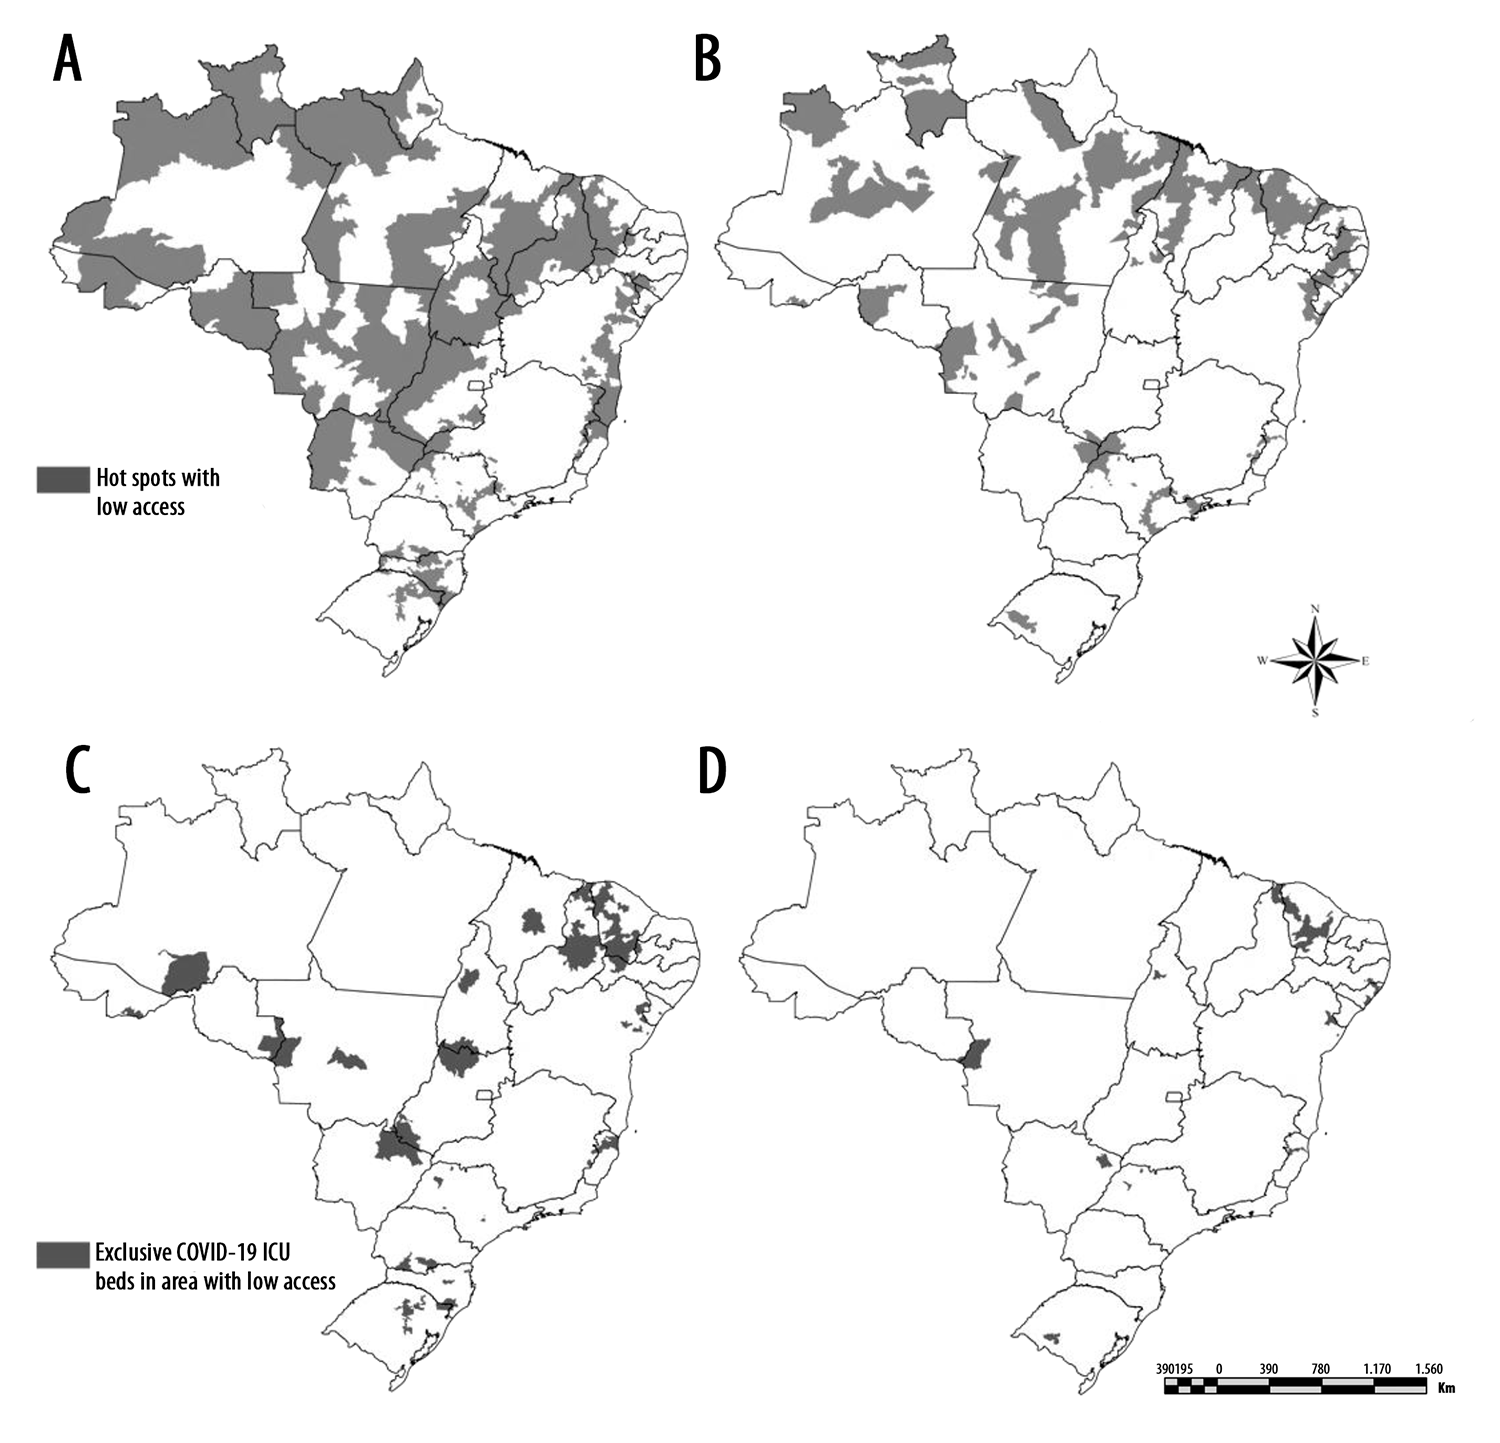
Figure 4 Hot spots with low access to regular ICUa beds (A, incidence; B, mortality) and ICUa beds exclusively for COVID-19 in areas with low access to ICUa beds (C, incidence; D, mortality), Brazil, May 1, 2020
With the aim of responding to COVID-19 with due agility, 14,671 ICU beds specifically for COVID-19 were made available throughout Brazil by May 1st (Table 1). When observing the distribution of these beds and the municipalities in areas with care gaps, it is evident that 28% of these municipalities were benefited. In the Northeast region, 41% of municipalities had specific COVID-19 ICU beds in areas with care gaps, while in the Southeast region 10% of municipalities were in this situation (Figure 4).
Regarding mortality, only 14% of the municipalities in areas with care gaps were covered by new ICU beds exclusively for COVID-19. The Southern region had the highest coverage of this measure: 50% of its municipalities in hot spots areas were covered. In the Northeast region, 19% of its municipalities received ICU beds intended for this specialty, as well as 8% of the municipalities in the Midwest region, 5% in the Southeast, and 4% in the North of Brazil.
Discussion
This study sought to explore the reorganization of the health system regarding tertiary care in response to the COVID-19 pandemic. We were able to identify regions with care gaps not covered by the provision of new ICU beds for COVID-19.
Adequate spatial overlaying of the population’s need for services in relation to service supply structures is an important proxy for access.20 Despite the importance of geospatial models, these approaches are underutilized in analytical efforts to understand patterns of disease spread. A PubMed search in July 2020 found 361 papers using GIS to analyze COVID-19 data and only one paper with a spatio-temporal clustering approach using emerging hot spot analysis.
Although examining spatial clustering patterns, without the use of longitudinal approaches, is useful for the instrumentalization of specific actions, it lacks a broader perspective capable of providing an overview of trends. In this study, the use of the detailed approach sought precisely to overcome this limitation. Space-time cluster analysis allowed us to identify groups of Brazilian municipalities that have been reporting an increase in incidence and mortality.
The methodological steps defined in this study make it possible to qualify the efforts to increase access to ICU beds in response to COVID-19 and, furthermore, to identify regions that have higher needs than others, in order to prioritize, as well as to motivate possible reallocations, based on the principle of solidarity of public entities and the federal pact.
Gravity models (2SFCA), like the one used in this study, enable identification of regions with health assistance gaps. Regions indicated as having low ICU bed availability are marked by peculiarities and additional challenges to access, characterized as geographical barriers.21 Unavailability of ICU beds within two hours of traveling time is an additional COVID-19 risk parameter, since in order for an individual with an acute form of the disease to have respiratory support they will have to travel long distances. The existence of care gaps in Brazil is a chronic problem, which relates to the organizational principle of regionalization and hierarchization of the Brazilian National Health System (SUS). With the exception of the South, all other regions of the country have a high number of municipalities located in regions with care gaps. Overlaying regions categorized as COVID-19 incidence and mortality hot spots and regions with low access to regular ICU beds, pointed to fragile situations in the North, Northeast, and isolated portions of the Southeast.
Despite the challenges inherent to a rapid response to COVID-19, a very expressive expansion of ICU beds in Brazil can be seen, beginning in mid-March 2020. In all, more than 14,000 ICU beds were made available exclusively for COVID-19. In order to optimize these scarce resources, actions should be directed to those places characterized as having ICU care gaps. The spatial overlay analyses were able to identify that the new ICU beds made available were not always directed to regions with care gaps. According to the National Health Establishment Registry database, access to new ICU beds in response to COVID-19 was optimized mainly in the Northeast, Southeast and Southern regions. It can be seen that in large parts of the North and Midwest regions, expansion of access to ICU occurred in places that are not hot spots or do not have care gaps. Thus, it can be seen that part of the response efforts to COVID-19 could be better directed, aiming to supply regions with greater challenges resulting from geographic barriers to ICU access.
The world as a whole has faced a shortage of medical equipment, human health care resources, personal protective equipment and respirators.22 Providing evidence of these problems is necessary in order to instrumentalize management decisions with the objective of optimizing scarce resources. In Brazil, although new ICU beds were made available they were unable to provide coverage broad enough to assist municipalities with care gaps and where COVID-19 incidence and mortality was worsening. It is important to discuss the possibility of incorporating new beds for COVID-19 in the SUS on a permanent basis, which could reduce the care gaps historically identified in these regions. The findings of this study demonstrate how spatio-temporal clustering can be a useful tool to help decision making with regard to resource allocation.
This study has limitations. Among them, it is worth mentioning case underreporting, which could modify the grouping patterns of municipalities categorized as incidence and/or mortality hot spots.23 Another point to be highlighted is the fact that we did not analyze data on human health resources or equipment. Surveillance systems are known to have limitations with regard to the time taken to report cases. Delays in case notification can cause temporal association patterns to change. Finally, the option of using Euclidean distance for estimating the accessibility index is another point worthy of discussion. The diversity in land use patterns in Brazil causes other 2SFCA approaches to present inaccurate results when trying to estimate accessibility in densely populated regions, rural regions, or in the Amazon which is a huge and hard-to-access territory. Therefore, Euclidean distance proves to be the approach which presents fewest inaccuracies in very divergent contexts, as is the case of Brazil.24
Looking to the future, it is important to discuss the need to incorporate, in the routine monitoring and evaluation of the response to COVID-19, dynamic analysis techniques, capable of generating evidence. The versatility of the approach used and defended in this study, means that it can be applied to other scopes and diseases, such as severe acute respiratory syndrome and vaccine-preventable diseases (for redistribution of vaccines and specialized services), during emergencies due to natural disasters.
Referências
1. Tan W, Zhao X, Ma X, Wang W, Niu P, Xu W, et al. A novel coronavirus genome identified in a cluster of pneumonia cases, Wuhan, China 2019-2020. China CDC Wkly. 2020 Jan 21 [acesso 29 ago. 2020];2(4):61-2. doi: https://doi.org/10.46234/ccdcw2020.017. [ Links ]
2. The 2019-nCoV Outbreak Joint Field Epidemiology Investigation Team, Li Q. An outbreak of NCIP (2019-nCoV) infection in China, Wuhan, Hubei Province, 2019-2020. China CDC Wkly. 2020 Jan [acesso 29 ago 2020];2(5):79-80. doi: https://doi.org/10.46234/ccdcw2020.022. [ Links ]
3. World Health Organization. Statement on the second meeting of the international health regulations (2005) emergency committee regarding the outbreak of novel coronavirus (2019-nCoV). Geneva: WHO; 2020 Jan 30 [acesso 29 ago 2020]. Disponível em: https://www.who.int/news-room/detail/30-01-2020-statement-on-the-second-meeting-of-the-international-health-regulations-(2005)-emergency-committee-regarding-the-outbreak-of-novel-coronavirus-(2019-ncov) [ Links ]
4. World Health Organization. Coronavirus disease (COVID-19) [Internet]. Geneva: WHO; 2020 [acesso 28 ago 2020]. Disponível em: https://covid19.who.int/ [ Links ]
5. Ministério da Saúde (BR). Painel coronavírus Brasil. [Internet]. Brasília, DF: MS; 2020 [acesso 28 ago 2020]. Disponível em: https://covid.saude.gov.br/ [ Links ]
6. Ministerio da Saúde (BR). Situação epidemiológica da COVID-19 [Internet]. Brasília, DF: MS; 2020 [acesso 27 ago 2020]. Disponível em: https://www.saude.gov.br/images/pdf/2020/August/27/Boletim-epidemiologico-COVID-28-FINAL-COE.pdf [ Links ]
7. Hu Y, Sun J, Dai Z, Deng H, Li X, Huang Q, et al. Prevalence and severity of corona virus disease 2019 (COVID-19): a systematic review and meta-analysis. J Clin Virol. 2020;127:104371. doi: https://doi.org/10.1016/j.jcv.2020.104371. [ Links ]
8. Grant MC, Geoghegan L, Arbyn M, Mohammed Z, McGuinness L, Clarke EL, et al. The prevalence of symptoms in 24,410 adults infected by the novel coronavirus (SARS-CoV-2; COVID-19): A systematic review and meta-analysis of 148 studies from 9 countries. PLoS One. 2020 Jun 23;15(6):e0234765. doi: https://doi.org/10.1371/journal.pone.0234765. [ Links ]
9. Franch-Pardo I, Napoletano BM, Rosete-Verges F, Billa L. Spatial analysis and GIS in the study of COVID-19: a review. Sci Total Environ. 2020 Out 15;739:140033. doi: https://doi.org/10.1016/j.scitotenv.2020.140033. [ Links ]
10. Kristensson PO, Dahlbck N, Anundi D, Björnstad M, Gillberg H, Haraldsson J, et al. An evaluation of space time cube representation of spatiotemporal patterns. IEEE Trans Vis Comput Graph. 2009;15(4):696-702. doi: https://doi.org/10.1109/TVCG.2008.194. [ Links ]
11. Desjardins MR, Hohl A, Delmelle EM. Rapid surveillance of COVID-19 in the United States using a prospective space-time scan statistic: detecting and evaluating emerging clusters. Appl Geogr. 2020;118:102202. doi: https://doi.org/10.1016/j.apgeog.2020.102202. [ Links ]
12. Andrade LA, Gomes DS, Góes MAO, Souza MSF, Teixeira DCP, Ribeiro CJN, et al. Surveillance of the first cases of COVID-19 in Sergipe using a prospective spatiotemporal analysis: the spatial dispersion and its public health implications. Rev Soc Bras Med Trop. 2020;53: e20200287. doi: https://doi.org/10.1590/0037-8682-0287-2020. [ Links ]
13. Zhao Y, Ge L, Liu J, Liu H, Yu L, Wang N, et al. Analyzing hemorrhagic fever with renal syndrome in Hubei Province, China: a space-time cube-based approach. J Int Med Res. 2019;47(7):3371-88. doi: https://doi.org/10.1177/0300060519850734. [ Links ]
14. Kang Y, Cho N, Son S. Spatiotemporal characteristics of elderly population's traffic accidents in Seoul using space-time cube and space-time kernel density estimation. PLoS One. 2018 May;13(5):e0196845. doi: https://doi.org/10.1371/journal.pone. 0196845. [ Links ]
15. Huang J-X, Wang J-F, Li Z-J, Wang Y, Lai S-J, Yang W-Z. Visualized Exploratory Spatiotemporal Analysis of Hand-Foot-Mouth Disease in Southern China. PLoS One2015 Nov 25;10(11):e0143411. doi: https://doi.org/10.1371/journal.pone.0143411. [ Links ]
16. Mo C, Tan D, Mai T, Bei C, Qin J, Pang W, et al. An analysis of spatiotemporal pattern for COIVD-19 in China based on space-time cube. J Med Virol. 2020;92(9):1587-95. doi: https://doi.org/10.1002/jmv.25834. [ Links ]
17. Hochman B, Nahas FX, Oliveira Filho RS, Ferreira LM. Research designs. Acta Cir Bras. 2005;20(Suppl 2):2-9. doi: https://doi.org/10.1590/s0102-86502005000800002. [ Links ]
18. Environmental Systems Research Institute. Emerging hot spot analysis: help ArcGIS for desktop [Internet]. [Redlands (CA)]; 2020 [acesso 27 ago. 2020]. Disponível em: https://desktop.arcgis.com/en/arcmap/10.3/tools/space-time-pattern-mining-toolbox/emerginghot spots.htm [ Links ]
19. Silva NC, Rocha TAH, Amaral PV, Elahi C, Thumé E, Thomaz EBAF, et al. Comprehending the lack of access to maternal and neonatal emergency care: designing solutions based on a space-time approach. PLoS One. 2020 Jul 23;15(7):e0235954. doi: https://doi.org/10.1371/journal.pone.0235954. [ Links ]
20. Rocha TAH, Silva NC, Amaral PV, Barbosa ACQ, Rocha JVM, Alvares V, et al. Addressing geographic access barriers to emergency care services: a national ecologic study of hospitals in Brazil. Int J Equity Health. 2017 Aug 22;16(1):149. Disponível em: https://equityhealthj.biomedcentral.com/articles/10.1186/s12939-017-0645-4. doi: https://doi.org/10.1186/s12939-017-0645-4. [ Links ]
21. Rocha TAH, Silva NC, Amaral PV, Barbosa ACQ, Rocha JVM, Alvares V, et al. Access to emergency care services: a transversal ecological study about Brazilian emergency health care network. Public Health. 2017;153:9-15. doi: https://doi.org/10.1016/j.puhe.2017.07.013. [ Links ]
22. Ranney ML, Griffeth V, Jha AK. Critical supply shortages: the need for ventilators and personal protective equipment during the covid-19 pandemic. N Engl J Med. 2020 Apr 30;382(18):e41. doi: https://doi.org/10.1056/NEJMp2006141. [ Links ]
23. Universidade Federal de Pelotas. Epicovid-19 terá próxima etapa nacional [Internet]. Pelotas (RS): UFPEL; 5 ago. 2020 [acesso 29 ago 2020]. Disponível em: https://ccs2.ufpel.edu.br/wp/2020/08/05/epicovid19-tera-proxima-etapa-nacional/. [ Links ]
24. Rocha TAH, Vissoci J, Rocha N, Poenaru D, Shrime M, Smith ER, et al. Towards defining the surgical workforce for children: A geospatial analysis in Brazil. BMJ Open. 2020 Mar 24;10(3):e034253. Disponível em: https://bmjopen.bmj.com/content/10/3/e034253 doi: https://doi.org/10.1136/bmjopen-2019-034253. [ Links ]
Received: September 23, 2020; Accepted: April 09, 2021
 Este é um artigo publicado em acesso aberto sob uma licença Creative Commons
