


Servicios Personalizados
Revista

Articulo
 texto en
  Inglés (pdf)
 Articulo en XML
 Referencias del artículo
 Enviar articulo por email
Indicadores
-
 Citado por SciELO
Links relacionados
-
 Similares en
SciELO
Similares en
SciELO
Compartir

 Permalink
Epidemiologia e Serviços de Saúde
versión impresa ISSN 1679-4974versión On-line ISSN 2237-9622
Epidemiol. Serv. Saúde vol.30 no.4 Brasília dic. 2021 Epub 19-Nov-2021
http://dx.doi.org/10.1590/s1679-49742021000400009
Original Article
Victimization and perpetration of intimate partner violence among elderly people: a cross-sectional study, Florianópolis, Santa Catarina, Brazil, 2013/2014*
1Universidade Federal de Santa Catarina, Departamento de Saúde Pública, Florianópolis, SC, Brazil.
Objective
VTo verify prevalence of intimate partner violence among elderly people and to identify associated factors.
Methods
This was a cross-sectional population-based study using data from the EpiFloripa Idoso Study, with elderly people living in Florianópolis, Santa Catarina, Brazil, between 2013 and 2014. Prevalence rates were described and factors associated using Poisson regression were analyzed, for violence suffered and perpetrated, stratified by sex.
Results
Among 651 elderly people, 48.3% of males and 46.4% of females suffered intimate partner violence. Psychological violence suffered (48.3% and 44.8%) and perpetrated (49.8% and 44.5%) predominated in males and females, respectively. Perpetrated violence was associated with poor/very poor self-perceived health (PR=1.74) among males, and with regular self-perceived health (PR=1.53) and separated/divorced marital status (PR=1.86) among females.
Conclusion
Symmetry was found between the sexes for prevalence of intimate partner violence, for all directionalities of violence analyzed.
Keywords: Intimate Partner Violence; Prevalence; Elderly; Cross-Sectional Studies
Introduction
Violence against the elderly tends to occur in the domestic environment, usually committed by family members, caregivers, including partners.1 Intimate partner violence is defined by acts of physical aggression, psychological abuse, controlling behavior, and economic abuse, identifiable in intimate relationships.2,3 Recurrent in the literature, this form and object of violence is addressed with emphasis on intimate partner violence against women of reproductive age,4 with men investigated as the aggressors and women as the victims, with little emphasis on the possibility of violence being committed by women.5
According to the World Health Organization, approximately 30% of women worldwide have experienced some form of intimate partner violence, while a systematic review of publications from English-speaking industrialized countries found prevalence of approximately 20% among men.6,7 A population-based study conducted in Canada to analyze intimate partner violence among elderly people, stratified by sex and directionality of violence, found higher proportions of victimization in men (4.9%) when compared to women (3.3%).8
The following factors stand out as being associated with intimate partner violence among the elderly: alcohol use, depression, low income, low schooling, being between 60 and 69 years old, being divorced or separated, having poor or bad self-perceived health, functional impairment, as well as previous exposure to violence.8-10 Being in a situation of violence brings social consequences for the elderly, such as low self-esteem, social isolation, fear and insecurity.11 Furthermore, there are implications for physical and mental health, such as higher proportions of reports of headaches, musculoskeletal pain, anxiety, stress and suicidal ideation, when a person sees their own old age in a negative light.12 Despite the health impact of intimate partner violence on both sexes, research into violence against women predominates.
Studies on violence against the elderly have focused on investigation of victims of mistreatment, usually by family members or caregivers.13 Intimate partner violence among the elderly is underassessed. It may be included in the general definition of family violence, and this prevents a clear and detailed understanding of the phenomenon.
A systematic review of intimate partner violence prevalence and associated factors among the elderly, performed on population-based studies, found only four studies conducted exclusively with the elderly, since most publications analyze them together with adults, thus concealing the specificities of the older age group.14 Considering the negative impacts of intimate partner violence throughout life, including in aging, the relevance of population-based research that investigates this outcome among elderly men and women is evident. It is essential, for society, to assure that this age group has decent living and health conditions, providing them with a safe and healthy aging process.
The objective of this study was to verify prevalence of intimate partner violence among elderly people and to identify associated factors.
Methods
This is a cross-sectional population- and household-based study, using data collected in the second wave (2013/2014) of the EpiFloripa Idoso longitudinal study, which investigates the living conditions and health of older people (≥60 years) living in the municipality of Florianópolis.
In 2009, Florianópolis, capital of the state of Santa Catarina, had a total population of 421,240 inhabitants, of whom 49,793, i.e. 11.5% of the population, were aged 60 years or older. The municipal human development index (HDI-M) was 0.847.15
The selection of the baseline sample (2009/2010) occurred in two stages. The first consisted of 420 urban census tracts selected, in ascending order, according to the income of the heads of household. Eighty tracts were then systematically selected (eight for each income decile). In the second stage, the units of study were the households.
The sample size of the EpiFloripa Idoso study was calculated using Epi Info version 6.04, according to the following parameters: population size equal to 44,460 inhab.; 50% unknown prevalence; sampling error equal to 4 percentage points; 95% confidence interval; and design effect equal to 2. A further 20% was added for losses and 15% for association studies, totaling a minimum sample of 1,599 people.15 Information about the methodological details of the second wave of the EpiFloripa Idoso survey can be found in the study by Schneider et al.16
The study outcome - intimate partner violence - was measured using the Portuguese version of the Conflict Tactics Scales Form R (CTS-1), culturally adapted to the context, to measure violence between partners.17 The questionnaire investigates psychological aggression through six items classified as ‘insults and threats’ (swore or insulted; got angry; stomped out of the room; did/said things to irritate; threatened to hit or throw something; destroyed/threw objects), and physical assault according to eight items identified as ‘physical or explicit force’ (throwing objects; pushing/shoving; slapping; kicking, biting or punching; hitting or attempting to hit with objects; beating up; choking/suffocating; threatening with a knife or gun). Each item of the questionnaire, on physical violence and psychological violence, is dichotomized into ‘yes’ and ‘no’, and the respondent is asked whether he/she committed the act (perpetrated violence) or if the partner committed it against him/her (suffered violence). When the same individual suffered and perpetrated violence, this was defined as bidirectional violence. Intimate partner violence was considered to be present when a positive response was obtained for at least one of the scale items. The recall period used by the CTS-1 refers to the last 12 months.
The exploratory sociodemographic variables were: self-reported race/skin color (white; black; brown/yellow/indigenous), marital status (married/has a partner; single; separated/divorced; widowed), who the elderly person lived with (alone; with spouse/family members), if there were other people dependent on the elderly person’s income (no; yes) and if the elderly person currently had a paid job (no; yes). The ‘sex’ variable (female; male) was used for analysis stratification.
The health conditions investigated were: self-perception of health (very good/good; regular; poor/very poor), alcoholic beverage consumption (never; moderate; high); smoking habit (never smoked; former smoker; currently smokes) and self-reported morbidities (none/one; two or more). Cognitive deficit was measured using Folstein’s mini-mental state examination, categorized as probable cognitive deficit (yes; no), using schooling to define the cut-off points.18 Occurrence of depressive symptoms was assessed using the short version of the geriatric depression scale (GDS-15) with 15 questions, whereby individuals scoring six or more were classified as having ‘suspected depression’.19
Dependency regarding activities of daily living was measured using the activities of daily living (ADL) scale, of the Brazilian OARS Multidimensional Assessment Questionnaire (BOMFAQ), which measures functional ability by asking 15 questions about basic activities of daily living (BADL) and instrumental activities of daily living (IADL).20 Classification of ADL dependency was based on three categories: no inability; mild, when there was inability/difficulty in carrying out between one and three ADLs; moderate/severe, when there was inability/difficulty in carrying out four or more ADLs.
The adjustment variables were: age group (in years: 60-69; 70-79; ≥80), per capita family income (in minimum wages: up to 1; between 1 and 5; between 5 and 10; more than 10) and schooling (in years of study: no formal schooling; 1-4; 5-8; 9-11; ≥12).
The interviews were conducted between November 2013 and October 2014, face to face, by trained interviewers, and recorded on portable computers (netbooks). The questions about violence, preferably asked of the elderly woman or man on their own, were in the last block of the questionnaire, given the nature of the topic and the expectation of there being greater closeness between interviewer and interviewee at this point. Data collection quality control was done by telephone, by administering a shorter version of the questionnaire to 10% of the interviewees selected at random.
Data analysis began with descriptive statistics of the sample, comparing the elderly included in the study with those excluded from the study, in order to identify the characteristics of each group. Descriptive analysis of the participants’ sociodemographic characteristics and health conditions was also performed, with stratification by gender. Intimate partner violence prevalence and respective 95% confidence intervals (95%CI) were described for males and females, according to the nature of the violence: any action characterized as physical or psychological violence (physical violence [on its own]; psychological violence [on its own]; physical and psychological violence [together]); and violence directionality (suffered; perpetrated; bidirectional). Person’s chi-square test and Fisher’s exact test (for n<20) were applied to compare the coefficients of violence between the sexes.
In order to identify sociodemographic factors and health conditions associated with intimate partner violence, we considered any positive answer regarding violence, whether physical, psychological or bidirectional, as the outcome. Poisson regression was used to estimate prevalence ratios (PR) and 95%CI, stratified by sex and directionality of intimate partner violence, in both unadjusted analysis and analysis adjusted for age, schooling, and income. Two regression models were applied: violence suffered and violence perpetrated, stratified by sex. A two-level hierarchical model was used in the adjusted analysis: (i) the first level included the sociodemographic variables (race/skin color, marital status, cohabitation, existence of other people dependent on the elderly person’s income, current paid work); the second level was comprised of health conditions (self-perception of health, frequency of alcohol consumption, smoking habit, self-reported comorbidities, cognitive deficit, ADL dependency). Inclusion of variables in the adjusted model followed predetermined levels: variables with a p-value <0.20 in the unadjusted model were included in the adjusted model, and were considered to be statistically significant when their p-value was <0.05 in the final model. Data analysis was performed using Stata 14.0 statistical software (Stata Corporation, College Station, USA). The effect of the cluster sampling design was taken into consideration, and sampling weights were incorporated into the survey module of the Stata program (svy command).
The EpiFloripa Idoso study project was approved by the Federal University of Santa Catarina Research Ethics Committee: Protocol No. 352/2008, issued on December 15, 2008; Certificate of Submission for Ethical Appraisal No. 16731313.0.0000.0121, dated 10/02/2014. All participants signed free and informed consent forms.
Results
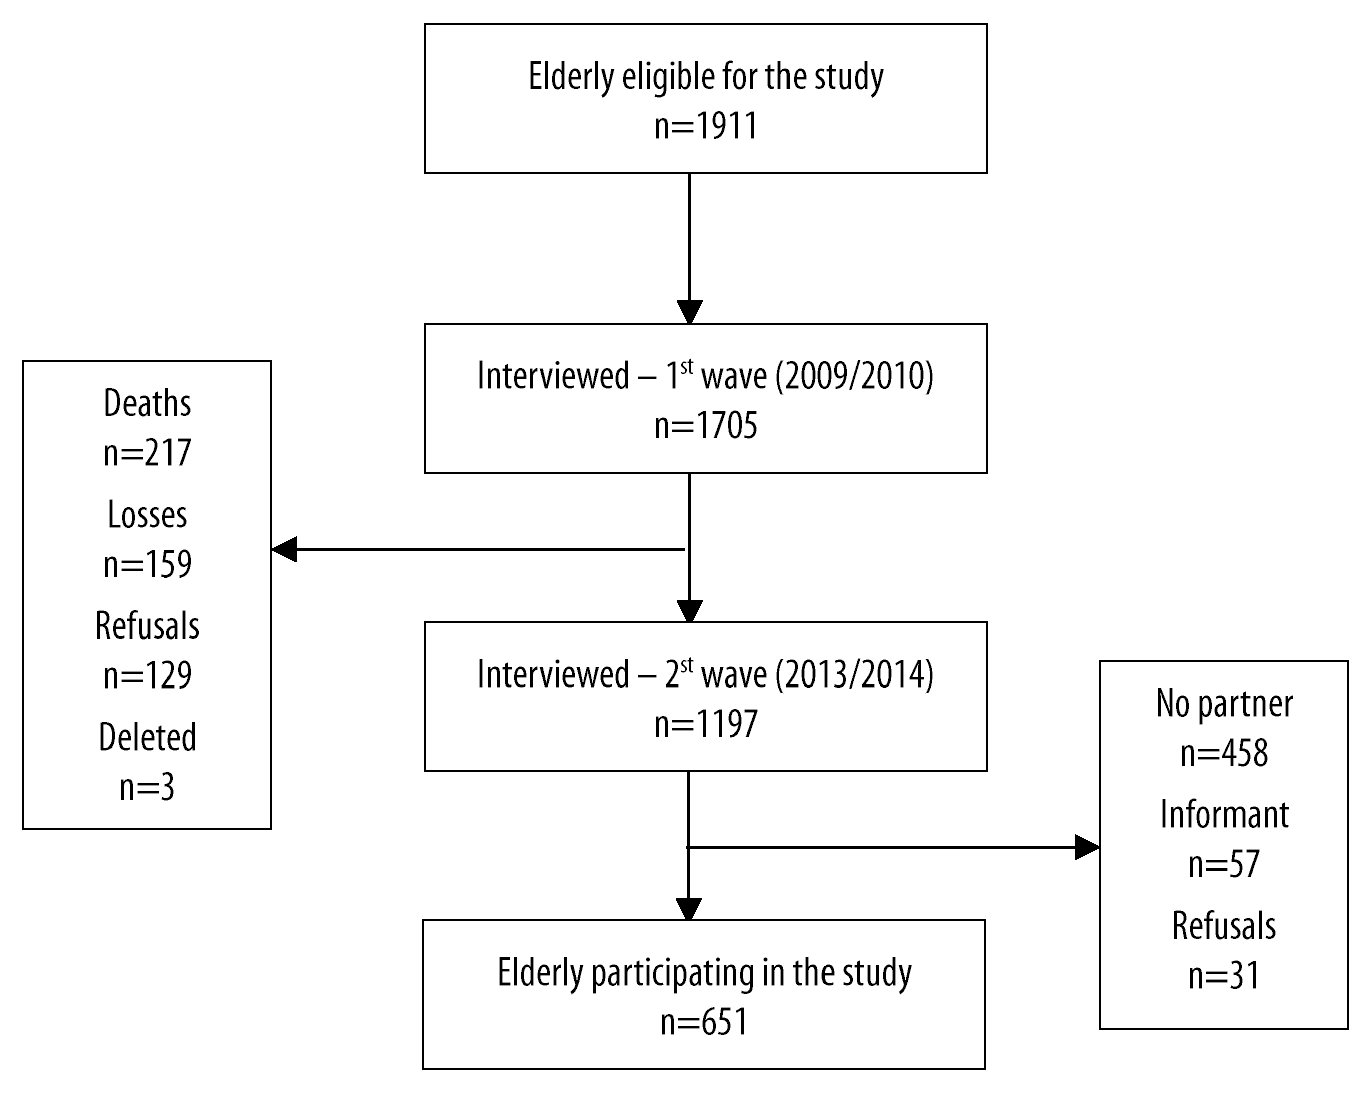
A total of 1,702 elderly people were interviewed in the first wave. At baseline, 1,705 elderly people were interviewed (response proportion of 89.1%). At follow-up, 1,197 were interviewed (response ratio: 70.2%), 217 died, 159 represented losses, 129 refusals, 3 were excluded, 2 due to duplicity and 1 due to incompatible age at baseline, with a response rate of 54.4% (Figure 1).
When comparing elderly people included in our study (n=651) with those who were not included (n=546), statistically significant differences were found regarding gender, income, schooling and health conditions. With regard to those not included, 85.5% were female, 53.6% had up to 4 years of schooling and 65.1% reported income of up to 5 minimum wages. The proportion of elderly people with cognitive deficit (36.0% versus 17.0%), depressive symptoms (22.6% versus 17.6%) and some degree of ADL dependency (74.5% versus 64.9%) was higher among those who were not included when compared to those who were included.
The characteristics of the sample are described in Table 1, stratified by sex. With regard to males, 38.1% (n=138 - 95%CI 31.1;45.0) had family income between 1 and 5 minimum wages and 36.9% (n=120 - 95%CI 29.8;44.0) had 12 or more years of schooling. As for females, 50.8% (n=144 - 95%CI 43.2;58.3) reported family income between 1 and 5 minimum wages and 31.8% (n=106 - 95%CI 24.6;38.9) had 1 to 4 years of schooling.
Table 1 Characteristics of the elderly (n=651) according to sociodemographic and economic variables, stratified by sex, Florianópolis, Santa Catarina, Brazil, 2013/2014
| Variables | Male sex | Female sex | ||
|---|---|---|---|---|
| n (%) | 95%CIa | n (%) | 95%CIa | |
| Age group (years) | n=340 | n=311 | ||
| 60-69 | 135 (37.5) | 30.6;44.4 | 148 (47.3) | 41.0;53.6 |
| 70-79 | 146 (45.1) | 37.4;52.8 | 129 (41.8) | 35.5;48.0 |
| ≥80 | 59 (17.4) | 12.6;22.2 | 34 (10.9) | 5.8;16.0 |
| Marital status | n=340 | n=311 | ||
| Married/has a partner | 325 (95.3) | 91.8;98.8 | 288 (93.0) | 89.6;96.3 |
| Single | 4 (0.9) | 0.0;1.9 | 5 (1.4) | 0.0;2.8 |
| Divorced/separated | 7 (1.8) | 0.2;3.3 | 5 (1.3) | 0.1;2.4 |
| Widowed | 4 (2.0) | 0.0;5.0 | 13 (4.3) | 1.7;6.9 |
| Race/skin color | n=340 | n=311 | ||
| White | 285 (84.0) | 78.4;89.6 | 273 (88.1) | 82.7;93.6 |
| Black | 32 (9.5) | 5.7;13.4 | 23 (7.5) | 3.0;11.9 |
| Brown/yellow/indigenous | 23 (6.3) | 2.3;10.3 | 14 (4.3) | 1.3;7.3 |
| Cohabitation | n=339 | n=311 | ||
| Alone | 17 (4.6) | 2.1;7.0 | 13 (4.0) | 1.4;6.6 |
| Spouse/family members | 322 (95.4) | 92.9;97.8 | 297 (96.0) | 93.3;98.6 |
| Schooling (years of study) | n=340 | n=311 | ||
| No formal schooling | 23 (5.7) | 27.2;86.5 | 13 (3.2) | 13.8;49.7 |
| 1-4 | 90 (22.7) | 16.8;28.4 | 106 (31.8) | 24.6;38.9 |
| 5-8 | 54 (15.6) | 11.4;19.9 | 59 (18.9) | 13.7;23.9 |
| 9-11 | 53 (19.1) | 14.6;23.6 | 58 (20.1) | 13.9;26.4 |
| ≥12 | 120 (36.9) | 29.8;44.0 | 75 (26.0) | 19.8;32.2 |
| Family income (in minimum wages) | n=329 | n=290 | ||
| Less than 1 | 9 (3.3) | 0.0;6.6 | 15 (4.2) | 1.6;6.7 |
| Between 1 and 5 | 138 (38.1) | 31.1;45.0 | 144 (50.8) | 43.2;58.3 |
| Between 5 and 10 | 77 (24.8) | 19.4;30.1 | 76 (26.1) | 20.2;32.0 |
| More than 10 | 105 (33.8) | 26.7;40.9 | 55 (18.9) | 12.7;25.1 |
| Others dependent on elderly person’s income | n=337 | n=223 | ||
| No | 71 (20.6) | 13.4;27.7 | 129 (54.8) | 46.1;63.3 |
| Yes | 266 (79.4) | 72.2;86.5 | 94 (45.2) | 36.6;53.8 |
| Paid work | n=337 | n=225 | ||
| No | 277 (81.0) | 73.8;88.1 | 201 (90.0) | 85.7;94.2 |
| Yes | 60 (19.0) | 11.8;26.2 | 24 (10.0) | 5.8;14.2 |
| Self-perception of health | n=340 | n=311 | ||
| Very good/good | 226 (68.2) | 62.3;74.2 | 171 (60.6) | 53.4;67.8 |
| Regular | 117 (26.6) | 20.8;32.4 | 117 (33.4) | 27.1; 39.6 |
| Poor/very poor | 16 (5.2) | 1.6;8.6 | 23 (6.0) | 30.9;89.4 |
| Depressive symptoms | n=338 | n=310 | ||
| Normal | 289 (85.8) | 80.9;90.6 | 245 (80.9) | 75.2;96.5 |
| Suspected depression | 49 (14.2) | 9.3;19.1 | 65 (19.1) | 13.4;24.8 |
| Cognitive deficit | n=340 | n=308 | ||
| Negative | 289 (87.2) | 81.3;93.2 | 246 (80.0) | 74.5;85.4 |
| Positive | 51 (12.8) | 6.7;18.7 | 62 (20.0) | 14.5; 25.4 |
| ADLb dependency | n=338 | n=311 | ||
| None | 145 (43.1) | 37.5;48.8 | 83 (26.5) | 20.6;32.5 |
| Mild | 134 (39.7) | 33.7;45.6 | 139 (47.2) | 40.7;53.7 |
| Moderate/severe | 59 (17.2) | 13.1;21.2 | 89 (26.3) | 21.6;30.9 |
| Morbidities | n=340 | n=311 | ||
| None/one | 104 (32.7) | 27.2;38.2 | 57 (20.7) | 14.9;26.4 |
| Two or more | 236 (67.3) | 61.7;72.8 | 254 (79.3) | 73.5;85.0 |
| Alcoholic beverage consumption | n=340 | n=311 | ||
| Never | 128 (35.1) | 27.6;42.6 | 203 (63.6) | 56.3;70.7 |
| Moderate | 95 (29.3) | 23.2;35.4 | 82 (26.9) | 20.0;33.7 |
| High | 117 (35.6) | 29.0;42.0 | 26 (9.5) | 4.5;14.5 |
| Smoking habit | n=340 | n=311 | ||
| Never smoked | 116 (32.7) | 26.3;39.1 | 235 (74.7) | 68.8;80.6 |
| Former smoker | 187 (56.0) | 49.3;62.4 | 62 (21.1) | 49.3;62.4 |
| Currently smokes | 37 (11.3) | 7.0;15.6 | 14 (4.2) | 1.1;7.2 |
a) 95%CI: 95% Confidence interval; b) ADL: Activity of daily living.
The main characteristics of the male and female sexes, respectively, were: being married (95.3% and 93.0%), being of white race/skin color (84.0% and 88.1%), living with a spouse or family members (95.4% and 96.0%), having no current paid work (81.0% and 90.0%), having very good/good self-perceived health (68.2% and 60.6%), having two or more morbidities (67.3% and 79.3%), having no depressive symptoms (85.8% and 80.9%) and no cognitive deficit (87.2% and 80.0%). 43.1% (n=145 - 95%CI 37.5;48.8) of males had no ADL dependency, while among females, 47.2% (n=139 - 95%CI 40.7;53.7) had mild ADL dependency. Regarding alcohol and smoking, 63.3% (n=203 - 95%CI 56.3;70.7) of the elderly women reported never having drunk and 74.7% (n=235 - 95%CI 68.8;80.6) never having smoked, while among the elderly men, 35.6% (n=117 - 95%CI 29.0;42.0) reported high alcohol consumption and 56.0% (n=187 - 95%CI 49.3;62.4) were former smokers (Table 1).
Psychological violence was predominant among the acts of intimate partner violence, whether it was suffered (48.3% and 44.8%) or perpetrated (49.8% and 44.5%), when compared to physical violence suffered (2.2% and 3.9%) or perpetrated (2.0% and 3.6%) (the latter in lower proportions), among the elderly males and females, respectively. Most of the elderly people in situations of physical violence were also exposed to psychological violence by intimate partners, evidencing the overlapping of violence (Table 2). It is noteworthy that there was no difference between the prevalence of the different types of intimate partner violence suffered, perpetrated and bidirectional, when stratified by sex.
Table 2 Prevalence of intimate partner violence among elderly people (n=651) according to violence typology and directionality, stratified by sex, Florianópolis, Santa Catarina, Brazil, 2013/2014
| Violence type and directionality | Male sex (n=340) | Female sex (n=311) | p-value | ||
|---|---|---|---|---|---|
| n | % (95%CI)a | n | % (95%CI)a | ||
| Any act of intimate partner violence | |||||
| Suffered | 162 | 48.3 (42.0;54.5) | 148 | 46.4 (39.6;53.2) | 0.47b |
| Perpetrated | 167 | 50.3 (43.1;57.3) | 144 | 45.1 (38.5;51.8) | 0.20b |
| Bidirectional | 145 | 42.9 (37.1;48.7) | 125 | 38.4 (31.8;44.9) | 0.18b |
| Intimate partner violence - psychological | |||||
| Suffered | 162 | 48.3 (42.0;54.5) | 144 | 44.8 (38.0;51.7) | 0.22b |
| Perpetrated | 166 | 49.8 (42.8;56.6) | 142 | 44.5 (38.0;50.9) | 0.17b |
| Bidirectional | 145 | 42.9 (37.1;48.7) | 123 | 37.7 (31.2;44.1) | 0.12b |
| Intimate partner violence - physical | |||||
| Suffered | 10 | 2.2 (0.7;3.5) | 13 | 3.9 (1.4;6.5) | 0.26c |
| Perpetrated | 8 | 2.0 (0.4;3.5) | 12 | 3.6 (0.9;6.3) | 0.18c |
| Bidirectional | 4 | 0.8 (0.0;1.8) | 8 | 2.4 (0.4;4.5) | 0.15c |
| Intimate partner violence - physical and psychological | |||||
| Suffered | 10 | 2.2 (0.7;3.5) | 9 | 2.3 (0.4;4.3) | 0.57c |
| Perpetrated | 7 | 1.5 (0.3;2.7) | 10 | 3.0 (0.6;5.3) | 0.24c |
| Bidirectional | 4 | 0.8 (0.0;1.8) | 6 | 1.8 (0.0;3.6) | 0.32c |
a) 95%CI: 95% Confidence interval; b) Pearson’s chi-square test; c) Fisher’s exact test.
In the unadjusted analysis, among males poor/very poor self-perceived health was associated with perpetrated violence (PR=1.73 - 95%CI 1.25;2.40). Among females, being divorced/separated (PR=1.87 - 95%CI 1.31;2.66) and regular self-perceived health (PR=1.67 - 95%CI 1.24; 2.25) were associated with prevalence of perpetrated violence. There was no association between the variables investigated and violence suffered among the elderly of either sex (Table 3).
Table 3 Unadjusted prevalence ratios for suffered and perpetrated intimate partner violence, (n=651), according to sociodemographic, economic and health condition variables, Florianópolis, Santa Catarina, Brazil, 2013/2014
| Variables | Suffered violence | Perpetrated violence | ||
|---|---|---|---|---|
| Male sex | Female sex | Male sex | Female sex | |
| PRa (95%CI)b | PRa (95%CI)b | PRa (95%CI)b | PRa (95%CI)b | |
| Age group (years) | ||||
| 60-69 | 1.00 | 1.00 | 1.00 | 1.00 |
| 70-79 | 0.85 (0.62;1.16) | 0.94 (0.69;1.28) | 0.87 (0.65;1.14) | 0.68 (0.48;0.97) |
| ≥80 | 0.69 (0.45;1.07) | 0.93 (0.57;1.52) | 0.59 (0.37;0.93) | 0.53 (0.29;0.95) |
| Race/skin color | ||||
| White | 1.00 | 1.00 | 1.00 | 1.00 |
| Black | 1.14 (0.79;1.64) | 0.65 (0.35;1.21) | 0.92 (0.51;1.41) | 0.62 (0.33;1.16) |
| Brown/yellow/indigenous | 1.16 (0.64;2.11) | 1.34 (0.89;2.02)c | 1.43 (1.06;1.93)c | 1.38 (0.90;2.11)c |
| Marital status | ||||
| Married/has a partner | 1.00 | 1.00 | 1.00 | 1.00 |
| Single | 0.54 (0.11;2.52) | 0.89 (0.24;3.34) | 1.24 (0.53;2.92) | 0.92 (0.24;3.43) |
| Divorced/separated | 0.42 (0.10;1.72) | 0.98 (0.35;2.73) | 0.74 (0.34;1.64) | 1.87 (1.31;2.66) |
| Widowed | 0.13 (0.01;1.53)a | 0.79 (0.33;1.91) | 1.66 (1.12;2.47)c | 0.45 (0.16;1.27)c |
| Cohabitation | ||||
| Alone | 1.00 | 1.00 | 1.00 | 1.00 |
| Spouse/family members | 1.52 (0.68;3.39) | 1.11 (0.48;2.57) | 1.11 (0.61;20.1) | 1.93 (0.72;5.19)c |
| Schooling (years of study) | ||||
| No formal schooling | 1.00 | 1.00 | 1.00 | 1.00 |
| 1-4 | 0.78 (0.47;1.30) | 0.94 (0.50;1.76) | 0.84 (0.50;1.41) | 1.03 (0.53;1.99) |
| 5-8 | 0.90 (0.52;1.54) | 0.68 (0.32;1.42) | 1.10 (0.65;1.86) | 0.79 (0.38;1.66) |
| 9-11 | 0.73 (0.39;1.37) | 1.00 (0.52;1.92) | 0.96 (0.53;1.73) | 1.09 (0.51;2.32) |
| ≥12 | 0.86 (0.52;1.41) | 0.87 (0.45;1.67) | 0.89 (0.55;1.46) | 0.90 (0.46;1.76) |
| Family income (in minimum wages) | ||||
| Less than 1 | 1.00 | 1.00 | 1.00 | 1.00 |
| Between 1 and 5 | 2.50 (0.47;13.0) | 1.12 (0.64;1.97) | 3.94 (0.84;18.44) | 1.06 (0.60;1.88) |
| Between 5 and 10 | 2.15 (0.39;11.62) | 0.87 (0.51;1.48) | 3.98 (0.86;18.38) | 0.90 (0.52;1.58) |
| More than 10 | 2.57 (0.50;12.97) | 0.86 (0.44;1.68) | 3.99 (0.84;19.03) | 0.88 (0.41;1.88) |
| Others dependent on elderly person’s income | ||||
| No | 1.00 | 1.00 | 1.00 | 1.00 |
| Yes | 1.07 (0.78;1.47) | 1.02 (0.71;1.45) | 0.89 (0.62;1.28) | 1.13 (0.82;1.55) |
| Paid work | ||||
| No | 1.00 | 1.00 | 1.00 | 1.00 |
| Yes | 0.79 (0.54;1.16) | 1.27 (0.78;2.05) | 1.19 (0.81;1.75) | 1.22 (0.76;1.95) |
| Self-perception of health | ||||
| Very good/good | 1.00 | 1.00 | 1.00 | 1.00 |
| Regular | 1.14 (0.88;1.47) | 1.44 (1.02;2.03) | 1.05 (0.80;1.38) | 1.67 (1.24;2.25) |
| Poor/very poor | 0.92 (0.39;2.18) | 0.98 (0.52;1.87)c | 1.73 (1.25;2.40)c | 1.04 (0.58;1.89)c |
| Depressive symptoms | ||||
| Normal | 1.00 | 1.00 | 1.00 | 1.00 |
| Suspected depression | 0.96 (0.64;1.46) | 1.13 (0.77;1.65) | 1.14 (0.84;1.55) | 1.32 (0.88;1.97)c |
| Cognitive deficit | ||||
| Negative | 1.00 | 1.00 | 1.00 | 1.00 |
| Positive | 0.95 (0.71;1.27) | 0.89 (0.59;1.34) | 0.74 (0.48;1.13)c | 1.03 (0.68;1.56) |
| Dependence on ADL | ||||
| None | 1.00 | 1.00 | 1.00 | 1.00 |
| 1-3 | 0.99 (0.72;1.35) | 0.98 (0.68;1.41) | 0.86 (0.64;1.15) | 0.94 (0.67;1.32) |
| 4 or more | 1.00 (0.64;1.57) | 1.11 (0.75;1.66) | 1.15 (0.84;1.56) | 1.05 (0.76;1.44) |
| Morbidities | ||||
| None/one | 1.00 | 1.00 | 1.00 | 1.00 |
| Two or more | 1.01 (0.81;1.25) | 1.14 (0.81;1.61) | 1.19 (0.93;1.52)c | 0.97 (0.67;1.42) |
| Alcoholic beverage consumption | ||||
| Never | 1.00 | 1.00 | 1.00 | 1.00 |
| Moderate | 1.33 (0.98;1.81) | 1.20 (0.93;1.56) | 1.00 (0.72;1.40) | 1.19 (0.90;1.59) |
| High | 1.21 (0.87;1.70)c | 1.23 (0.81;189) | 1.12 (0.80;1.58) | 1.27 (0.81;1.99) |
| Smoking habit | ||||
| Never smoked | 1.00 | 1.00 | 1.00 | 1.00 |
| Former smoker | 0.93 (0.71;1.22) | 1.01 (0.76;1.34) | 1.05 (0.76;1.44) | 0.96 (0.70;1.33) |
| Currently smokes | 0.88 (0.52;1.47) | 1.42 (0.97;2.09)c | 1.08 (0.73;1.61) | 1.05 (0.58;1.87) |
a) PR: Prevalence ratio; b) 95%CI: 95% Confidence interval; c) P-value <0.20; d) ADL: Activity of daily living.
In the adjusted analysis, the associations that had been found in the unadjusted model remained similar. There was association between prevalence of intimate partner violence among males with poor/very poor self-perceived health (PR=1.74 - 95%CI 1.18;2.58). Females who were separated/divorced (PR=1.86 - 95%CI 1.15;3.02) and who had regular self-perceived health (PR=1.53 - 95%CI 1.12;2.08) had positive association with intimate partner violence (Table 4).
Table 4 Adjusted prevalence ratios for intimate partner violence suffered and perpetrated be elderly people (n=651), according to sociodemographic, economic and health condition variables, Florianópolis, Santa Catarina, Brazil, 2013/2014
| Variables | Suffered violence | Perpetrated violence | ||
|---|---|---|---|---|
| Male sex | Female sex | Male sex | Female sex | |
| PRa (95%CI)b | PRa (95%CI)b | PRa (95%CI)b | PRa (95%CI)b | |
| Age group (years) | ||||
| 60-69 | 1.00 | 1.00 | 1.00 | 1.00 |
| 70-79 | 0.85 (0.62;1.16) | 0.94 (0.69;1.28) | 0.87 (0.65;1.14) | 0.68 (0.48;0.97) |
| ≥80 | 0.69 (0.45;1.07) | 0.93 (0.57;1.52) | 0.59 (0.37;0.93) | 0.53 (0.29;0.95) |
| Race/skin color | ||||
| White | 1.00 | 1.00 | 1.00 | 1.00 |
| Black | 1.14 (0.79;1.64) | 0.65 (0.35;1.21) | 0.92 (0.51;1.41) | 0.62 (0.33;1.16) |
| Brown/yellow/indigenous | 1.16 (0.64;2.11) | 1.34 (0.89;2.02)c | 1.43 (1.06;1.93)c | 1.38 (0.90;2.11)c |
| Marital status | ||||
| Married/has a partner | 1.00 | 1.00 | 1.00 | 1.00 |
| Single | 0.54 (0.11;2.52) | 0.89 (0.24;3.34) | 1.24 (0.53;2.92) | 0.92 (0.24;3.43) |
| Divorced/separated | 0.42 (0.10;1.72) | 0.98 (0.35;2.73) | 0.74 (0.34;1.64) | 1.87 (1.31;2.66) |
| Widowed | 0.13 (0.01;1.53)a | 0.79 (0.33;1.91) | 1.66 (1.12;2.47)c | 0.45 (0.16;1.27)c |
| Cohabitation | ||||
| Alone | 1.00 | 1.00 | 1.00 | 1.00 |
| Spouse/family members | 1.52 (0.68;3.39) | 1.11 (0.48;2.57) | 1.11 (0.61;20.1) | 1.93 (0.72;5.19)c |
| Schooling (years of study) | ||||
| No formal schooling | 1.00 | 1.00 | 1.00 | 1.00 |
| 1-4 | 0.78 (0.47;1.30) | 0.94 (0.50;1.76) | 0.84 (0.50;1.41) | 1.03 (0.53;1.99) |
| 5-8 | 0.90 (0.52;1.54) | 0.68 (0.32;1.42) | 1.10 (0.65;1.86) | 0.79 (0.38;1.66) |
| 9-11 | 0.73 (0.39;1.37) | 1.00 (0.52;1.92) | 0.96 (0.53;1.73) | 1.09 (0.51;2.32) |
| ≥12 | 0.86 (0.52;1.41) | 0.87 (0.45;1.67) | 0.89 (0.55;1.46) | 0.90 (0.46;1.76) |
| Family income (in minimum wages) | ||||
| Less than 1 | 1.00 | 1.00 | 1.00 | 1.00 |
| Between 1 and 5 | 2.50 (0.47;13.0) | 1.12 (0.64;1.97) | 3.94 (0.84;18.44) | 1.06 (0.60;1.88) |
| Between 5 and 10 | 2.15 (0.39;11.62) | 0.87 (0.51;1.48) | 3.98 (0.86;18.38) | 0.90 (0.52;1.58) |
| More than 10 | 2.57 (0.50;12.97) | 0.86 (0.44;1.68) | 3.99 (0.84;19.03) | 0.88 (0.41;1.88) |
| Others dependent on elderly person’s income | ||||
| No | 1.00 | 1.00 | 1.00 | 1.00 |
| Yes | 1.07 (0.78;1.47) | 1.02 (0.71;1.45) | 0.89 (0.62;1.28) | 1.13 (0.82;1.55) |
| Paid work | ||||
| No | 1.00 | 1.00 | 1.00 | 1.00 |
| Yes | 0.79 (0.54;1.16) | 1.27 (0.78;2.05) | 1.19 (0.81;1.75) | 1.22 (0.76;1.95) |
| Self-perception of health | ||||
| Very good/good | 1.00 | 1.00 | 1.00 | 1.00 |
| Regular | 1.14 (0.88;1.47) | 1.44 (1.02;2.03) | 1.05 (0.80;1.38) | 1.67 (1.24;2.25) |
| Poor/very poor | 0.92 (0.39;2.18) | 0.98 (0.52;1.87)c | 1.73 (1.25;2.40)c | 1.04 (0.58;1.89)c |
| Depressive symptoms | ||||
| Normal | 1.00 | 1.00 | 1.00 | 1.00 |
| Suspected depression | 0.96 (0.64;1.46) | 1.13 (0.77;1.65) | 1.14 (0.84;1.55) | 1.32 (0.88;1.97)c |
| Cognitive deficit | ||||
| Negative | 1.00 | 1.00 | 1.00 | 1.00 |
| Positive | 0.95 (0.71;1.27) | 0.89 (0.59;1.34) | 0.74 (0.48;1.13)c | 1.03 (0.68;1.56) |
| Dependence on ADL | ||||
| None | 1.00 | 1.00 | 1.00 | 1.00 |
| 1-3 | 0.99 (0.72;1.35) | 0.98 (0.68;1.41) | 0.86 (0.64;1.15) | 0.94 (0.67;1.32) |
| 4 or more | 1.00 (0.64;1.57) | 1.11 (0.75;1.66) | 1.15 (0.84;1.56) | 1.05 (0.76;1.44) |
| Morbidities | ||||
| None/one | 1.00 | 1.00 | 1.00 | 1.00 |
| Two or more | 1.01 (0.81;1.25) | 1.14 (0.81;1.61) | 1.19 (0.93;1.52)c | 0.97 (0.67;1.42) |
| Alcoholic beverage consumption | ||||
| Never | 1.00 | 1.00 | 1.00 | 1.00 |
| Moderate | 1.33 (0.98;1.81) | 1.20 (0.93;1.56) | 1.00 (0.72;1.40) | 1.19 (0.90;1.59) |
| High | 1.21 (0.87;1.70)c | 1.23 (0.81;189) | 1.12 (0.80;1.58) | 1.27 (0.81;1.99) |
| Smoking habit | ||||
| Never smoked | 1.00 | 1.00 | 1.00 | 1.00 |
| Former smoker | 0.93 (0.71;1.22) | 1.01 (0.76;1.34) | 1.05 (0.76;1.44) | 0.96 (0.70;1.33) |
| Currently smokes | 0.88 (0.52;1.47) | 1.42 (0.97;2.09)c | 1.08 (0.73;1.61) | 1.05 (0.58;1.87) |
a) PR: Final model prevalence ratios, model adjusted for age, schooling and income; b) 95%CI: 95% Confidence interval; c) P-value <0.05.
Discussion
Prevalence of suffered, perpetrated and bidirectional intimate partner violence was found to be high among elderly women and men, with no difference between the sexes. Gender symmetry with regard to intimate partner violence was found in all violence directionalities analyzed. There was a higher prevalence of perpetrated violence among elderly women who were divorced/separated and those who had regular self-perceived of health. It was also higher among in elderly men with poor/very poor self-perceived health.
Some limitations were identified in this study. Its cross-sectional design prevents identification of causal relationships between the variables explored. Not investigating the occurrence of economic abuse and controlling behavior between partners may mean that prevalence was underestimated among the elderly. High losses, due to many respondents not having partners, reduced the response rate in the study sample, as well as the biases identified in the losses.
It is noteworthy that differences between the elderly included in the study sample and those not included may limit identification of factors associated with intimate partner violence, considering that the elderly who did not participate in the study had greater socioeconomic vulnerabilities (less schooling and lower income) and health vulnerabilities, such as higher prevalence of cognitive deficit, depressive symptoms, and dependency regarding ADL. With regard to the object of study, i.e. intimate partner violence, it is recognized that groups that are more vulnerable may be more exposed to violence and, in these cases, the phenomenon would be more difficult to detect. We highlight the scarcity of national studies on intimate partner violence among the elderly, which hindered its comparability with investigations on the subject in similar cultural settings in Brazil, centralizing the discussion of the research results on their comparison with the findings of international studies.
As for the predominance of psychological violence over physical violence, a study conducted in the United States in 2010 investigated the prevalence of violence against elderly people over 70 years old.21 The results corroborate those of the present study, by identifying 12.1% psychological violence and 1.7% physical violence, among elderly men and women. In most cases of physical violence suffered, there was also psychological violence, indicating overlapping forms of aggression. Another North American study, which focused on the prevalence and characteristics of intimate partner violence suffered by women over 65 years old, corroborated the overlapping of violence observed in Florianópolis: according to that study, 68.5% of the women who reported their partners having controlling behavior were also affected by other types of abuse.11
Physical and psychological violence perpetrated by both sexes, in similar proportions, is reaffirmed by a study conducted in Belgium in 2009 with a national population-based sample.22 However, other studies that included elderly people and analyzed intimate partner violence, stratified by sex, found higher prevalence of physical violence against women and psychological violence against men.23 The similar proportions of intimate partner violence we identified are confirmed by yet another study,24 conducted with adults in Florianópolis (the EpiFloripa Adulto 2009/2010 study), according to which women committed as many acts of moderate physical violence as men. Thus, it is suggested that intimate partner violence is not a new phenomenon among the elderly, but rather occurs and is perpetuated throughout life.
Regarding ‘gender symmetry’ having been found, it reveals a scenario in which violence is ingrained, whether in social structures or in the family context. However, the violent behavior and attitudes used to solve conflicts, recognized as being present in violence between couples,25 distance themselves from the common understanding of the ‘victim-offender’ binomial.26 Such symmetry does not necessarily represent equal situations in relation to the frequency, motivations and consequences of aggression.27 A national study also conducted in Florianópolis, investigating association between quality of life and exposure to intimate partner violence among the elderly, showed unequal impacts on the sexes: only women had their quality of life compromised when they were victims and/or perpetrators of this violence.28 It is understood that differences between women and men’s experiences of violence certainly exist, and in order to achieve a detailed understanding of the phenomenon, it is necessary to investigate this outcome in both genders.
The high prevalence of intimate partner violence found in this study contradicts findings that often identify family members and caregivers as the main aggressors of the elderly. A study on the risk of violence against the elderly conducted in Florianópolis, part of the second wave of the EpiFloripa Idoso project (2013/2014),13 identified the male spouse as the aggressor, within the category of ‘family member’, but without specifically addressing intimate partner violence. Violence in intimate relationships among the elderly requires close examination, since old age brings issues of confrontation arising from the health conditions proper to aging, including an increased proportion of suicides.29
Regarding associated factors, the predominance of one-sided analyses of violence, in which only victims are investigated, indicates that the correlations of these factors with the perpetration of intimate partner violence are still under-analyzed and little explored in the literature.
Incidentally, a systematic review of population-based studies conducted in 2017 identified association between intimate partner violence, (i) alcohol use, and (ii) functional impairment.10 These forms of association were not found in our study. Egarding alcohol use, although research with older adults associates this behavior with intimate partner violence,10 a cohort study (EpiFloripa Idoso, 2009/2010 and 2013/2014) conducted in Florianópolis indicated that when asked about the frequency of alcohol consumption, the majority of respondents (64.2%) stated that they ‘never’ used alcohol. That study also identified high prevalence of morbidities (56.7%) and substantially increased cardiovascular risk (52.4%).30 It is assumed that in this context, frequent use of medication and medical restrictions lead the elderly to drink alcohol in smaller proportions.
The fact that functional impairment was not an associated factor in this study may be related to the reduction of physical violence followed by an increase in psychological violence, depending on the physical limitations present. However, it draws attention to the perpetuation of violent behavior in aging, although the way it manifests itself throughout life changes as age increases.
Regarding associated factors, proximal variables of the outcome need to be included in the analysis models, for example: previous exposure to violence, personal characteristics regarding personality and behavior, or satisfaction in the intimate relationship. Furthermore, it is suggested that commonly used factors associated with intimate partner violence are found in studies conducted with the adult population, but are not the most relevant when it comes to the elderly. Thus, it is recommended that conceptual models unique to older age be established.
This study is relevant in analyzing intimate partner violence in an age group little explored in the literature. Both the prevalence and the analysis of associated factors were conducted in a stratified manner, by gender and directionality of violence. Such distinctions allow more in-depth knowledge to be gained about the theme, the occurrence and distribution of violence among the elderly. The use of the last year as the recall period helps prevent memory bias and consequently reduces underreporting of prevalence, as well as avoiding overlapping of violence that occurred in other periods of life.
Investigating intimate partner violence based on a representative population-based sample, using a widely validated and highly reliable instrument, i.e. the Conflict Tactics Scales Form R (CTS-1), favors reliable results being obtained that point to gender symmetry, regarding involvement in situations of violence in intimate partner relationships. The results found also show the need to intensify public policies that enable intimate partner violence among the elderly to be addressed.
REFERENCES
1. Duque AM, Leal MCC, Marques APO, Eskinazi FMV, Duque AM. Violência contra idosos no ambiente doméstico: prevalência e fatores associados (Recife/PE). Cienc Saude Colet. 2012;17(8):2199-208. doi: https://doi.org/10.1590/S1413-81232012000800030. [ Links ]
2. Krug EG, Mercy JA, Dahlberg LL, Zwi AB. The world report on violence and health. Lancet. 2002;360 Oct 5;360(9339):1083-8. doi: https://doi.org/10.1016/S0140-6736(02)11133-0. [ Links ]
3. Stöckl H, Penhale B. Intimate partner violence and its association with physical and mental health symptoms among older women in Germany. J Interpers Violence. 2015;30(17):3089-111. doi: https://doi.org/10.1177/0886260514554427. [ Links ]
4. Stöckl H, March L, Pallitto C, Garcia-Moreno C. Intimate partner violence among adolescents and young women: prevalence and associated factors in nine countries: a cross-sectional study. BMC Public Health. 2014 Jul 25;14:751. doi: https://doi.org/10.1186/1471-2458-14-751. [ Links ]
5. Whitaker DJ, Haileyesus T, Swahn M, Saltzman LS. Differences in frequency of violence and reported injury between relationships with reciprocal and nonreciprocal intimate partner violence. Am J Public Health. 2007;97(5):941-7. doi: https://doi.org/10.2105/AJPH.2005.079020. [ Links ]
6. World Health Organization. Global and regional estimates of violence against women: prevalence and health effects of intimate partner violence and non-partner sexual violence. [Geneva]: WHO; 2013. [ Links ]
7. Desmarais SL, Reeves KA, Nicholls TL, Telford RO, Fiebert MS. Prevalence of physical violence in intimate relationships, part 1: rates of male and female victimization. Partner Abuse. 2012;3(2):1-6. doi: https://doi.org/10.1891/1946-6560.3.2.140. [ Links ]
8. Afifi TO, Henriksen CA, Asmundson GJG, Sareen J. Victimization and perpetration of intimate partner violence and substance use disorders in a nationally representative sample. J Nerv Ment Dis. 2012;200(8):684-91. doi: https://doi.org/10.1097/NMD.0b013e3182613f64. [ Links ]
9. Renner LM, Habib L, Stromquist AM, Peek-Asa C. The association of intimate partner violence and depressive symptoms in a cohort of rural couples. J Rural Health. 2014;30(1):50-8. doi: https://doi.org/10.1111/jrh.12026. [ Links ]
10. Burnes D, Pillemer K, Caccamise PL, Mason A, Henderson CR, Berman J, et al. Prevalence of and risk factors for elder abuse and neglect in the community: a population-based study. J Am Geriatr Soc. 2015;63(9):1906-12. doi: https://doi.org/10.1111/jgs.13601. [ Links ]
11. Bonomi AE, Anderson ML, Reid RJ, Carrell D, Fishman PA, Rivara FP, et al. Intimate partner violence in older women. Gerontologist. 2007;47(1):34-41. doi: https://doi.org/10.1093/geront/47.1.34. [ Links ]
12. Guedes DT, Curcio CL, Llano BA, Zunzunegui MV, Guerra R. [The gender gap in domestic violence in older adults in Latin America: the IMIAS study]. Rev Panam Salud Publica. 2015;37(4-5):293-300. [Portuguese]. PMID: 26208199. [ Links ]
13. Bolsoni CC, Coelho EBS, Giehl MWC, d'Orsi E. Prevalência de violência contra idosos e fatores associados, estudo de base populacional em Florianópolis, SC. Rev Bras Geriatr Gerontol. 2016;19(4):671-82. doi: https://doi.org/10.1590/1809-98232016019.150184. [ Links ]
14. Warmling D, Lindner SR, Coelho EBS. Prevalência de violência por parceiro íntimo em idosos e fatores associados: revisão sistemática. Cien Saude Colet. 2017;22(9):3111-3125. doi: https://doi.org/10.1590/1413-81232017229.12312017. [ Links ]
15. Instituto Brasileiro de Geografia e Estatística. Estimativas populacionais residentes, em 1. de julho de 2009, segundo os municípios. Brasília, DF; 2009 [acesso 16 dez. 2020]. Disponível em: http://www.ibge.gov.br/home/estatistica/populacao/estimativa2009/POP2009_DOU.pdf [ Links ]
16. Schneider IJC, Confortin SC, Bernardo CO, Carvalho CB, Antes DL, Pereira KG, et al. Estudo de coorte EpiFloripa Idoso: métodos, aspectos operacionais e estratégias de seguimento. Rev Saude Publica. 2017;51:104. doi: https://doi.org/10.11606/s1518-8787.2017051006776. [ Links ]
17. Hasselmann MH, Reichenheim ME. Adaptação transcultural da versão em português da Conflict Tactics Scales Form R (CTS-1), usada para aferir violência no casal: equivalências semântica e de mensuração. Cad. Saude Publica. 2003; 19(4): 1083-1093. https://doi.org/10.1590/S0102-311X2003000400030. [ Links ]
18. Folstein MF, Folstein SE, McHugh PR. "Mini-mental state": a practical method for grading the cognitive state of patients for clinician. J Psychiatr Res. 1975;12(3):189-98. doi: https://doi.org/10.1016/0022-3956(75)90026-6. [ Links ]
19. Paradela EM, Lourenço RA, Veras RP. Validação da escala de depressão geriátrica em um ambulatório geral. Rev Saude Publica. 2005;39(6):918-23. doi: https://doi.org/10.1590/S0034-89102005000600008. [ Links ]
20. Rosa TEC, Benício MHA, Latorre MRDO, Ramos LR. Fatores determinantes da capacidade funcional entre idosos. Rev Saude Publica. 2003;37(1):40-8. doi: https://doi.org/10.1590/S0034-89102003000100008. [ Links ]
21. Rosay AB, Mulford CF. Prevalence estimates and correlates of elder abuse in the united states: the national intimate partner and sexual violence survey. J Elder Abuse Negl. 2017;29(1):1-14. doi: https://doi.org/10.1080/08946566.2016.1249817. [ Links ]
22. Hellemans S, Buysse A, De Smet O, Wietzker A. Intimate partner violence in Belgium: prevalence, individual health outcomes, and relational correlates. Psychol Belg. 2014;54(1):79-96. doi: https://doi.org/10.5334/pb.af. [ Links ]
23. Coker AL, Davis KE, Arias I, Desai S, Sanderson M, Brandt HM, et al. Physical and mental health effects of intimate partner violence for men and women. Am J Prev Med. 2002;23(4):260-8. doi: https://doi.org/10.1016/S0749-3797(02)00514-7. [ Links ]
24. Lindner SR, Coelho EBS, Bolsoni CC, Rojas PF, Boing AF. Prevalência de violência física por parceiro íntimo em homens e mulheres de Florianópolis, Santa Catarina, Brasil: estudo de base populacional. Cad Saude Publica. 2015;31(4):815-26. doi: http://dx.doi.org/10.1590/0102-311X00159913. [ Links ]
25. Johnson MP. Conflict and control: gender symmetry and asymmetry in domestic violence. Violence Against Women. 2006;12(11):1003-18. doi: https://doi.org/10.1177/1077801206293328. [ Links ]
26. Próspero M. The effect of coercion on aggression and mental health among reciprocally violent couples. J Fam Violence. 2008;23(3):195-202. doi: https://doi.org/10.1007/s10896-007-9143-6. [ Links ]
27. Casimiro C. Violências na conjugalidade: a questão da simetria do género. Anal Soc. 2008:43(188):579-601. [ Links ]
28. Warmling D, Araújo CAH, Lindner SR, Coelho EBS. Qualidade de vida de mulheres e homens idosos em situação de violência por parceiro íntimo. Rev Bras Geriatr Gerontol. 2021;24(6):e200268. doi: https://doi.org/10.1590/1981-22562020024.200268. [ Links ]
29. Plazaola-Castaño J, Ruiz-Perez I, Escribá-Agüir V, Montero-Piñar I, Vives-Cases C. The assessment of intimate partner violence in Spanish women: the index of spouse abuse. J Interpers Violence. 2011;26(16):3267-88. doi: https://doi.org/10.1177/0886260510393005. [ Links ]
30. Confortin SC, Schneider IJC, Antes DL, Cembranel F, Ono LM, Marques LP, et al. Condições de vida e saúde de idosos: resultados do estudo de coorte EpiFloripa Idoso. Epidemiol Serv Saude. 2017;26(2):305-17. doi: https://doi.org/10.5123/s1679-49742017000200008. [ Links ]
*Article derived from the academic Ph.D. thesis entitled ‘Intimate partner violence and quality of life among elderly people living in Florianópolis, Santa Catarina, Brazil: a population-based study’, defended by Deise Warmling at the Federal University of Santa Catarina Postgraduate Program in Public Health, on July 10th, 2018. Study funded with resources provided by the National Council for Scientific and Technological Development/Ministry of Science, Technology and Innovation: File No. 569834/2008-2.
Received: December 17, 2020; Accepted: July 04, 2021
 Este é um artigo publicado em acesso aberto sob uma licença Creative Commons
