


Servicios Personalizados
Revista

Articulo
 texto en
  Inglés (pdf)
 Articulo en XML
 Referencias del artículo
 Enviar articulo por email
Indicadores
-
 Citado por SciELO
Links relacionados
-
 Similares en
SciELO
Similares en
SciELO
Compartir

 Permalink
Epidemiologia e Serviços de Saúde
versión impresa ISSN 1679-4974versión On-line ISSN 2237-9622
Epidemiol. Serv. Saúde vol.31 no.1 Brasília 2022 Epub 23-Mar-2022
http://dx.doi.org/10.1590/s1679-49742022000100014
Original article
Mortality from neglected tropical diseases in the state of Piauí, Northeast Brazil: temporal trend and spatial patterns, 2001-2018
1Universidade Federal do Ceará, Programa de Pós-Graduação em Saúde Pública, Fortaleza, CE, Brazil
2Universidade Federal do Ceará, Departamento de Saúde Comunitária, Fortaleza, CE, Brazil
Objetive
To analyze temporal trends and spatial patterns of mortality due to neglected tropical diseases (NTDs) in Piauí, Brazil, 2001-2018.
Methods
This was a mixed ecological study, with risk ratio (RR) calculation, spatiotemporal trend analysis, Poisson joinpoint regression, using data from the Mortality Information System.
Results
There were 2,609 deaths due to NTDs in the period (4.60/100,000 inhabitants), 55.2% were due to Chagas’ disease. There was a higher risk of death in male (RR=1.76; 95%CI 1.25;2.46), being aged ≥60 years (RR=40.71; 95%CI 10.01;165.53), municipalities with medium vulnerability social (RR=1.76; 95%CI 1.09;2.84), smaller population size (RR=1.99; 95%CI 1.28;3.10) and the Cerrados macro-region (RR=4.51; 95%CI 2.51;8.11). There was an upward trend in mortality rates from 2001-2008 and a falling trend from 2009-2018.
Conclusion
Mortality due to NTDs in Piauí remains high, particularly due to Chagas’ disease, among groups with greater vulnerability, with concentration of higher rates in the southwest of the Semiarid macro-region and the northeast and south of the Cerrados macro-region.
Keywords: Neglected Diseases; Mortality; Time Series Studies; Spatial Analysis; Ecological Studies
Study contributions
Main results
Mortality due to neglected tropical diseases (NTDs) in Piauí was high in the period 2001-2018, principally due to Chagas’ disease, leishmaniases and leprosy, appearing more in population groups, territories and settings in which social vulnerability was greater.
Implications for services
Having knowledge of the magnitude, temporal trend and spatial distribution of deaths due to NTDs is essential for strengthening strategic prevention and control agendas within the Brazilian National Heath Systen (SUS), in order to improve the targeting of available resources.
Perspectives
The study provides a perspective of the composition of strategic and intersectoral actions for controlling NTDs, with the aim of achieving the targets of the Sustainable Development Goals/2030, especially integration between health surveillance and health care within the SUS.
Introduction
Neglected tropical diseases (NTDs) are part of a diverse group of diseases of protozoan, helminthic, bacterial, viral, fungal and parasitic origin.1,2 They are prevalent in countries and territories with tropical climates, along with situations of poverty, inequality and health inequities, although there are also records of their presence in non-endemic areas in developed countries.2 Their occurrence is associated with a significant burden of morbidity and mortality, physical disability and deformities, in addition to suffering, prejudice and stigma, and their control is a decisive factor in achieving human and social development.1,2
NTDs are present in approximately 150 countries and affect 1.7 billion people worldwide, with over 200,000 associated deaths annually.1 Brazil accounts for a considerable share of the NTD burden in Latin America, where approximately 10 thousand deaths occur annually, mainly associated with Chagas’ disease.3-5
The Northeast region of the country has stood out in terms of high NTD mortality rates in the period 2001-2011 (5.3 deaths/100,000 inhabitants), with a temporal trend of high growth and stability, in addition to delimited high-risk areas.5,6 Piauí stands out as one of the Brazilian states with high NTD mortality rates.3-6
Controlling NTDs as a public health problem remains a challenge in regions or territories where there is significant social vulnerability,5-8 which requires the development of achievable global targets. As such, the World Health Organization (WHO) has launched a new roadmap that emphasizes, among its objectives and goals, achieving elimination of NTDs, in order to meet the Sustainable Development Goals (SDGs) by 2030, considering their specificities and common grounds for their control.9
Knowledge of the magnitude of deaths due to NTDs, their temporal trends and spatial distribution in endemic areas, among distinct contexts of social and operational vulnerability, is essential for enhancing monitoring and evaluation of prevention and control strategies by the Brazilian National Health System [Sistema Único de Saúde (SUS)].3-5 Such knowledge favors the formulation of public health policies and the implementation of more efficient, evidence-based interventions, and allows for better targeting of available resources.3,5
Despite their relevance, epidemiological studies on endemic territories, including with regard to this group of diseases, in representative periods of time, are limited in Brazil. Piauí is one of Brazil’s most socially vulnerable states and, given operational challenges in the structuring of resolutive health care networks, this applies to access to diagnosis and treatment as well. As such, the objective of this study was to analyze temporal trends and spatial patterns of mortality due to neglected tropical diseases (NTDs) in Piauí, Brazil, between 2001 and 2018.
Methods
This was a mixed design ecological study including analysis of temporal trends and spatial patterns of mortality due to NTDs in the state of Piauí, between 2001 and 2018, taking municipalities of residence as units of analysis.
Piauí is located in the Northeast region of Brazil. It is divided into 224 municipalities that comprise four health macro-regions [Litoral (Coast); Meio Norte (Mid North); Semiárido (Semiarid) and Cerrados (Savanna)], having the state capital Teresina as the main center for the provision of health services (Figure 1).
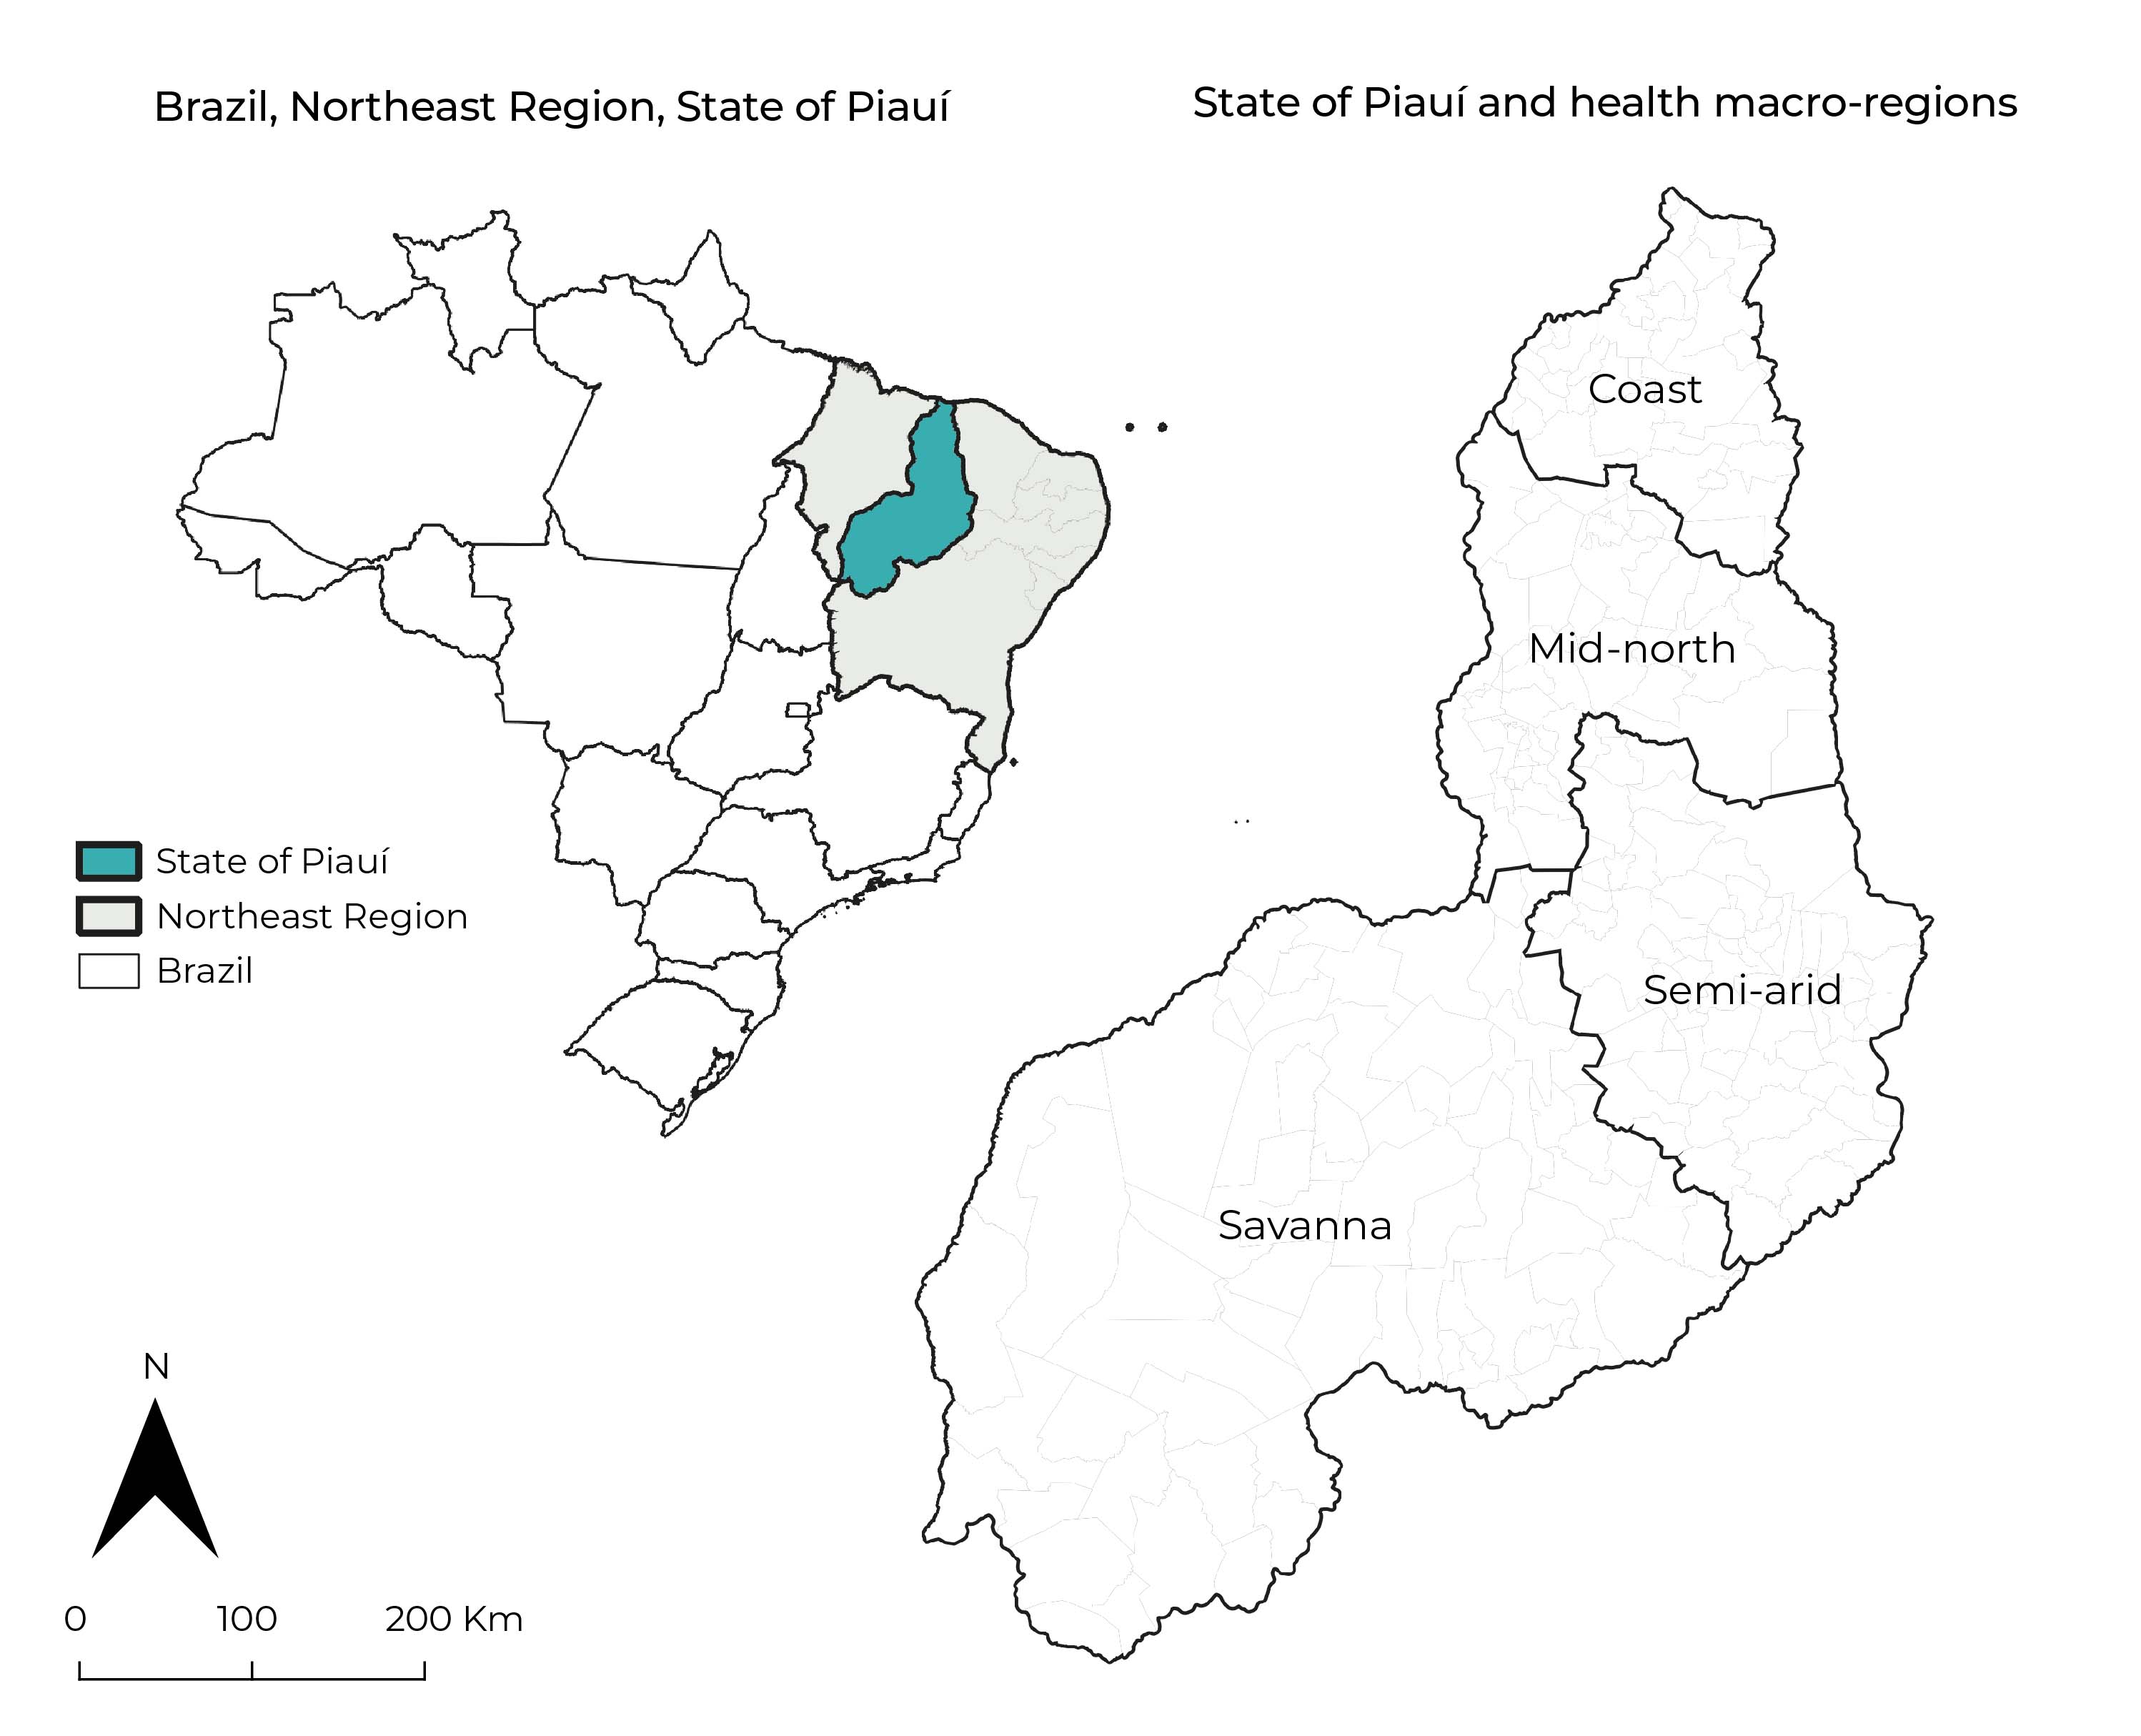
Source: Shapefile datasets/Brazilian Institute of Geography and Statistics (IBGE), 2019.
Figure 1 State of Piauí, Northeast Brazil, and its health macro-regions
In 2020 Piauí had an estimated population of 3,281,480 inhabitants, spread over 251,611.30 km2. Its population density was 12.4 inhabitants/km2.10 Its municipalities are mainly small (<50,000 inhab.) and marked by poverty and social inequality. In 2017, the state had a Gini index (indicator of the degree of income concentration) of 0.54 - the third lowest among the Northeastern states - and 23.8% of its population was classified as ‘poor’’, i.e., per capita household income of less than BRL 140.00.11
The study was based on official secondary data on deaths due to NTDs, recorded on the Ministry of Health’s Mortality Information System (SIM) and provided by the SUS Information Technology Department (DATASUS).
In order to identify deaths due to NTDs, we examined all references to NTDs as cause of death, including multiple causes (underlying causes and associated causes),12 recorded on death certificates for the period from 2001 to 2018. The study considered all NTDs that currently make up the official WHO list, identified by their respective codes in the Tenth Revision of the International Statistical Classification of Diseases and Related Health Problems (ICD-10), regardless of whether they are considered autochthonous or not in Brazil.1,3,13
In order to identify causes of death due to NTDs, we applied an algorithm with conditional functions to search for and identify the following ICD-10 codes:
Protozoal diseases - Chagas’ disease (B57); leishmaniasis (visceral and tegumentary (B55); and African trypanosomiasis (B56);
Helminthiases - schistosomiasis (B65, N22); soil-transmitted helminthiases [ascariasis (B77); ancylostomiasis (B76) and trichuriasis (B79)]; onchocerciasis (B73); cysticercosis/taeniasis (B68-B69); echinococcosis (B67); filariasis (B74); dracunculiasis (B72) and foodborne trematodiasis [opisthorchiasis (B66.0); clonorchiasis (B66.1); fascioliasis (B66.3); paragonimiasis (B66.4)];
Bacterial diseases - leprosy (A30, B92); trachoma (A71, B94); Buruli ulcer (A31.1) and endemic treponematoses [yaws (A66); pinta (A67); nonvenereal syphilis (A65)];
Viral infections - rabies (A82); dengue (A90-A91); chikungunya (A92);
Mycoses - mycetoma (B47); chromoblastomycosis (B43); histoplasmosis (B39); coccidioidomycosis (B38); paracoccidioidomycosis (B41); sporotrichosis (B42); cryptococcosis (B45);
Parasitic diseases - scabies (B86); tungiasis (B88.1); visceral larva migrans (B83); pediculosis (B85); myiasis (B87); and
Accident with venomous animals - snake venom (T63.0); contact with venomous snakes/lizards (X20).1,3,13
Population data were obtained from DATASUS, as per the 2000 and 2010 national demographic censuses, as well as population estimates for intercensal years (2001-2009 and 2011-2018), conducted by the Brazilian Institute of Geography and Statistics (IBGE).
We also used social vulnerability index (SVI) data for the state’s municipalities, which considers 16 indicators structured according to three dimensions - (i) urban infrastructure, (ii) human capital, and (iii) income and labor - the final score of which is based on the arithmetic mean of the sub-indices of the three dimensions.14
The magnitude of NTD mortality was defined by the simple and relative frequencies of deaths identified by multiple causes, for each specific NTD and its set. Crude average rates were calculated taking as a basis the population as per the 2010 Census, expressed per 100,000 inhabitants, including calculation of their 95% confidence intervals (95%CI).
We analyzed the following explanatory variables, potentially associated with NTD mortality:
sex (male; female);
age group (in years: up to 4; 5-14; 15-19; 20-39; 40-59; 60 or over);
ethnicity or race/skin color (white; black; brown; yellow and indigenous);
SVI (very low = 0-0.199; low = 0.200-0.299; medium = 0.300-0.399; high = 0.400-0.499; very high = 0.500-1.000);
municipality size [small I (≤20,000 inhab.); small II (20,001-50,000 inhab.); medium (50,001-100,000 inhab.); large (>100,001 inhab.)]; and
health macro-regions (Litoral; Meio Norte; Semiárido; Cerrados).
We calculated the rate ratio/risk ratio (RR) and its 95%CI, whereby differences between groups were determined using Pearson’s chi-square test (χ2). We used Stata version 11.2 to perform the statistical analyses (StataCorp LP, College Station, TX, USA).
The temporal trend analysis considered all the explanatory variables mentioned, regarding the ‘deaths due to NTDs’ outcome. With regard to the mortality rates, estimated via Poisson regression using inflection points (joinpoints), statistical significance was assigned according to the Monte Carlo permutation method, used to identify the best line of each segment.
The trends were tested and (i) annual percent change (APC) and (ii) average annual percent change (AAPC) were validated according to 95%CIs. Temporal trend was represented by the lowest number of inflection points allowed, identifying the occurrence of increasing patterns (positive APC), decreasing patterns (negative APC) and no trend (APC/AAPC not statistically significant).
We used Jointpoint Regression software version 4.8.0.1 to perform this analysis (Statistical Methodology and Applications Branch, Surveillance Research Program, National Cancer Institute, National Institute of Health, USA).
We used three-year stratification when plotting spatial distribution of NTD mortality (2001-2003; 2004-2006; 2007-2009; 2010-2012; 2013-2015; 2016-2018), analyzing average deaths on order to identify spatiotemporal patterns and trends. NTD-related deaths with unknown municipality of residence were not included in the analysis.
The average rates (per 100,000 inhab.) adjusted for age and sex, with respective 95%CIs, were calculated using the direct method of standardization, taking as the reference the distribution of the population’s age and sex as per the 2010 Census.
Identification of spatial patterns of concentration of deaths due to NTDs was based on the calculation of the spatial ratio (SR), taking as a reference deaths that occurred in neighboring municipalities, considering spatial autocorrelation. We sought to identify municipalities with a higher concentration of deaths due to NTDs (excess risk), based on the calculation of the standardized mortality ratio (SMR), resulting from the difference between recorded deaths and expected deaths. According to this non-spatial approach technique, ‘excess risk’ refers to municipalities with above average rates, not taking into account the potential effect of spatial autocorrection.
Categorization of spatial classes in relation to adjusted rates, spatial ratio and standardized mortality ratio was based on the natural breaks method, as classified by Jenks.
qGis version 3.10.7 (QGIS Geographic Information System, Open Source Geospatial Foundation Project) and GeoDa versão 1.18 (Geographic Data Analysis) were used to calculate autocorrelation indices and to build thematic maps.
The study was based on anonymous open access secondary mortality data. As such it was exempt from submission to a Research Ethics Committee.
Results
Piauí registered 292,810 deaths for the period 2001-2018, of which 2,609 (0.9%) were due to NTDs with multiple causes (underlying cause and associated cause). Of these, 1,990 (76.3%) corresponded to NTDs as the underlying cause and 619 (23.7%) to causes associated with death. Chagas’ disease was the main NTD recorded, with 1,441 (55.2%) among all deaths, followed by leishmaniasis (visceral and tegumentary), with 410 (15.7%), and leprosy with 360 (13.8%) deaths (Table 1).
Table 1 Characterization of neglected tropical diseases by underlying or multiple cause of death, Piauí, Brazil, 2001-2018
| Neglected tropical diseases | ICD-10 codesa | Underlying cause | Associated cause | Multiple cause (underlying + associated)b |
|---|---|---|---|---|
| N(%) | N(%) | N(%) | ||
| Protozoal diseases | ||||
| Chagas’ disease | B57 | 1,218 (61.2) | 223 (36.0) | 1,441 (55.2) |
| Leishmaniasis | B55 | 358 (18.0) | 52 (8.4) | 410 (15.7) |
| African trypanosomiasis (sleeping sickness) | B56 | - (0.0) | 1 (0.2) | 1 (0.0) |
| Helminthiases | ||||
| Schistosomiasis | B65/N22 | 10 (0.5) | 1 (0.2) | 11 (0.4) |
| Soil-transmitted helminthiases | ||||
| Ascariasis/ancylostomiasis | B76-B77 | - (0.0) | 4 (0.6) | 4 (0.2) |
| Onchocerciasis (river blindness) | B73 | - (0.0) | 1 (0.2) | 1 (0.0) |
| Cysticercosis/taeniasis | B68-B69 | 34 (1.7) | 14 (2.3) | 48 (1.8) |
| Echinococcosis | B67 | - (0.0) | 3 (0.5) | 3 (0.1) |
| Filariasis | B74 | 2 (0.1) | 2 (0.3) | 4 (0.2) |
| Foodborne trematodiasis | ||||
| Opisthorchiasis/clonorchiasis/ fascioliasis/paragonimiasis | B66-B66.4 | - (0.0) | 1 (0.2) | 1 (0.0) |
| Bacterial diseases | ||||
| Leprosy | A30/B92 | 148 (7.4) | 212 (34.2) | 360 (13.8) |
| Trachoma | A71/B94 | 6 (0.3) | 2 (0.3) | 8 (0.3) |
| Buruli ulcer | A31.1 | - (0.0) | 1 (0.2) | 1 (0.0) |
| Viral infections | ||||
| Rabies | A82 | 4 (0.2) | - (0.0) | 4 (0.2) |
| Dengue | A90-A91 | 65 (3.3) | 13 (2.1) | 78 (3.0) |
| Chikungunya | A92 | 8 (0.4) | 1 (0.2) | 9 (0.3) |
| Mycoses | ||||
| Mycetoma | B47 | 2 (0.1) | 1 (0.2) | 3 (0.1) |
| Chromoblastomycosis | B43 | 1 (0.0) | - (0.0) | 1 (0.0) |
| Histoplasmosis | B39 | 3 (0.1) | 3 (0.5) | 6 (0.2) |
| Coccidioidomycosis | B38 | 10 (0.5) | 1 (0.2) | 11 (0.4) |
| Paracoccidioidomycosis | B41 | 10 (0.5) | 2 (0.3) | 12 (0.5) |
| Cryptococcosis | B45 | 25 (1.3) | 41 (6.6) | 66 (2.5) |
| Parasitic diseases | ||||
| Scabies | B86 | - (0.0) | 3 (0.5) | 3 (0.1) |
| Visceral larva migrans | B83 | 2 (0.1) | 3 (0.5) | 5 (0.2) |
| Pediculosis (lice infestation) | B85 | - (0.0) | 1 (0.2) | 1 (0.0) |
| Myiasis | B87 | 23 (1.2) | 7 (1.1) | 30 (1.1) |
| Accident with venomous animals | ||||
| Snake venom | T63.0 | - (0.0) | 26 (4.2) | 26 (1.0) |
| Contact with venomous snakes and lizards | X20 | 61 (3.1) | 0 (0.0) | 61 (2.3) |
| Total | - | 1,990 (100.0) | 619 (0.0) | 2,609 (0.0) |
a) Tenth revision of the International Statistic Classification of Diseases and Related Health Problems (ICD-10);13 b) Death Certificate (DC) with record of at least one cause of death (underlying and/or associated) related to neglected tropical diseases.
The overall mortality rate due to NTDs in the period evaluated was 4.6 deaths/100,000 inhab. (95%CI 3.85;5.35). There was a higher proportion of deaths, mortality rate and risk of death for the following groups of people: males (n=1,641; 62.9%; rate of 5.9 deaths/100,000 inhab.; 95%CI 4.68;7.11), and 1.76 time higher risk (95%CI 1.25;2.46) when compared to the same risk for females; and age group ≥60 years (n=1,478; 56.7%; rate of 25.2 deaths/100,000 inhab.; 95%CI 19.78;30.70), and 40.71 times higher risk (95%CI 10.01;165.53) when compared to the 15-19 age group. For the variable 'ethnicity or race/ skin colour brown' we observed a higher number and proportion of deaths (n=1,613; 61.8%); however, the highest mortality rate corresponded to the population of black ethnicity or race/color (6.56/100,000 inhab.; 95%CI 3.61;9.51) (Table 2).
Table 2 Mortality rate (per 100,000 inhabitants) related to neglected tropical diseases, Piauí, Brazil, 2001-2018
| Variablesa | N (%) | Crude rate (95%CIb) | RRc (95%CI) | p-valued |
|---|---|---|---|---|
| Total deaths from NTDse | 2,609 (100.0) | 4.60 (3.85;5.35) | ||
| Sex | ||||
| Female | 968 (37.1) | 3.36 (2.46;4.25) | 1.00 | |
| Male | 1,641 (62.9) | 5.90 (4.68;7.11) | 1.76 (1.25;2.46) | 0.001 |
| Age group (years) | ||||
| 0-4 | 146 (5.6) | 2.93 (0.90;4.95) | 4.72 (1.01;22.23) | 0.050 |
| 5-14 | 46 (1.8) | 0.50 (0.00;1.06) | 0.80 (0.13;4.81) | 0.812 |
| 15-19 | 28 (1.0) | 0.62 (0.00;1.48) | 1.00 | |
| 20-39 | 268 (10.3) | 1.48 (0.73;2.23) | 2.39 (0.55;10.45) | 0.247 |
| 40-59 | 642 (24.6) | 5.84 (3.93;7.74) | 9.42 (2.27;39.11) | 0.002 |
| ≥60 | 1,478 (56.7) | 25.24 (19.78;30.70) | 40.71 (10.01;165.53) | <0.001 |
| Ethnicity or race/skin color | ||||
| White | 457 (17.5) | 3.31 (2.01;4.61) | 1.00 | |
| Brown | 1,613 (61.8) | 4.49 (3.56;5.42) | 1.36 (0.87;2.11) | 0.177 |
| Black | 343 (13.2) | 6.56 (3.61;9.51) | 1.98 (1.09;3.60) | 0.025 |
| Yellow | 13 (0.5) | 1.51 (0.38;7.23) | 5.94 (3.04;11.60) | <0.001 |
| Indigenous | 1 (0.0) | 0.00 (0.00;88.88) | 8.99 (1.22;66.30) | 0.031 |
| SVIf | ||||
| Low | 589 (22.6) | 3.49 (2.30;4.68) | 1.00 | |
| Medium | 606 (23.3) | 6.15 (4.08;8.22) | 1.76 (1.09;2.84) | 0.021 |
| High | 861 (33.0) | 5.40 (3.87;6.92) | 15.46 (0.99;2.41) | 0.054 |
| Very high | 551 (21.1) | 4.24 (2.75;5.74) | 12.16 (0.74;1.98) | 0.435 |
| Municipality sizeg> | ||||
| Small I | 1,315 (50.4) | 5.61 (4.32;6.90) | 1.99 (1.28;3.10) | 0.002 |
| Small II | 626 (24.0) | 5.27 (3.52;7.01) | 1.87 (1.13;3.09) | 0.014 |
| Medium | 172 (6.6) | 5.18 (1.97;8.40) | 1.84 (0.89;3.81) | 0.099 |
| Large | 494 (19.0) | 2.81 (1.75;3.87) | 1.00 | |
| Health macro-region | ||||
| Litoral (Coast) | 251 (9.6) | 2.13 (1.01;3.24) | 1.00 | |
| Meio Norte (Mid North) | 713 (27.3) | 3.00 (2.07;3.93) | 1.41 (0.77;2.59) | 0.270 |
| Semiárido (Semiarid) | 635 (24.4) | 6.07 (4.06;8.09) | 2.85 (1.54;5.30) | 0.009 |
| Cerrados (Savanna) | 1,008 (38.7) | 9.60 (7.09;12.12) | 4.51 (2.51;8.11) | <0.001 |
a) Data unavailable: age group = 1; ethnicity or race/skin color = 182; SVI = 2; municipality size = 2; b) 95%CI: 95% confidence interval; c) RR: rate ratio/risk ratio; d) P-value: Pearson’s χ2 test; e) NTD: neglected tropical diseases; f) SVI: social vulnerability index = very low (0-0.199), low (0.200-0.299), medium (0.300-0.399), high (0.400-0.499) and very high (0.500-1); g) Municipality size: small I (≤20,000 inhab.), small II (20,001-50,000 inhab.), medium (50,001-100,000 hab.) and large (>100,001 inhab.).
The highest number of deaths from NTDs was found among people who lived in municipalities with a high SVI (n=861; 33.0%), although the highest mortality rate (6.15/100,000 inhabitants; 95%CI 4.08;8.22) and highest risk of death from NTDs was found among people who lived in municipalities with a medium SVI, presenting a risk 1.76 time higher (95%CI 1.09;2.84) when compared to people who lived in municipalities with a low SVI (Table 2).
A higher proportion of deaths was found among residents of the smallest cities (‘small I’) (n=1,315; 50.4%), with a mortality rate of 5.61 deaths/100,000 inhab. (95%CI 4.32;6.90), and 1.99 time greater risk of death (95%CI 1.28;3.10) than in large cities. In the Cerrados macro-region, there were 1,008 (38.7%) deaths from NTDs, a mortality rate of 9.60 deaths/100,000 inhab. (95%CI 7.09;12.12) and risk of death 4.51 times greater (95%CI 2.51;8.11) in relation to the Litoral macro-region (Table 2).
Between 2001 and 2008 the temporal trend was one of significantly increasing overall mortality rates due to NTDs (APC = 7.9; 95%CI 3.1;12.9). However, there was a downward trend in NTD mortality rates (APC = -3.1; 95%CI -5.5;-0.7) from 2008 to 2018 (Table 3).
Table 3 Temporal trend of the crude mortality rate related to neglected tropical diseases, according to joinpoint regression analysis, Piauí, Brazil, 2001-2018
| Variable | Trends | Total period | |
|---|---|---|---|
| Period | APCa (95%CIb) | AAPCc (95%CIb) | |
| Total deaths from NTDsd | 2001-2008 | 7.9g (3.1;12.9) | 1.3 (-0.9;3.5) |
| 2008-2018 | -3.1g (-5.5;-0.7) | ||
| Sex | |||
| Female | 2001-2011 | 4.6g (0.1;9.3) | 0.9 (-6.5;8.8) |
| 2011-2015 | -12.2 (-33.6;16.1) | ||
| 2015-2018 | 7.6 (-18.7;42.4) | ||
| Male | 2001-2008 | 8.8g (3.1;14.7) | 1.8 (-0.6;4.4) |
| 2008-2018 | -2.7g (-5.4;-0.0) | ||
| Age group (in years) | |||
| 0-4 | 2001-2016 | -4.9g (-9.5;-0.2) | -1.5 (-14.0;12.7) |
| 2016-2018 | 28.1 (-61.8;330.0) | ||
| 5-14 | 2001-2007 | 12.4 (-8.7;38.5) | -0.5 (-8.6;8.3) |
| 2007-2018 | -7.0 (-15.3;2.2) | ||
| 15-19 | 2001-2018 | -3.1 (-7.7;1.7) | -3.1 (-7.7;1.7) |
| 20-39 | 2001-2018 | 0.9 (-1.8;3.6) | 0.9 (-1.8;3.6) |
| 40-59 | 2001-2010 | 1.9 (-3.3;7.3) | -2.6 (-6.2;1.1) |
| 2010-2018 | -7.5g (-13.3;-1.2) | ||
| ≥60 | 2001-2007 | 13.2g (5.3;21.7) | 1.5 (-1.2;4.2) |
| 2007-2018 | -4.4g (-6.5;-2.2) | ||
| Ethnicity or race/skin color | |||
| White | 2001-2009 | 6.2 (-04;13.2) | 0.1 (-3.6;4.0) |
| 2009-2018 | -5.0 (-10.0;0.4) | ||
| Brown | 2001-2008 | 11.9g (6.7;17.4) | 3.4g (1.1;5.7) |
| 2008-2018 | -2.2 (-4.5;0.2) | ||
| Black | 2001-2010 | 4.5 (-3.3;12.9) | -0.1 (-5.5;5.5) |
| 2010-2018 | -5.1 (-13.7;4.3) | ||
| Yellow | 2001-2015 | 4.3 (-5.2;14.9) | -2.0 (-14.6;12.4) |
| 2015-2017 | -36.9 (-84.4;155.5) | ||
| SVIe | |||
| Low | 2001-2008 | 6.9 (-3.4;18.2) | 1.5 (-3.2;6.5) |
| 2008-2018 | -2.1 (-7.4;3.5) | ||
| Medium | 2001-2004 | -9.1 (-32.1;21.6) | -0.7 (-11.4;11.2) |
| 2004-2007 | 26.8 (-34.4;145.0) | ||
| 2007-2018 | -4.9g (-8.3;-1.3) | ||
| High | 2001-2008 | 7.6g (1.6;14.0) | 1.6 (-1.1;4.4) |
| 2008-2018 | -2.4 (-5.4;0.6) | ||
| Very high | 2001-2008 | 13.2g (3.7;23.6) | 4.2g (0.2;8.3) |
| 2008-2018 | -1.7 (-5.6;2.3) | ||
| Municipality sizef | |||
| Small I | 2001-2008 | 10.2g (6.1;14.5) | 2.4g (0.6;4.2) |
| 2008-2018 | -2.8g (-4.7;-0.9) | ||
| Small II | 2001-2004 | -14.3 (-33.5;10.5) | -0.3 (-10.4;11.0) |
| 2004-2007 | 32.0 (-29.8;148.1) | ||
| 2007-2018 | -3.7g (-6.4;-0.9) | ||
| Medium | 2001-2009 | 14.1g (1.8;27.9) | 2.9 (-3.6;9.8) |
| 2009-2018 | -6.1 (-14.3;2.8) | ||
| Large | 2001-2014 | 1.4 (-1.8;4.7) | -0.5 (-5.1;4.3) |
| 2014-2018 | -6.5 (-23.0;13.6) | ||
| Health macro-region | |||
| Litoral (Coast) | 2001-2010 | 4.0 (-4.0;12.6) | 0.4 (-5.1;6.1) |
| 2010-2018 | -3.6 (-12.2;6.0) | ||
| Meio Norte (Mid North) | 2001-2003 | 27.3 (-35.4;150.7) | 2.8 (-4.6;10.8) |
| 2003-2018 | -0.0 (-2.4;2.3) | ||
| Semiárido (Semiarid) | 2001-2007 | 10.7 (-0.2;22.8) | 2.5 (-1.5;6.7) |
| 2007-2018 | -1.7 (-5.4;2.1) | ||
| Cerrados (Savanna) | 2001-2008 | 9.8g (3.4;16.5) | 0.7 (-2.1;3.6) |
| 2008-2018 | -5.2g (-8.3;-2.0) | ||
a) APC: average percent change; b) 95%CI: 95% confidence interval %; c) AAPC: average annual percent change; d) NTD: neglected tropical diseases; e) SVI: social vulnerability index = very low (0-0.199), low (0.200-0.299), medium (0.300-0.399), high (0.400-0.499) and very high (0.500-1); f) Municipality size: small I (≤20,000 inhab.), small II (20,001-50,000 inhab.), medium (50,001-100,000 hab.) and large (>100,001 inhab.); g) Significantly different to 0.00 (p-value<0.05), Monte Carlo permutation method.
The same mortality rate trend was also found for the following groups: males in the period 2001-2008 (APC = 8.8; 95%CI 3.1;14.7) and 2008-2018 (APC = -2.7; 95%CI -5.4;-0.0); persons residing in small municipalities (‘small I’) (≤20. 000 hab.), in 2001-2008 (APC = 10.2; 95%CI 6.1;14.5) and 2008-2018 (APC = -2.8; 95%CI -4.7;-0.9); and people living in the Cerrados macro-region, in 2001-2008 (APC = 9.8; 95%CI 3.4;16.5) and 2008-2018 (APC = -5.2; 95%CI -8.3;-2.0) (Table 3).
There was an increase in NTD mortality rates in the period 2001-2008 (APC = 11.9; 95%CI 6.7;17.4), in the population that declared itself to be of mixed race/skin color and same trend was found for entire 2001-2018 time series (APC = 3.4; 95%CI 1.1;5.7). We also found increasing trends in NTD mortality rates for the period 2001-2008 among people who lived in municipalities with a high SVI (APC = 7.6; 95%CI 1.6;14.0) and a very high SVI (APC = 13.2; 95%CI 3.7;23.6).
There was a significant increasing trend in mortality rates in different periods in the following groups: females in the period 2001-2011 (APC = 4.6; 95%CI 0.1;9.3); persons aged ≥60 years in the period 2001-2007 (APC = 13.2; 95%CI 5.3;21.7); and persons residing in medium-sized municipalities in the period 2001-2009 (APC = 14.1; 95%CI 1.8;27.9) (Table 3).
Downward trends in NTD mortality were found in children under 5 years old in the period 2001-2016 (APC = -4.9; 95%CI -9.5;-0.2), in the 40-59 age group in the period 2010-2018 (APC = -7.5; 95%CI -13.3;-1.2), as well as among people living in municipalities with a medium SVI (APC = -4.9; 95%CI -8.3;-1.3) and in smaller municipalities (‘small II’) (APC = -3.7; 95%CI -6.4;-0.9) in the period 2007-2018 (Table 3).
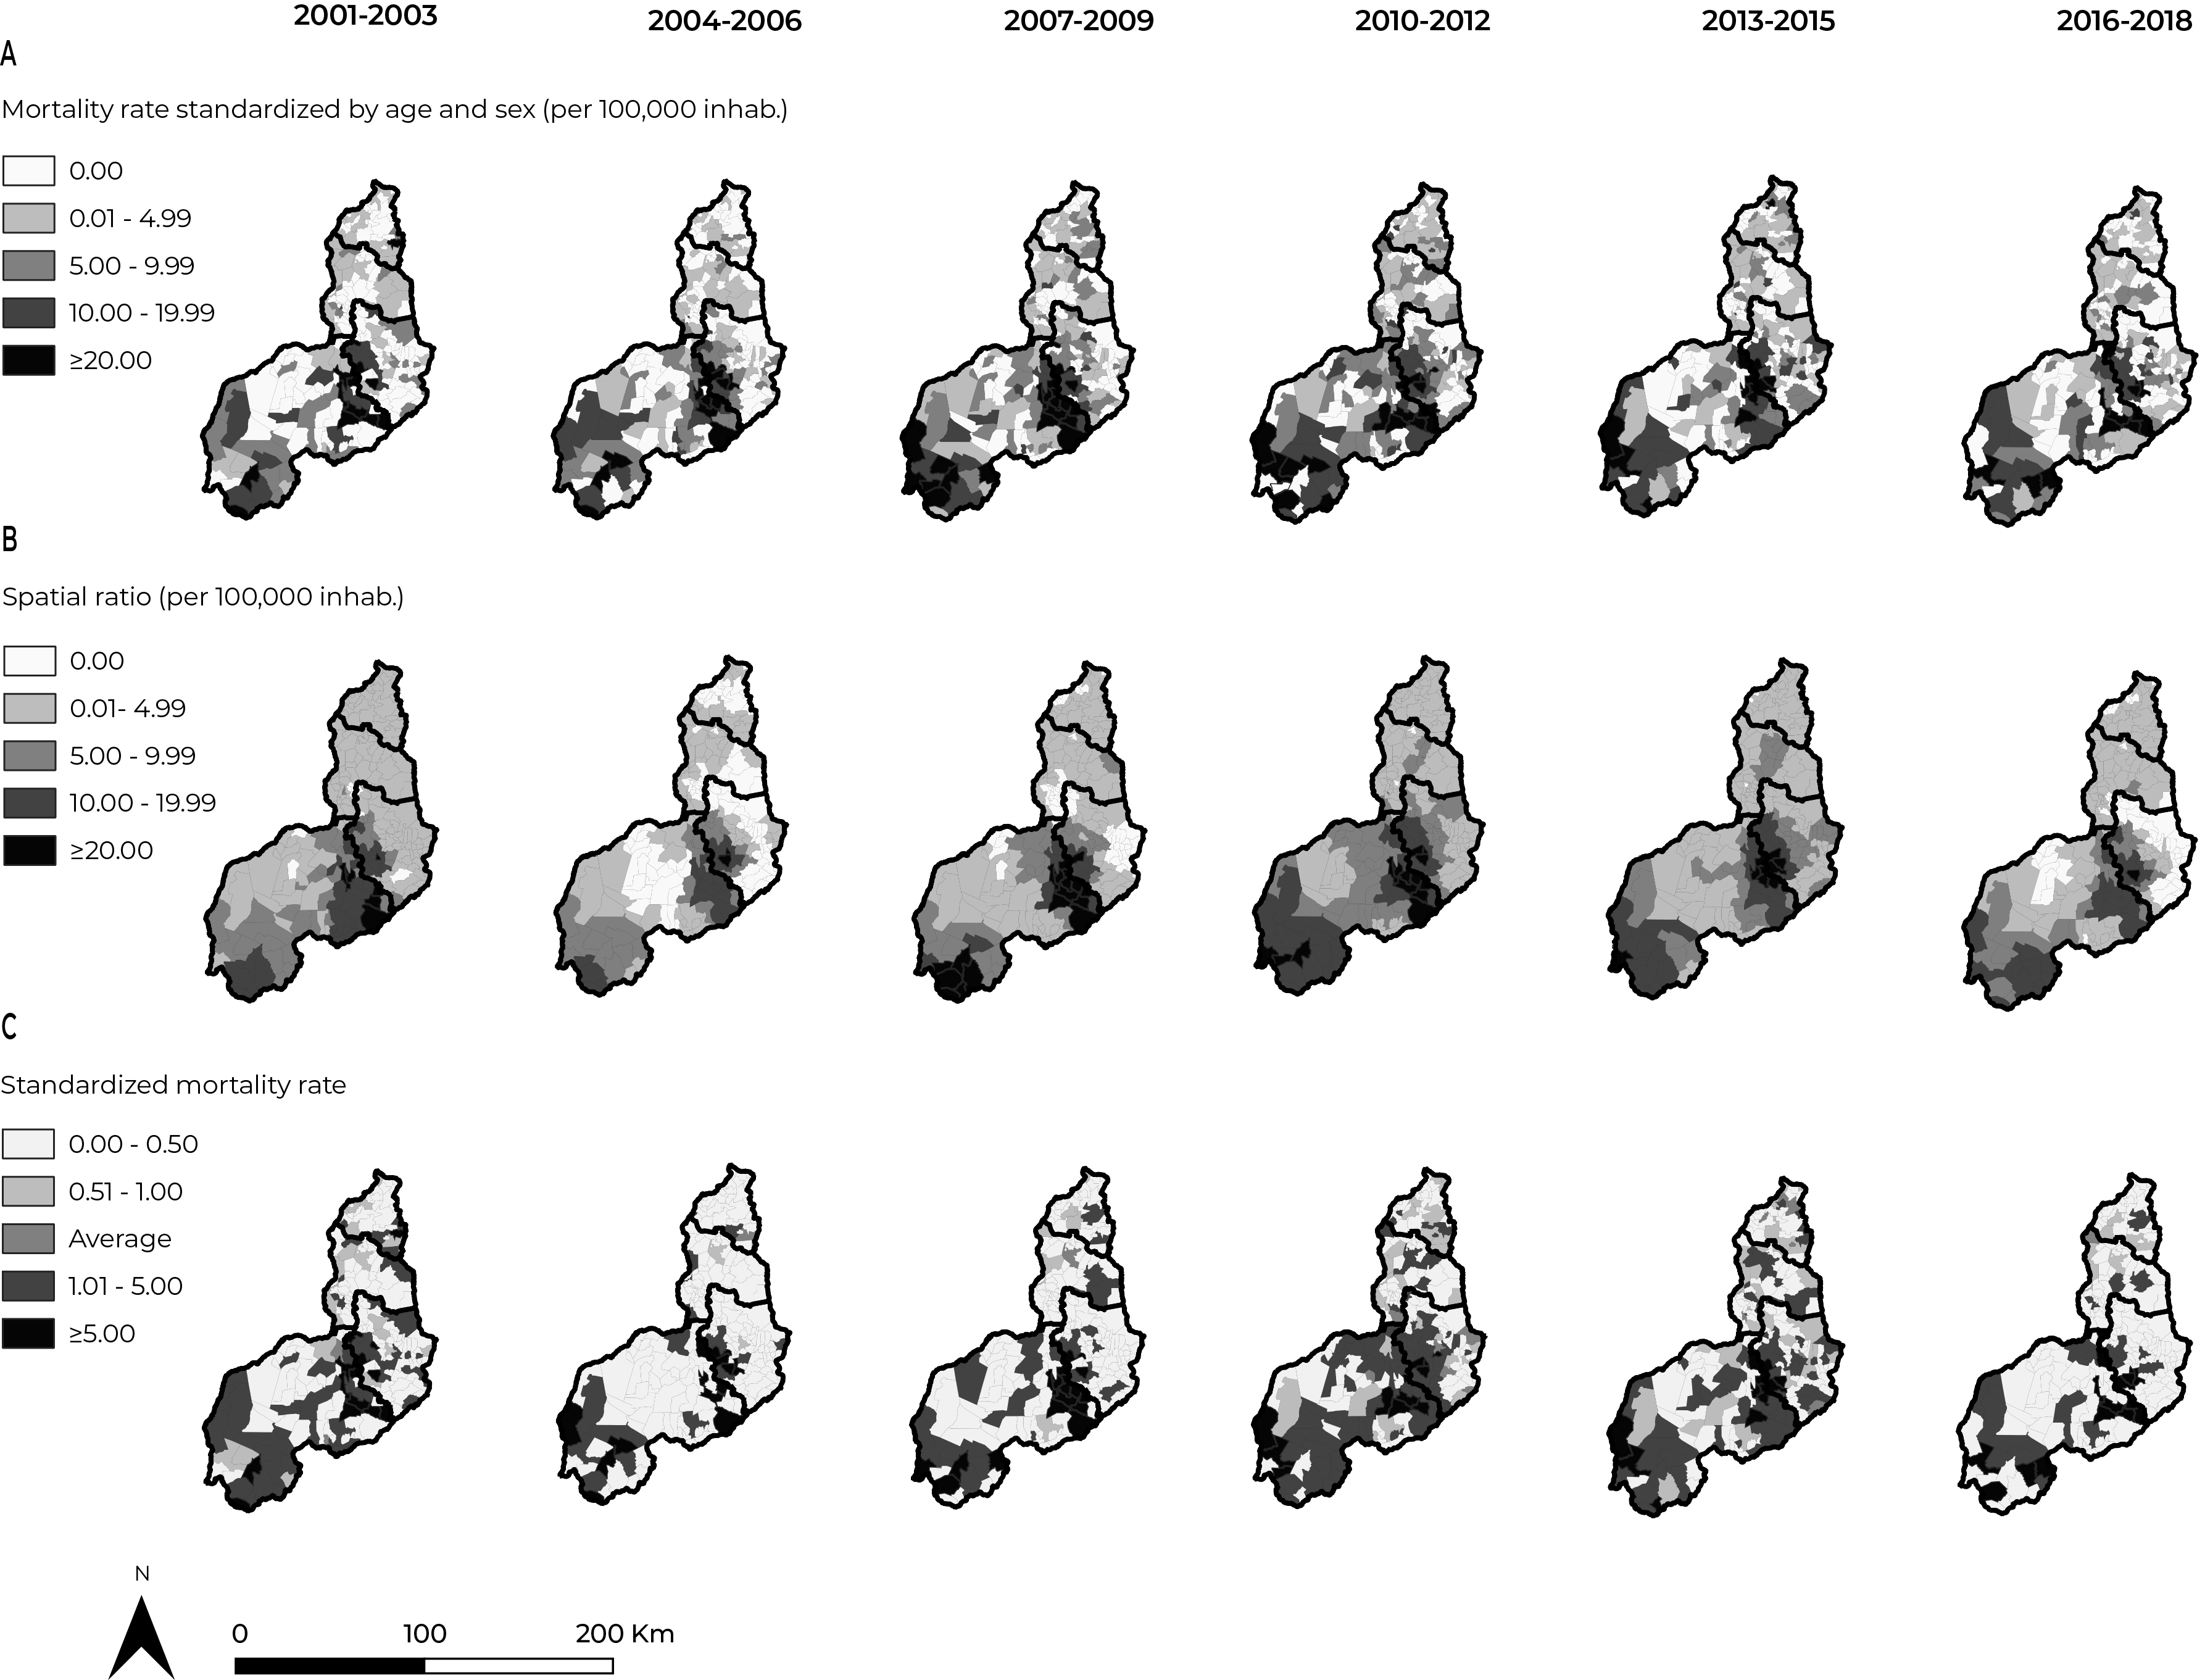
A) Mortality rate standardized by age and sex (per 100,000 inhabitants); B) Spatial ratio, per 100,000 inhab.); C) Standardized mortality ratio.
Figure 2 Spatiotemporal distribution of mortality due to neglected tropical diseases, according to rates standardized by age and sex, spatial moving average and standardized mortality ratio, Piauí, Brazil, 2001-2018
We identified spatial concentration of municipalities with high NTD mortality rates, adjusted for age and sex, ranging from 0.0 to 63.7 deaths/100,000 inhabitants, in the southwest of the Semiarid macro-region, and in the northeast and south of the Cerrados macro-region. The spatial pattern, with concentration of high rates in these municipalities, remained upward in the first three 3-year periods, while there was a reduction, although less significant, in the following 3-year periods (Figure 2 A ).
In the municipalities bordering the northeast of the Cerrados macro-region, including the region to the south of the Cerrados macro-region, and southwest of the Semiarid macro-region, there was an upward trend in the mortality spatial ratio in the first three 3-year periods, with rates ranging from 0.0 to 41.0 deaths/100,000 inhab. and concentrations of areas with high rates (≥20.0 deaths/100,000 inhab.) from the third to the fifth 3-year periods (Figure 2 B ).
There was excess risk, with expansion of the pattern of concentration of municipalities with above-average standardized mortality ratios in municipalities bordering the northeast of the Cerrados macro-region and southwest of the Semi-arid macro-region, and south of the Cerrados macro-region. In the last 3-year period, there was a significant reduction in this pattern, similar to that which was found in the second 3-year period (Figure 2 C ).
Discussion
NTD mortality is high in Piauí and persists as a public health problem, mainly due to Chagas’ disease, leishmaniasis and leprosy. Analysis of temporal trends and spatial patterns in the 18 years covered by the study shows increased risk, particularly for population groups and territories in contexts of greater vulnerability. Worthy of note is the existence of patterns of concentration of high rates in bordering municipalities, in the southwest of the Semiarid macro-region, and in the northeast and south of the Cerrados macro-region.
The political agendas and actions for NTD control in Brazil varied in the period analyzed. In 2012, the Ministry of Health launched an integrated strategic action plan, with the goal of eliminating some NTDs, such as leprosy, filariasis, schistosomiasis and onchocerciasis, as well as trachoma (an important cause of blindness) and soil-transmitted helminthiases, as a public health problem. The set of planned actions may have justified, even if only partially, the reduction in NTD mortality rates and trends.15 Despite the advances in the national agendas, the need to strengthen strategic actions that integrate surveillance and health care is recognized.
Analyses similar to those performed in this study demonstrated a reduction in NTD mortality rates over time. However, in those studies, a differentiated pattern was found for the Northeastern region, ranging from a stable trend to growth.5,6 Time trend analyses of NTD deaths, not including Chagas’ disease, reinforce the impact of its morbidity and mortality on the population and its greater occurrence in poorer regions where social vulnerability is greater.5
Analysis of underlying causes of deaths due to NTDs in the state of Sergipe identified schistosomiasis as the leading cause of death.16 Despite the lower occurrence of schistosomiasis deaths in Piauí, a similar pattern was found to the one recorded in the aforementioned study, with increasing temporal trends of NTD mortality, especially in 2008, followed by a reduction from then on.
The higher proportion of deaths from Chagas’ disease, leishmaniasis and leprosy identified in this study shows the severity of these NTDs in Brazil, due to their high morbidity and mortality burden. States and municipalities in the Northeast region have shown a persistent endemic pattern, with a higher occurrence of disability-adjusted life years (DALY) lost due to NTDs, representing one of the great challenges in public health management in the context of the SUS, especially in the Northeastern states.4,8,15-18
There was a greater proportion of deaths and risk associated with NTDs in males and in the elderly, and these results are similar to those found in studies conducted in Latin America, including Argentina, Ecuador and Colombia.19-21
Inequalities in mortality, with higher rates, risk, and increased trends among males, those of brown and black skin color/race, children and the elderly, reflect a greater likelihood of progression to more severe clinical conditions, reaffirming vulnerability in the face of critical and persistent social inequality in Piauí.6,7,17,22,23
Limited access to diagnosis and timely treatment of NTDs based on comprehensive care is reflected in different dimensions of individual, social and operational vulnerability, which refer to cultural, genetic, self-care characteristics, presence of comorbidities and lower quality of life, besides the fragility of health care networks, generating public health failures.3,15,17,24-26
Greater risk of death as expressed by the proportions, rates and RR of deaths related to NTDs in municipalities and macro-regions with higher SVIs reinforce the direct relationship of these diseases with poverty and poor living conditions. They also express health inequities, since they correspond to explanatory factors of social determinants of health that favor the occurrence and maintenance of these diseases in those territories.6-8,26
The higher mortality burden in small municipalities located in the Cerrados macro-region may be associated with limitations in access to diagnosis and treatment offered in the SUS care networks. These municipalities are more distant from the capital and dependent on larger cities, where reference centers for communicable diseases, regional hospitals, hemocenters, commercial, industrial and educational centers are concentrated.17,26
The occurrence of spatial patterns characterized by the concentration of high adjusted mortality rates, higher spatial ratios and standardized mortality ratios was expressive in municipalities bordering the Semiarid and Cerrado macro-regions, and may result from internal migration processes, between municipalities, that favor urbanization and territorial expansion of NTDs, most of which are chronic communicable conditions.
These results corroborate findings of studies on mortality due to specific NTDs, such as leprosy, in the North and Northeast regions of Brazil,7,17 and visceral leishmaniasis in municipalities of the Northeast region.8 Those studies found an increase in the number of municipalities in Piauí with high leprosy mortality rates, calculated based on the moving average,7 and clusters of high risk of death from visceral leishmaniasis involving 200 municipalities in the state of Piauí.8 We highlight the evidence of municipalities or regions that experience situations of social vulnerability and have a higher risk of death due to NTDs, indicating the need to implement intersectoral strategies for control in these places.4,7,8,17,27,28
Among the main factors that may contribute to concentrations of high mortality rates and continuing NTD endemics are: (i) health inequities; (ii) climate change; (iii) occurrence of rural endemics; (iv) population concentration in large urban centers; (v) controversies facing dog euthanasia; (vi) difficulties in endemic control workers accessing people’s homes; (vii) poor basic sanitation; (viii) precarious socioeconomic conditions; (ix) fragility of local employment and income policies; and (x) limited financial resources for health surveillance actions.6,16,22,23,28,29
The situation of neglect of populations and territories affected by NTDs is also aggravated by factors such as low public and private investments, lack of health industry interest in developing more efficient diagnostic methods with expanded access in SUS facilities, as well as vaccines and new, safer and more effective therapeutic options for timely treatment.24 Overcoming this negligence is fundamental for achieving the goals of eliminating NTDs by 2030, as planned for in the United Nations SDGs agenda.9,30
Other aggravating factors include limited resources for research and availability of accurate epidemiological and operational data at the municipal level for analysis aimed at guiding control actions. These problems not only make it difficult to achieve the goals and strategies established by the WHO, including the delimitation of the number of people affected by NTDs and at risk, but also contribute to the persistence of the high burden of morbidity and mortality.4,23
The findings of this study can contribute to the qualification of the agendas for NTD surveillance, care and control in the state of Piauí, particularly in more critical territories and among populations at greater risk and vulnerability. They support the necessary expansion of services, in an inclusive manner and on an intersectoral basis.
This study has limitations related to the databases used, which may have led to underestimation of rates due to misdiagnosis, incompleteness and/or inconsistencies in the original mortality and population databases. However, it should be highlighted that this research has differential aspects, such as the analysis of a large group of NTDs over a long period, as well as the inclusion of multiple causes of death due to NTDs, including complications that may have favored the outcome. It is noteworthy that notification of some NTDs is not compulsory in Brazil, and analyzing them based on records held on the Mortality Information System allows us to recognize epidemiological patterns of greater severity.
Mortality due to NTDs in Piauí persists at high levels, with emphasis on populations and territories of greater vulnerability, which need to be prioritized. Recognition of the burden of morbidity and mortality in Piauí contributes to the improvement of inclusive, intersectoral and integrated public policies for income generation, education, health care, surveillance, prevention and control of NTDs, needed to overcome inequalities and expand human and social development
REFERENCES
1. World Health Organization. Neglected tropical diseases [Internet]. Geneva: World Health Organization; 2020 [cited 2020 mar 31]. Available from: https://www.who.int/neglected_diseases/diseases/en/ [ Links ]
2. Molyneux DH, Savioli L, Engels D. Neglected tropical diseases: progress towards addressing the chronic pandemic. Lancet. 2017; 389(10066): 312-25. doi: 10.1016/s0140-6736(16)30171-4 [ Links ]
3. Martins-Melo FR, Ramos Jr. AN, Alencar CH, Heukelbach J. Mortality from neglected tropical diseases in Brazil, 2000-2011. Bull World Heal Organ. 2016; 94(2): 103-10. doi: 10.2471/blt.15.152363 [ Links ]
4. Martins-Melo FR, Carneiro M, Ramos Jr. AN, Heukelbach J, Ribeiro ALP, Werneck GL. The burden of neglected tropical diseases in Brazil, 1990-2016: a subnational analysis from the Global Burden of Disease Study 2016. PLoS Negl Trop Dis. 2018; 12(6): e0006559. doi: 10.1371/journal.pntd.0006559 [ Links ]
5. Martins-Melo FR; Ramos-Jr AN; Alencar CH; Heukelbach J. Trends and spatial patterns of mortality related to neglected tropical diseases in Brazil. Parasite Epidemiol Control. 2016; 1(2): 56-65. doi: 10.1016/j.parepi.2016.03.002 [ Links ]
6. Ministério da Saúde (BR). Secretaria de Vigilância em Saúde. Departamento de Vigilância de Doenças e Agravos não Transmissíveis e Promoção da Saúde. Doenças negligenciadas no Brasil: vulnerabilidade e desafios [Internet]. Brasília: Ministério da Saúde; 2018 [citado 2021 jul 05]. Disponível em: http://bvsms.saude.gov.br/bvs/publicacoes/saude_brasil_2017.pdf [ Links ]
7. Ferreira AF, Souza EA, Lima MS, García GSM, Corona F, Andrade ESN, et al. Mortalidade por hanseníase em contextos de alta endemicidade: análise espaço-temporal integrada no Brasil. Rev Panam Salud Publica. 2019; 43: e87. doi: 10.26633/RPSP.2019.87 [ Links ]
8. Ribeiro CJN, Santos AD, Lima SVMA, Silva ER, Ribeiro BVS, Duque AM, et al. Space-time risk cluster of visceral leishmaniasis in Brazilian endemic region with high social vulnerability: an ecological time series study. PLoS Negl Trop Dis. 2021; 15(1): e0009006. doi: 10.1371/journal.pntd.0009006 [ Links ]
9. World Health Organization. Ending the neglect to attain the sustainable development goals: a road map for neglected tropical diseases 2021-2030 [Internet]. Geneva: World Health Organization; 2021 [cited 2021 july 05]. Available from: https://www.who.int/publications/i/item/9789240010352 [ Links ]
10. Instituto Brasileiro de Geografia e Estatística. Cidades: Estados - Piauí [Internet]. Brasília: Instituto Brasileiro de Geografia e Estatística; 2020 [citado 2020 nov 14]. Disponível em: https://cidades.ibge.gov.br/brasil/pi/panorama [ Links ]
11. Programa das Nações Unidas para o Desenvolvimento. Instituto de Pesquisa Econômica Aplicada. Fundação João Pinheiro. Atlas do desenvolvimento humano no Brasil [Internet]. Brasília: Programa das Nações Unidas para o Desenvolvimento Brasil; 2017 [citado 2021 Jan 2]. Disponível em: http://www.atlasbrasil.org.br/perfil/uf/22 [ Links ]
12. Santo AH, Silva-Filho LVRF. Cystic fibrosis-related mortality trends in Brazil for the 1999-2017 period: a multiple-cause-of-death study. J Bras Pneumol. 2021; 47(2): e20200166. doi: 10.36416/1806-3756/e20200166 [ Links ]
13. World Health Organization. International statistical classification of diseases and related health problems (ICD): 10th Revision [Internet]. Geneva: World Health Organization; 2010 [cited 2021 july 05]. Available from: Available from: https://icd.who.int/browse10/2010/en [ Links ]
14. Instituto de Pesquisa Econômica Aplicada. Atlas da vulnerabilidade social nos municípios e regiões metropolitanas brasileiras [Internet]. Brasília: Instituto de Pesquisa Econômica Aplicada; [s.d.] [citado 2020 maio 15]. (base de dados) Disponível em: http://ivs.ipea.gov.br/index.php/pt/planilha [ Links ]
15. Ministério da Saúde (BR). Secretaria de Vigilância em Saúde. Departamento de Vigilância em Doenças Transmissíveis. Plano integrado de ações estratégicas de eliminação da hanseníase, filariose, esquistossomose e oncocercose como problema de saúde pública, tracoma como causa de cegueira e controle das geohelmintíases: plano de ação 2011-2015[Internet]. Brasília: Ministério da Saúde; 2012. 100 p. [citado 2021 jul 05]. Disponível em: https://bvsms.saude.gov.br/bvs/publicacoes/plano_integrado_acoes_estrategicas_2011_2015.pdf [ Links ]
16. Albuquerque MAC, Dias DM, Vieira LT, Lima CA, Silva AM. Mortality Trends for neglected tropical diseases in the state of Sergipe, Brazil, 1980-2013. Infect Dis Poverty. 2017; 6(1): 20. doi: 10.1186/s40249-016-0232-8 [ Links ]
17. Dias JCP, Ramos-Jr AN, Gontijo ED, Luquetti A, Shikanai-Yasuda MA, Coura JR, et al. II Consenso brasileiro em doença de Chagas, 2015. Epidemiol Serv Saude. 2016; 25(Spec): 7-86. doi: 10.5123/S1679-49742016000500002 [ Links ]
18. Araújo OD, Ferreira AF, Araújo TME, Silva LCL, Lopes WMPS, Neri EAR, et al. Mortalidade relacionada à hanseníase no Estado do Piauí, Brasil: tendências temporais e padrões espaciais, 2000-2015. Cad Saude Publica. 2020; 36(9): e00093919. doi: 10.1590/0102-311X00093919 [ Links ]
19. Macías G, Hernández H. Tendencia temporal y distribución espacial de la mortalidad por enfermedades tropicales desatendidas en Argentina entre 1991 y 2016. Rev Panam Salud Publica. 2019; 43: e67. doi: 10.26633/RPSP.2019.67 [ Links ]
20. Núñez-González S, Gault C, Simancas-Racines D. Spatial analysis of dengue, cysticercosis and Chagas disease mortality in Ecuador, 2011-2016. Trans R Soc Trop Med Hyg. 2019; 113(1): 44-7. doi: 10.1093/trstmh/try106 [ Links ]
21. Pinheiro E, Brum-Soares L, Reis R, Cubides JC. Chagas disease: review of needs, neglect, and obstacles to treatment access in Latin America. Rev Soc Bras Med Trop. 2017; 50(3): 296-300. doi: 10.1590/0037-8682-0433-2016 [ Links ]
22. Souza EA, Ferreira AF, Heukelbach J, Boigny RN, Alencar CH, Ramos-Jr AN. Epidemiology and spatiotemporal patterns of leprosy detection in the state of Bahia, Brazilian Northeast Region, 2001-2014. Trop Med Infect Dis. 2018; 3(3): 79. doi: 10.3390/tropicalmed3030079 [ Links ]
23. Souza EA, Boigny RN, Ferreira AF, Alencar CH, Oliveira MLW, Ramos-Jr AN. Vulnerabilidade programática no controle da hanseníase: padrões na perspectiva de gênero no Estado da Bahia, Brasil. Cad Saude Publica. 2018; 34(1): e00196216. doi: 10.1590/0102-311x00196216 [ Links ]
24. Olivera MJ, Porras-Villamil JF, Villar JC, Herrera EV, Buitrago G. Chagas disease-related mortality in Colombia from 1979 to 2018: temporal and spatial trends. Rev Soc Bras Med Trop. 2021; 54: e07682020. doi: 10.1590/0037-8682-0768-2020 [ Links ]
25. Ramos-Jr AN, Sousa AS. The continuous challenge of Chagas disease treatment: bridging evidence-based guidelines, access to healthcare, and human rights. Rev Soc Bras Med Trop. 2017; 50(6): 745-7. doi: 10.1590/0037-8682-0495-2017 [ Links ]
26. Fundação Instituto Oswaldo Cruz. Escola Nacional de Saúde Pública. Centro de Estudos, Políticas e Informação sobre Determinantes Sociais da Saúde. Determinantes sociais da saúde: portal e observatório sobre iniquidades em saúde [Internet]. Rio de Janeiro: Fundação Instituto Oswaldo Cruz; 2020. [citado 2021 jul 05]. Disponível em: https://dssbr.ensp.fiocruz.br/sobre-dss/ [ Links ]
27. Santana MP, Souza-Santos R, Almeida AS. Prevalência da doença de Chagas entre doadores de sangue do estado do Piauí, Brasil, no período de 2004 a 2013. Cad Saude Publica. 2018; 34(2): e00123716. doi: 10.1590/0102-311X00123716 [ Links ]
28. Souza EA, Boigny RN, Oliveira HX, Oliveira MLWDR, Heukelbach J, Alencar CH, et al. Tendências e padrões espaço-temporais da mortalidade relacionada à hanseníase no estado da Bahia, Nordeste do Brasil, 1999-2014. Cad Saúde Colet. 2018; 26(2) :191-202. doi: 10.1590/1414-462X201800020255 [ Links ]
29. Werneck GL. Controle da leishmaniose visceral no Brasil: o fim de um ciclo?. Cad Saude Publica. 2016; 32(6): ED010616. doi: 10.1590/0102-311X00ED010616 [ Links ]
30. Programa das Nações Unidas para o Desenvolvimento. Acompanhando a agenda 2030 para o desenvolvimento sustentável [Internet]. Brasília: Programa das Nações Unidas para o Desenvolvimento Brasil; 2016 [citado 2021 jul 05]. Disponível em: https://www.br.undp.org/content/brazil/pt/home/library/ods/acompanhando-a-agenda-2030.html [ Links ]
Associated academic work Article derived from the academic master’s degree dissertation entitled ‘Morbidity and mortality due to neglected tropical diseases in the state of Piauí: spatiotemporal patterns and related factors, 2001-2018’, defended by Sheila Paloma de Sousa Brito at the Postgraduate Program in Public Health, Faculdade de Medicina, Universidade Federal do Ceará, in 2022.
Funding This study received financial support from the Coordination for the Improvement of Higher Education Personnel (CAPES)/Ministry of Education (MEC). Sheila Paloma de Sousa Brito received a CAPES/MEC study grant for her master’s degree course: File No. 88882.454086/2019-01. Anderson Fuentes Ferreira receives a Ph.D. study grant from CAPES/MEC. Mauricélia da Silveira Lima received a study grant from the Ceará Scientific and Technological Development Support Foundation (FUNCAP). Alberto Novaes Ramos Jr. receives a research productivity grant from the National Council for Scientific and Technological Development (CNPq)/Ministry of Science, Technology and Innovation (MCTI): File No. 311799/2019-1.
Received: August 06, 2021; Accepted: January 14, 2022
 Este é um artigo publicado em acesso aberto sob uma licença Creative Commons
