


Servicios Personalizados
Revista

Articulo
 texto en
  Inglés (pdf)
 Articulo en XML
 Referencias del artículo
 Enviar articulo por email
Indicadores
-
 Citado por SciELO
Links relacionados
-
 Similares en
SciELO
Similares en
SciELO
Compartir

 Permalink
Epidemiologia e Serviços de Saúde
versión impresa ISSN 1679-4974versión On-line ISSN 2237-9622
Epidemiol. Serv. Saúde vol.31 no.2 Brasília 2022 Epub 26-Sep-2022
http://dx.doi.org/10.1590/s2237-96222022000200021
ORIGINAL ARTICLE
Analysis of trend in mortality due to HIV/AIDS-defining and non-HIV/AIDS defining illnesses according to sociodemographic characteristics, by Federative Unit and Brazil, 2000-2018
1Fundação Oswaldo Cruz, Escola Nacional de Saúde Pública Sergio Arouca, Rio de Janeiro, RJ, Brasil
Objective:
To analyze the temporal trend of mortality rate due to HIV/AIDS defining and non-HIV/AIDS defining illnesses in Brazil between 2000 and 2018.
Methods:
This was an ecological time series study, using data from the Mortality Information System, in Brazil and the Federative Units. Trend analysis was performed by means of Prais-Winsten regression model, according to overall mortality rate, sex, age group, marital status and race/skin color.
Results:
A total of 237,435 deaths were recorded in the period. In the country, defining illnesses showed higher rates (7.4 to 4.4 deaths/100,000 inhabitants in the period) than those observed among non-defining diseases (0.4 to 0.8 death/100,000 inhabitants in the period). It could be seen a decrease in overall mortality due to defining diseases (-6.3%; 95%CI -8.8;-3.8); while it increased due to non-defining diseases (11.0%; 95%CI 6.5;15.7).
Conclusion:
There was a change in HIV/AIDS mortality profile over the years, with a decrease in deaths due to HIV/AIDS-defining diseases.
Keywords: Mortality; HIV; Acquired Immunodeficiency Syndrome; Time Series Studies
Study contributions
Main results
This study showed that mortality due to non-HIV/AIDS defining illnesses has increased. Despite this scenario, it can be seen that the rates for HIV/AIDS-defining illnesses are still expressive.
INTRODUCTION
In 1996, universal, free of charge antiretroviral therapy (ART) was made available by the Brazilian National Health System (SUS).1 ART increased survival and improved quality of life among people living with human immunodeficiency virus (HIV) and those with manifestation of acquired immunodeficiency syndrome (AIDS).2
This treatment led to the occurrence of deaths from age-related diseases or long-term ART use, classified as non-HIV/AIDS defining illnesses, such as arterial hypertension, diabetes mellitus, heart diseases, neoplasms, kidney diseases among others. Thus, there was a decline in deaths from diseases associated with immunodeficiency that, until then, enabled the emergence of opportunistic illnesses, which are HIV/AIDS-defining illnesses, characterized by the occurrence of some specific diseases among people living with HIV/AIDS (PLHIV) who are immunosuppressed due to the evolution of HIV infection and the manifestation of AIDS, such as pneumonia and tuberculosis.2,3
Changing patterns of deaths from HIV/AIDS has given the health condition the status of chronic disease, although its defining illnesses still remain leading causes of death.2
Several factors may contribute to mortality due to HIV/AIDS in Brazil, such as sociodemographic characteristics, unfavorable living conditions and clinical issues, making it complex to define what primarily determines death from the disease.4,5
Worldwide, there was a 39% decrease in the number of deaths due to HIV/AIDS recorded between 2010 (1,100,000 deaths) and 2019 (780,000 deaths), being this decrease attributed to adherence to drug treatment for PLHIV.6
In Brazil, it could be seen a reduction in mortality due to HIV/AIDS after the distribution of ART, from approximately 10 deaths/100,000 inhabitants in 1995 to about 7 deaths/100,000 inhabitants, in 2000, four years after the implementation of the policy for universal and free of charge distribution of ART.7 Currently, in certain Federative Units, mortality rates are higher than those found in the country,7 a fact that may be related to a weakening of the Brazilian initiative in the response to HIV and disease control, in addition to a context of regional inequalities.6,8
Knowledge of the mortality profile based on sociodemographic characteristics and according to the type (defining and non-defining illnesses) is necessary. In the literature, most studies focus on the occurrence of diseases among PLHIV3 rather than a comparison between defining and non-defining illnesses, which is precisely this research proposal, and the purpose of which is to contribute to the understanding of deaths due to HIV/AIDS based on the type and sociodemographic factors. Moreover, this research can support the direction for public policies, incorporating the population profile according to defining and non-defining illnesses of infection and condition.
The aim of this study was to analyze the temporal trend of mortality rate due to HIV/AIDS defining and non-HIV/AIDS defining illnesses according to sociodemographic characteristics in Brazil, between 2000 and 2018.
METHODS
This was an ecological time series study of mortality rates due to HIV/AIDS defining and non-HIV/AIDS defining illnesses. The units of analysis were comprised of FUs and the country, and all deaths from HIV/AIDS recorded between 2000 and 2018 were taken into consideration.
Brazil has an extensive territorial area, with 8,510,345.538 km2 and a population of 213,317,639 people, corresponding to a population density of 22.43 inhabitants/km2, with 99.7% of the population aged between 6 and 14 at school age, while it has an illiteracy rate of 6.6% among those aged 15 years and over. The fertility rate in the country is 1.76 child per woman, and the gross domestic product (GDP) per capita was BRL 35,161.70. The Gini index in Brazil was 0.543 in 2019, while the human development index (HDI) was 0.765 that same year.
The country is divided into five macro-regions (North, Northeast, Midwest, South and Southeast regions), and subdivided into 26 states and the Federal District. The North region comprises 45% of the national territory, has a population of 18.6 million inhabitants, GDP corresponding to 5.3% of the national GDP, HDI of 0.730 and Gini index, 0.538. The Northeast region has an area of 1,554,291.744 km2, a population of 57 million inhabitants, GDP of BRL 1,004,828 million, HDI 0.710, and Gini index, 0.559. The Midwest has an area of 1,606,403.506 km², a population of 16,085,885 inhabitants, GDP, BRL 542.632 billion; HDI of 0.789; and Gini index, 0.503. The Southeast region corresponds to an area of 924,620.678 km², with a population of 87,711,946 inhabitants, GDP of BRL 2,295,690 million, HDI of 0.794 and Gini index, 0.525. The South region comprises an area of 7% of the Brazilian territory and had a population of 29,975,984 inhabitants, GDP of BRL 1.12 trillion, HDI of 0.756 and Gini index of 0.467. All these data are related to the year 2019.
This study used microdata from the Mortality Information System (SIM, as per the Brazilian acronym), via the Brazilian National Health System Information Technology Department (DATASUS, as per the Brazilian acronym) website in January 2022,9 in order to make it possible to classify deaths from defining and non-defining illnesses. It included all deaths registered in the International Statistical Classification of Diseases and Related Health Problems - 10th Revision (ICD-10), between the items B20 and B24, related to the group “Disease caused by the human immunodeficiency virus” in the underlying cause or in lines A, B, C, D and II of the Death Certificate (DC).
The classification of a death as HIV/AIDS-defining illness included all deaths presented in the classification of HIV/AIDS-defining illnesses of the Coding Causes of Death in HIV Protocol, published by the Centers for Disease Control and Prevention (CDC) of the United States (Box 1).10 With regard to non-defining illnesses, all those that were not in the list of defining illnesses were taken into consideration (Box 1).
Deaths were analyzed and classified as “death from defining illness” or “death from non-defining illness”, based on ICD-10 items registered in lines A, B, C, D and II of the DC. Deaths whose underlying cause presented ICD were identified, however, lines A, B, C, D and II did not have a register in the Classification. In these cases, the ICDs registered were those classified between items B20 and B24 of ICD-10 as HIV/AIDS - defining illnesses, because they are ICDs that characterize the occurrence of death from opportunistic infections.
Mortality rates due to HIV/AIDS defining and non-HIV/AIDS defining illnesses per 100,000 inhabitants were standardized using the direct method, and the Brazilian population was defined as a standard population.11 Standardization using the direct method aims at adjusting the effect of age on the general mortality rate (GMR), taking into consideration a standard population, with known age distribution, from which we can identify the weights known by the proportion of people in each age group, which will be applied to age-specific mortality rates.1 Regarding the direct method, GMRs by age groups of a population are applied to the population size of the standard population, making it possible to identify the expected deaths in each age group and, from the division of the total number of expected deaths by the standard population, calculate the standardized GMR.11
Mortality rates considered, as numerator, deaths from defining/non-defining illnesses, and as denominator, the population in the period. This calculation was performed according to the sociodemographic characteristics aforementioned.
The standardizations was made for general mortality, sex (female; male), marital status (married; unmarried) and race/skin color (White; Black). The analysis by race/skin color comprised the White and Black categories, the latter resulting from the aggregation of Black and Brown categories, while for the White race/skin color no aggregation was necessary since it was a single category. The aggregation of Blacks and Browns as Blacks was performed to enable the analysis of the Afro-descendant population in a unified way.
The variable “marital status” was also categorized, between married and unmarried. This aggregation was performed by the categories that represented the same meaning, married and unmarried, namely: single; married; widower; legally separated; in consensual union. For the category “married”, the categories “married” and “legally separated” were aggregated, while for “unmarried”, the stratifications “single”, “widower” and “legally separated” were aggregated.
Mortality rates were also calculated according to age group, in years: 0 to 14; 15 to 29; 30 to 59; 60 or over.
Population data, necessary to calculate mortality rates, were retrieved from the DATASUS and Instituto Brasileiro de Geografia e Estatística (IBGE) websites in November 2021.8 Regarding the calculation of the general mortality rates and age group, the population estimates available at the DATASUS website were used.8
With regard to the populations, according to race/skin color and marital status, it was necessary to extract data from IBGE. These data were accessed via the Application Programming Interface (API) of the Automatic Recovery System (SIDRA, as per the Brazilian acronym), using the SidraR package via the Rstudio statistical program. These populations are available for census years 2000 and 2010, so projections were made for the intercensal years up to 2018. The projections were calculated using the geometry projection method, which considers population growth to be constant.
Prais-Winsten regression model was used for trend analysis.12 Independent variables (X) refer to the years when the deaths occurred, and dependent variables (Y) correspond to the mortality rates. This model is applied in order to correct serial autocorrelation in time series, and it is necessary to use the Durbin-Watson test, in which the value of the test is measured from a scale ranging from 0 to 4. Values close to zero indicate the existence of maximum positive autocorrelation. When the values are close to 4, the serial autocorrelation is negative. However, if the Durbin-Watson value is close to 2, there is no serial autocorrelation.12
After the analysis of serial autocorrelation, the logarithmic transformation of (Y) values was performed in order to reduce the heterogeneity of the variance of residuals of the model. Subsequently, the Prais-Winsten regression model was used in order to estimate the b1 values of mortality rates. The b1 values of each of the rates were applied to the following formula for the calculation of the annual percentage change (APC):
Positive APC indicates an upward trend, while the negative corresponds to a decreasing trend; the series is called stationary when there is no significant difference between its value and zero.12
Finally, the 95% confidence intervals (95%CI) of the study measurements were calculated using the following formula:
The minimum and maximum values of b were identified from the 95%CI parameters generated by the statistical analysis software and applied in the formula, with the minimum value of b corresponding to the minimum point of CI, and the maximum value of b corresponding to the maximum point of CI.
The significance level considered was 5% in the Prais-Winsten model, for trend analysis. The steps of data organization, rate calculation, trend analysis and graphs were developed using the RStudio software, version 4.0.2.
This study was performed using publicly available secondary data, and did not involve interactions with humans. However, the project was submitted to the Research Ethics Committee of the Escola Nacional de Saúde Pública Sergio Arouca/Fundação Oswaldo Cruz (CEP/ENSP/Fiocruz), and was approved, Opinion No. 16, issued on November 23, 2020.
RESULTS
A total of 237,435 deaths from HIV/AIDS were recorded between 2000 and 2018. General mortality rates due to HIV/AIDS-defining illnesses ranged from 7.4 death/100,000 inhabitants, in 2000, to 4.4 death/100,000 inhabitants, in 2018. For non- HIV/AIDS defining illnesses, general mortality rates ranged from 0.4 deaths/100,000 inhabitants, in 2000, to 0.8 deaths/100,000 inhabitants, 2018 (Figure 1A).
Box 1 - Correspondence of the International Statistical Classification of Diseases and Related Health Problems - 10th Revision (ICD-10) by defining diseases established by the Centers for Disease Control and Prevention (CDC) of the United States
| ICD-10 - Description | |||
|---|---|---|---|
| A02.1 Salmonella sepsis | A31.1 Cutaneous mycobacterial infection | D75.2 Essential thrombocytosis | A17.0 Tuberculous meningitis |
| A07.3 Isosporiasis | A31.8 Other mycobacterial infections | E43 Unspecified severe protein-calorie malnutrition | A17.1 Meningeal tuberculoma |
| A09 Infectious gastroenteritis and colitis, unspecified | A31.9 Mycobacterial infection, unspecified | E43 Unspecified severe protein-calorie malnutrition | A17.8 Other tuberculosis of nervous system |
| A09 Infectious gastroenteritis and colitis, unspecified | A40.3 Sepsis due to Streptococcus pneumoniae | E44.0 Moderate protein-calorie malnutrition | A17.9 Tuberculosis of nervous system, unspecified |
| A15.0 Tuberculosis of lung, confirmed by sputum microscopy with or without culture | A68.9 Relapsing fever, unspecified | E44.1 Mild protein-calorie malnutrition | A18.0 Tuberculosis of bones and joints |
| A15.1 Tuberculosis of lung/confirmed by culture only | A81.2 Progressive multifocal leukoencephalopathy | E46 Unspecified protein-calorie malnutrition | A18.1 Tuberculosis of genitourinary system |
| A15.2 Tuberculosis of lung, confirmed histologically | B01.2 Varicella pneumonia | E46 Unspecified protein-calorie malnutrition | A18.2 Tuberculous peripheral lymphadenopathy |
| A15.3 Tuberculosis of lung, confirmed by unspecified means | B02.0 Zoster encephalitis | J11.0 Influenza due to unidentified influenza virus with unspecified type of pneumonia | A18.3 Tuberculosis of intestines, peritoneum glands |
| A15.4 Tuberculosis of intrathoracic lymph nodes, confirmed bacteriologically and histologically | B02.1 Zoster meningitis | J12.0 Adenoviral pneumonia | A18.4 Tuberculosis of skin and subcutaneous tissue |
| A15.5 Tuberculosis of larynx, trachea and bronchus, confirmed bacteriologically and histologically. | B02.2 Zoster with other nervous system involvement | J12.1 Respiratory syncytial virus pneumonia | A18.5 Tuberculosis of eye |
| A15.6 Tuberculosis pleurisy, confirmed bacteriologically and histologically | B02.3 Zoster ocular disease | J64 Unspecified pneumoconiosis | A18.7 Tuberculosis of adrenal glands |
| A15.7 Primary respiratory tuberculosis, confirmed bacteriologically and histologically | B02.7 Disseminated zoster | J65 Pneumoconiosis associated with tuberculosis | A18.8 Tuberculosis of other specified organs |
| A15.8 Other respiratory tuberculosis, confirmed bacteriologically and histologically | B02.8 Zoster with other complications | J65 Pneumoconiosis associated with tuberculosis | A19.0 Acute miliary tuberculosis of a single specific site |
| A15.9 Respiratory tuberculosis unspecified, confirmed bacteriologically and histologically. | B02.9 Zoster without complications | J67.8 Hypersensitivity pneumonitis due to other organic dusts | A19.1 Acute miliary tuberculosis of multiple sites |
| A15 Respiratory tuberculosis, confirmed bacteriologically and histologically | B25.0 Cytomegaloviral pneumonitis | J68.0 Bronchitis and pneumonitis due to chemicals, gases, fumes and vapors | A19.2 Acute miliary tuberculosis, unspecified |
| A16.0 Tuberculosis of lung, bacteriologically e histologically negative | B25.1 Cytomegaloviral hepatitis | J69.0 Pneumonitis due to inhalation of food and vomit | A19.8 Other miliary tuberculosis |
| A16.1 Tuberculosis of lung, bacteriological and histological examination not done | B25.2 Cytomegaloviral pancreatitis | J69.8 Pneumonitis due to inhalation of other solids and liquids | A19.9 Miliary tuberculosis, unspecified |
| A16.2 Tuberculosis of lung, without mention of bacteriological or histological confirmation | B25.8 Other cytomegaloviral diseases | J85.1 Abscess of lung with pneumonia | A31.0 Pulmonary mycobacterial infection |
| A16.3 Tuberculosis of intrathoracic lymph nodes, without mention of bacteriological or histological confirmation | B25.9 Cytomegaloviral disease, unspecified | K59.1 Functional diarrhea | C85 Other specified and unspecified types of non-Hodgkin lymphoma |
| A16.4 Tuberculosis of larynx, trachea and bronchus, without mention of bacteriological or histological confirmation | B37.1 Pulmonary candidiasis | R05 Cough | D46.0 Refractory anemia without ring sideroblasts |
| A16.5 Tuberculosis pleurisy without mention of bacteriological or histological confirmation | B39.3 Disseminated histoplasmosis capsulati | R50.1 Relapsing fever | D46.4 Refractory anemia, unspecified |
| A16.7 Primary respiratory tuberculosis, without mention of bacteriological or histological confirmation | B39.4 Histoplasmosis capsulati, unspecified | R50 Fever of other and unknown origin | D50.0 Iron deficiency anemia secondary to blood loss |
| A16.8 Other respiratory tuberculosis, without mention of bacteriological. or histological confirmation | B39.5 Histoplasmosis duboisii | R64 Cachexia | D50.8 Other iron deficiency anemias |
| A16.9 Respiratory tuberculosis unspecified, without mention of bacteriological or histological confirmation | B39.9 Histoplasmosis, unspecified | J17.1 Pneumonia in diseases classified elsewhere | D50.9 Iron deficiency anemia, unspecified |
| D52.0 Dietary folate deficiency anemia | J17.2 Pneumonia in mycoses, classified elsewhere | D51.0 Vitamin B12 deficiency anemia due to intrinsic factor deficiency | C46.9 Kaposi’s sarcoma, unspecified |
| B45.1 Cerebral cryptococcosis | J17.3 Pneumonia in parasitic diseases, classified elsewhere | D51.1 Vitamin B12 deficiency anemia due to selective vitamin B12 malabsorption with proteinuria | C82.9 Follicular lymphoma, unspecified |
| B45.2 Cutaneous cryptococcosis | J18.0 Bronchopneumonia, unspecified organism | D51.9 Vitamin B12 deficiency anemia, unspecified | C83.8 Other non-follicular lymphoma |
| B45.7 Disseminated cryptococcosis | J18.1 Lobar pneumonia, unspecified organism | J15.0 Pneumonia due to Klebsiella pneumoniae | C83.9 Non-follicular (diffuse) lymphoma, unspecified |
| B45.8 Other forms of cryptococcosis | J18.2 Hypostatic pneumonia, unspecified organism | J15.1 Pneumonia due to pseudomonas | C85.7 Other specified types of non-Hodgkin lymphoma |
| B45.9 Cryptococcosis, unspecified | J18.8 Other pneumonia, unspecified organism | J16.0 Chlamydial pneumonia | C85.9 Non-Hodgkin lymphoma, unspecified |
| B58.2 Toxoplasma meningoencephalitis | J18.9 Pneumonia NE | J16.8 Pneumonia due to other specific infectious organisms | D69.4 Other primary thrombocytopenia |
| B95.3 Streptococcus pneumoniae as the cause of disease classified elsewhere | J18 Pneumonia, unspecified organism | J15.4 Pneumonia due to other streptococci | D69.5 Secondary thrombocytopenia |
| B96.0 M. pneumoniae as the cause disease classified elsewhere | J64 Unspecified pneumoconiosis | J15.5 Pneumonia due to Escherichia coli | D69.6 Thrombocytopenia, unspecified |
| B96.1 K. pneumoniae as the cause of disease classified elsewhere | D52.9 Folate deficiency anemia, unspecified | J15.6 Pneumonia due to other gram-negative bacteria | J15.2 Pneumonia due to Staphylococcus |
| C46.0 Kaposi’s sarcoma of skin | D53.0 Protein deficiency anemia | J15.7 Pneumonia due to Mycoplasma pneumoniae | J15.3 Pneumonia due to Streptococcus do group B |
| C46.1 Kaposi’s sarcomoma of soft tissue | D53.2 Scorbutic anemia | J15.8 Pneumonia due to other specified bacteria | J12.9 Viral pneumonia, unspecified |
| C46.2 Kaposi’s sarcoma of palate | D53.8 Other specified nutritional anemias | J15.9 Unspecified bacterial pneumonia | J13 Pneumonia due to Streptococcus pneumoniae |
| C46.3 Kaposi’s sarcoma of lymph nodes | D53.9 Nutritional anemia, unspecified | J12.2 Parainfluenza virus pneumonia | J14 Pneumonia due to Hemophilus infuenzae |
| C46.7 Kaposi’s sarcoma of other sites | D55.0 Anemia due to glucose-6-phosphate dehydrogenase deficiency | J12.8 Other viral pneumonia | D69.3 Immune thrombocytopenic purpura |
| C46.8 Kaposi’s sarcoma of multiple organs | |||
In Brazil, there was a decreasing trend in mortality due to defining illnesses for the general population (APC = -6.3%; 95%CI -8.8;-3.8), as well as for females (APC = -5.4%; 95%CI -9.0;-1.7) and male (APC = -6.9%; 95%CI -8.7;-5.1) in the analysis of non-HIV/AIDS defining illnesses.
However, an upward trend was found in the states of the North and Northeast regions, mainly for HIV/AIDS-defining illnesses (Figure 1B).
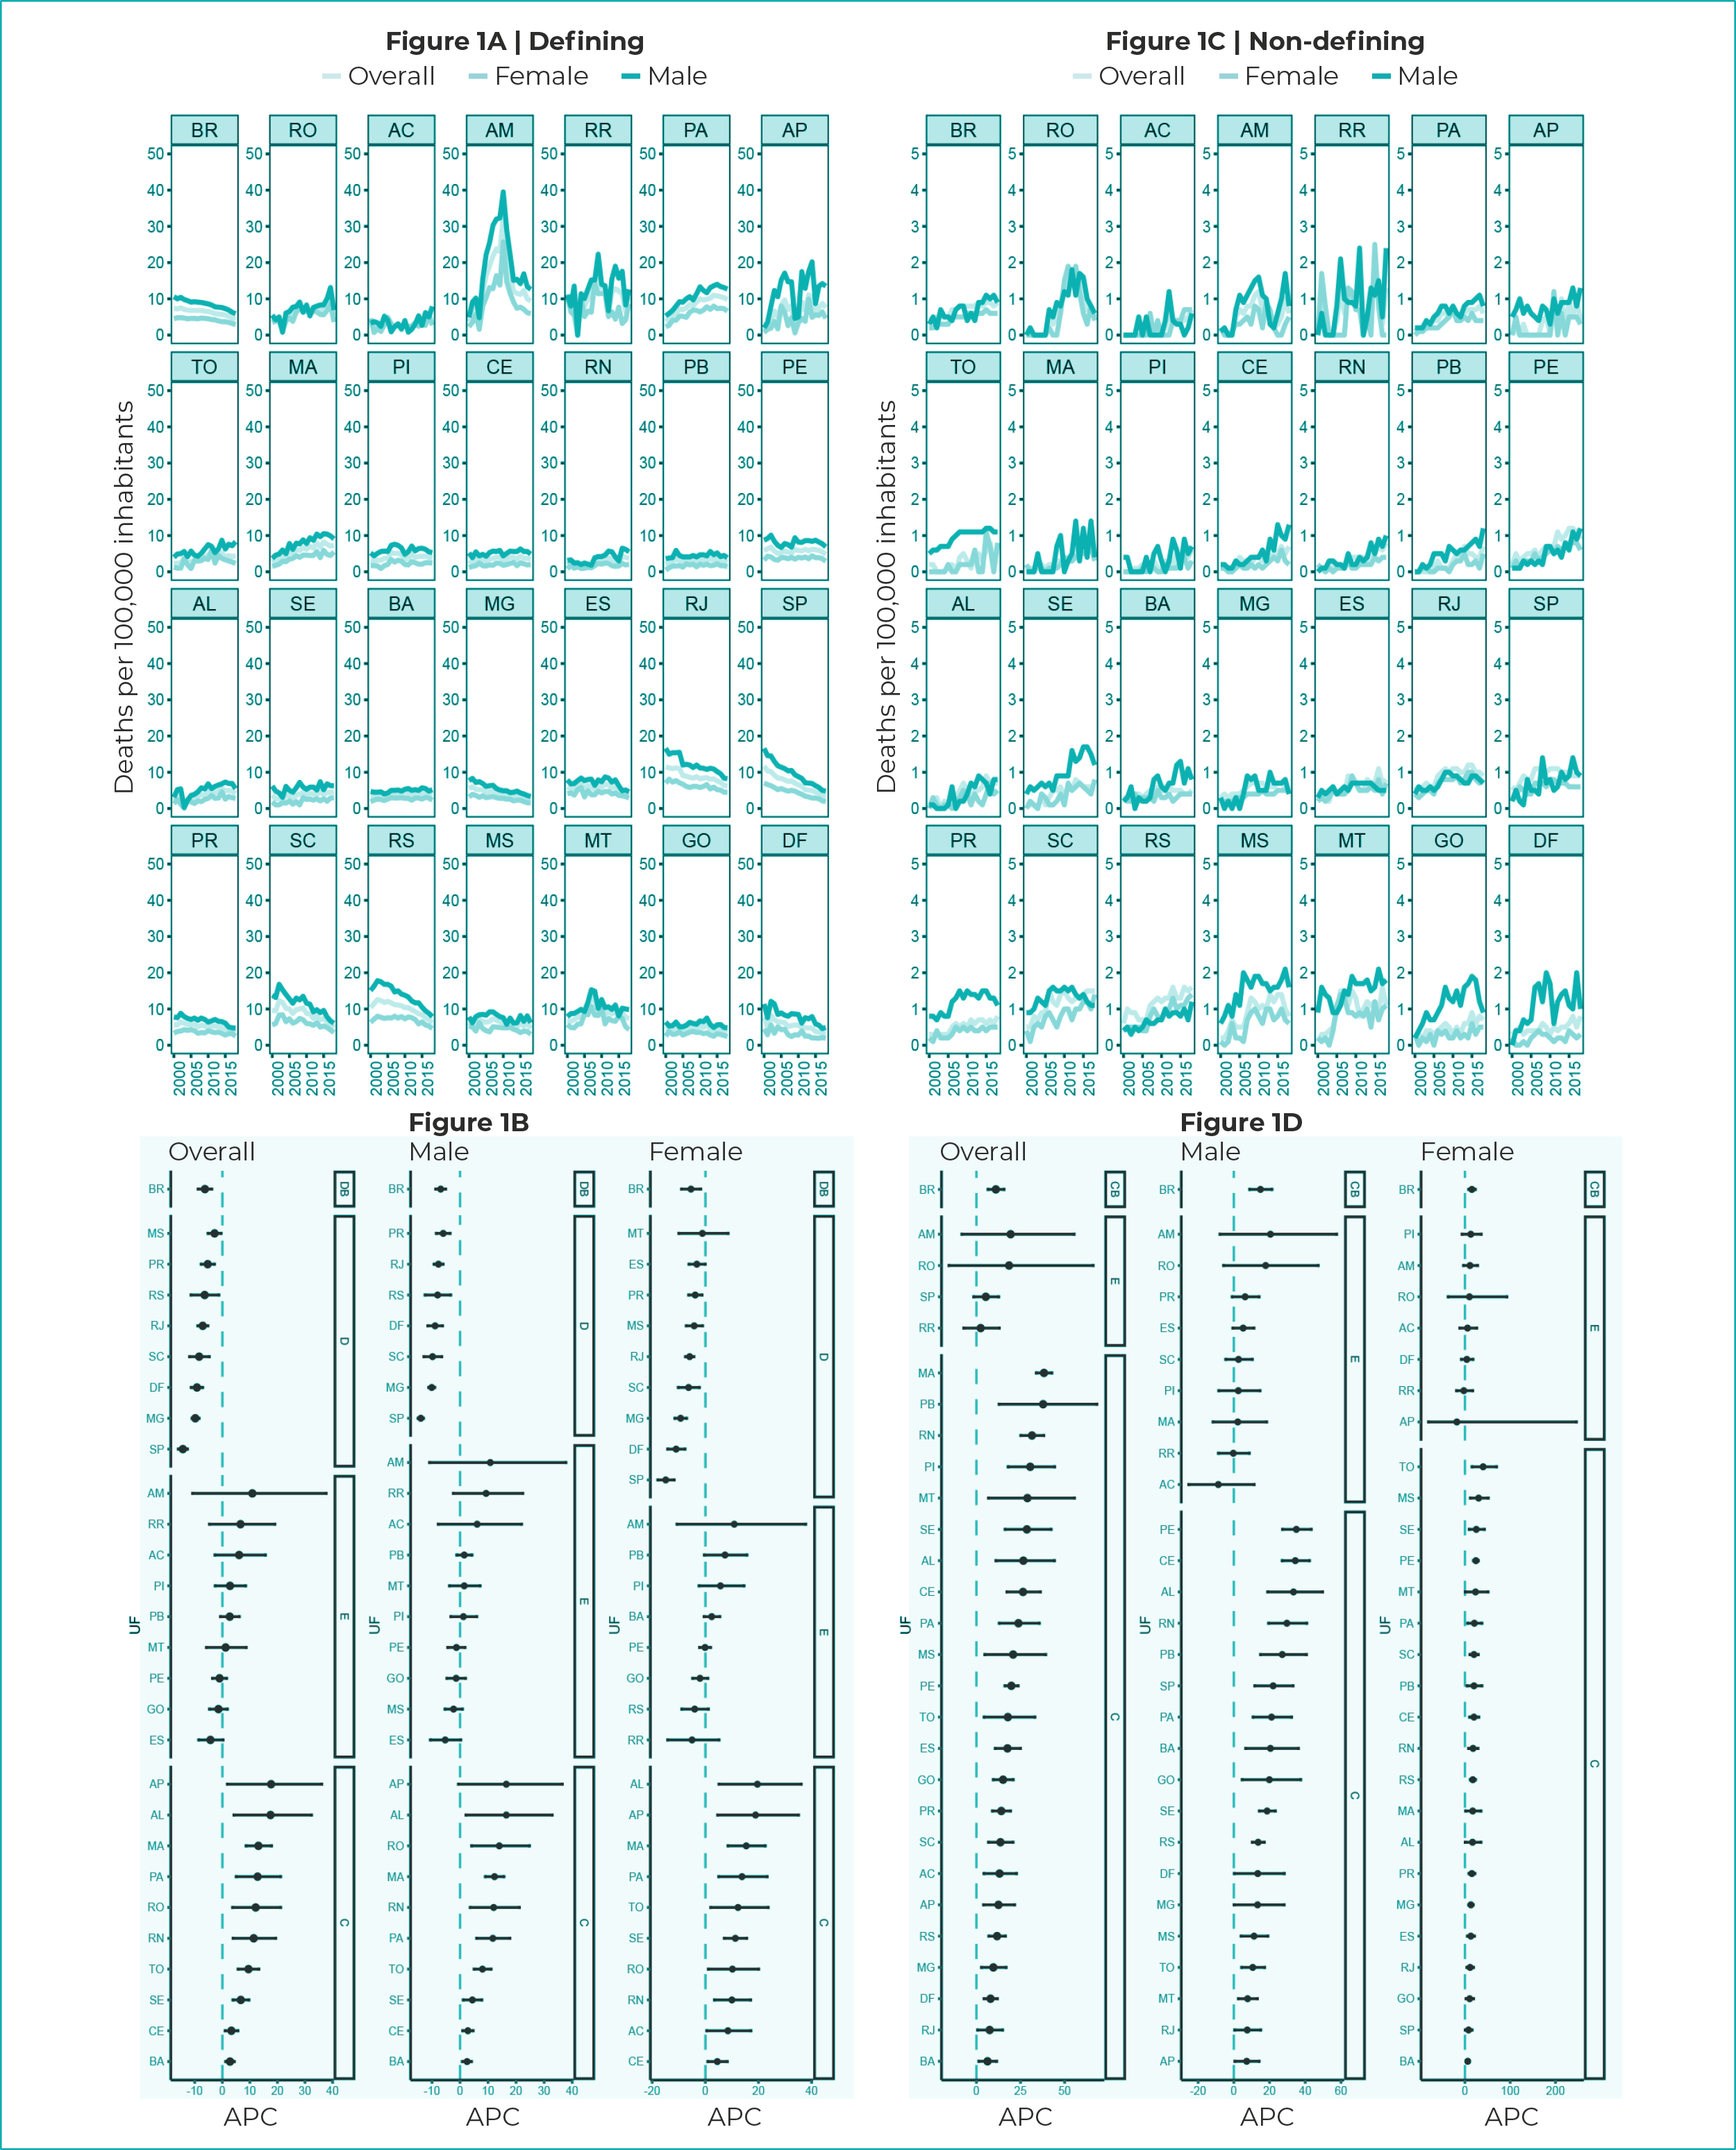
Legend: DB - decreasing trend in Brazil; SB - stationary trend in Brazil; IB - increasing trend in Brazil; D - decreasing trend; S - stationary trend; I - increasing trend; APC - Annual Percentage Change.
Figure 1 - Mortality rates and 95% confidence intervals with trends in HIV/AIDS-defining and non-HIV/AIDS illnesses, according to general mortality and by sex, Federative Units and Brazil, 2000-2018
It could be seen an upward trend among non-HIV/AIDS defining illnesses in Brazil (APC = 11.0%; 95%CI 6.5;15.7) and in the states, with the exception of São Paulo (APC = 5.3%; 95%CI -1.6;12.7), Amazonas (APC = 19.4%; 95%CI 8.3;55.4) and Roraima (APC = 2.4%; 95%CI -7.2;13.0) (Figure 1D).
With regard to mortality due to defining illnesses, according to age group, the rates were significant among those aged 60 years and over in the country (from 13.1 deaths in 2000 to 26.0 deaths/100,000 inhabitants in 2018), as well as among those aged 30 to 59 years (from 16.0 deaths in 2000 to 4.8 deaths/100,000 inhabitants in 2018) (Figure 2A). Rates related to defining illnesses in the 0 to 14 and 15 to 29 age groups showed close values, the lowest being close to 0.2 death/100,000 inhabitants (Figure 2A).
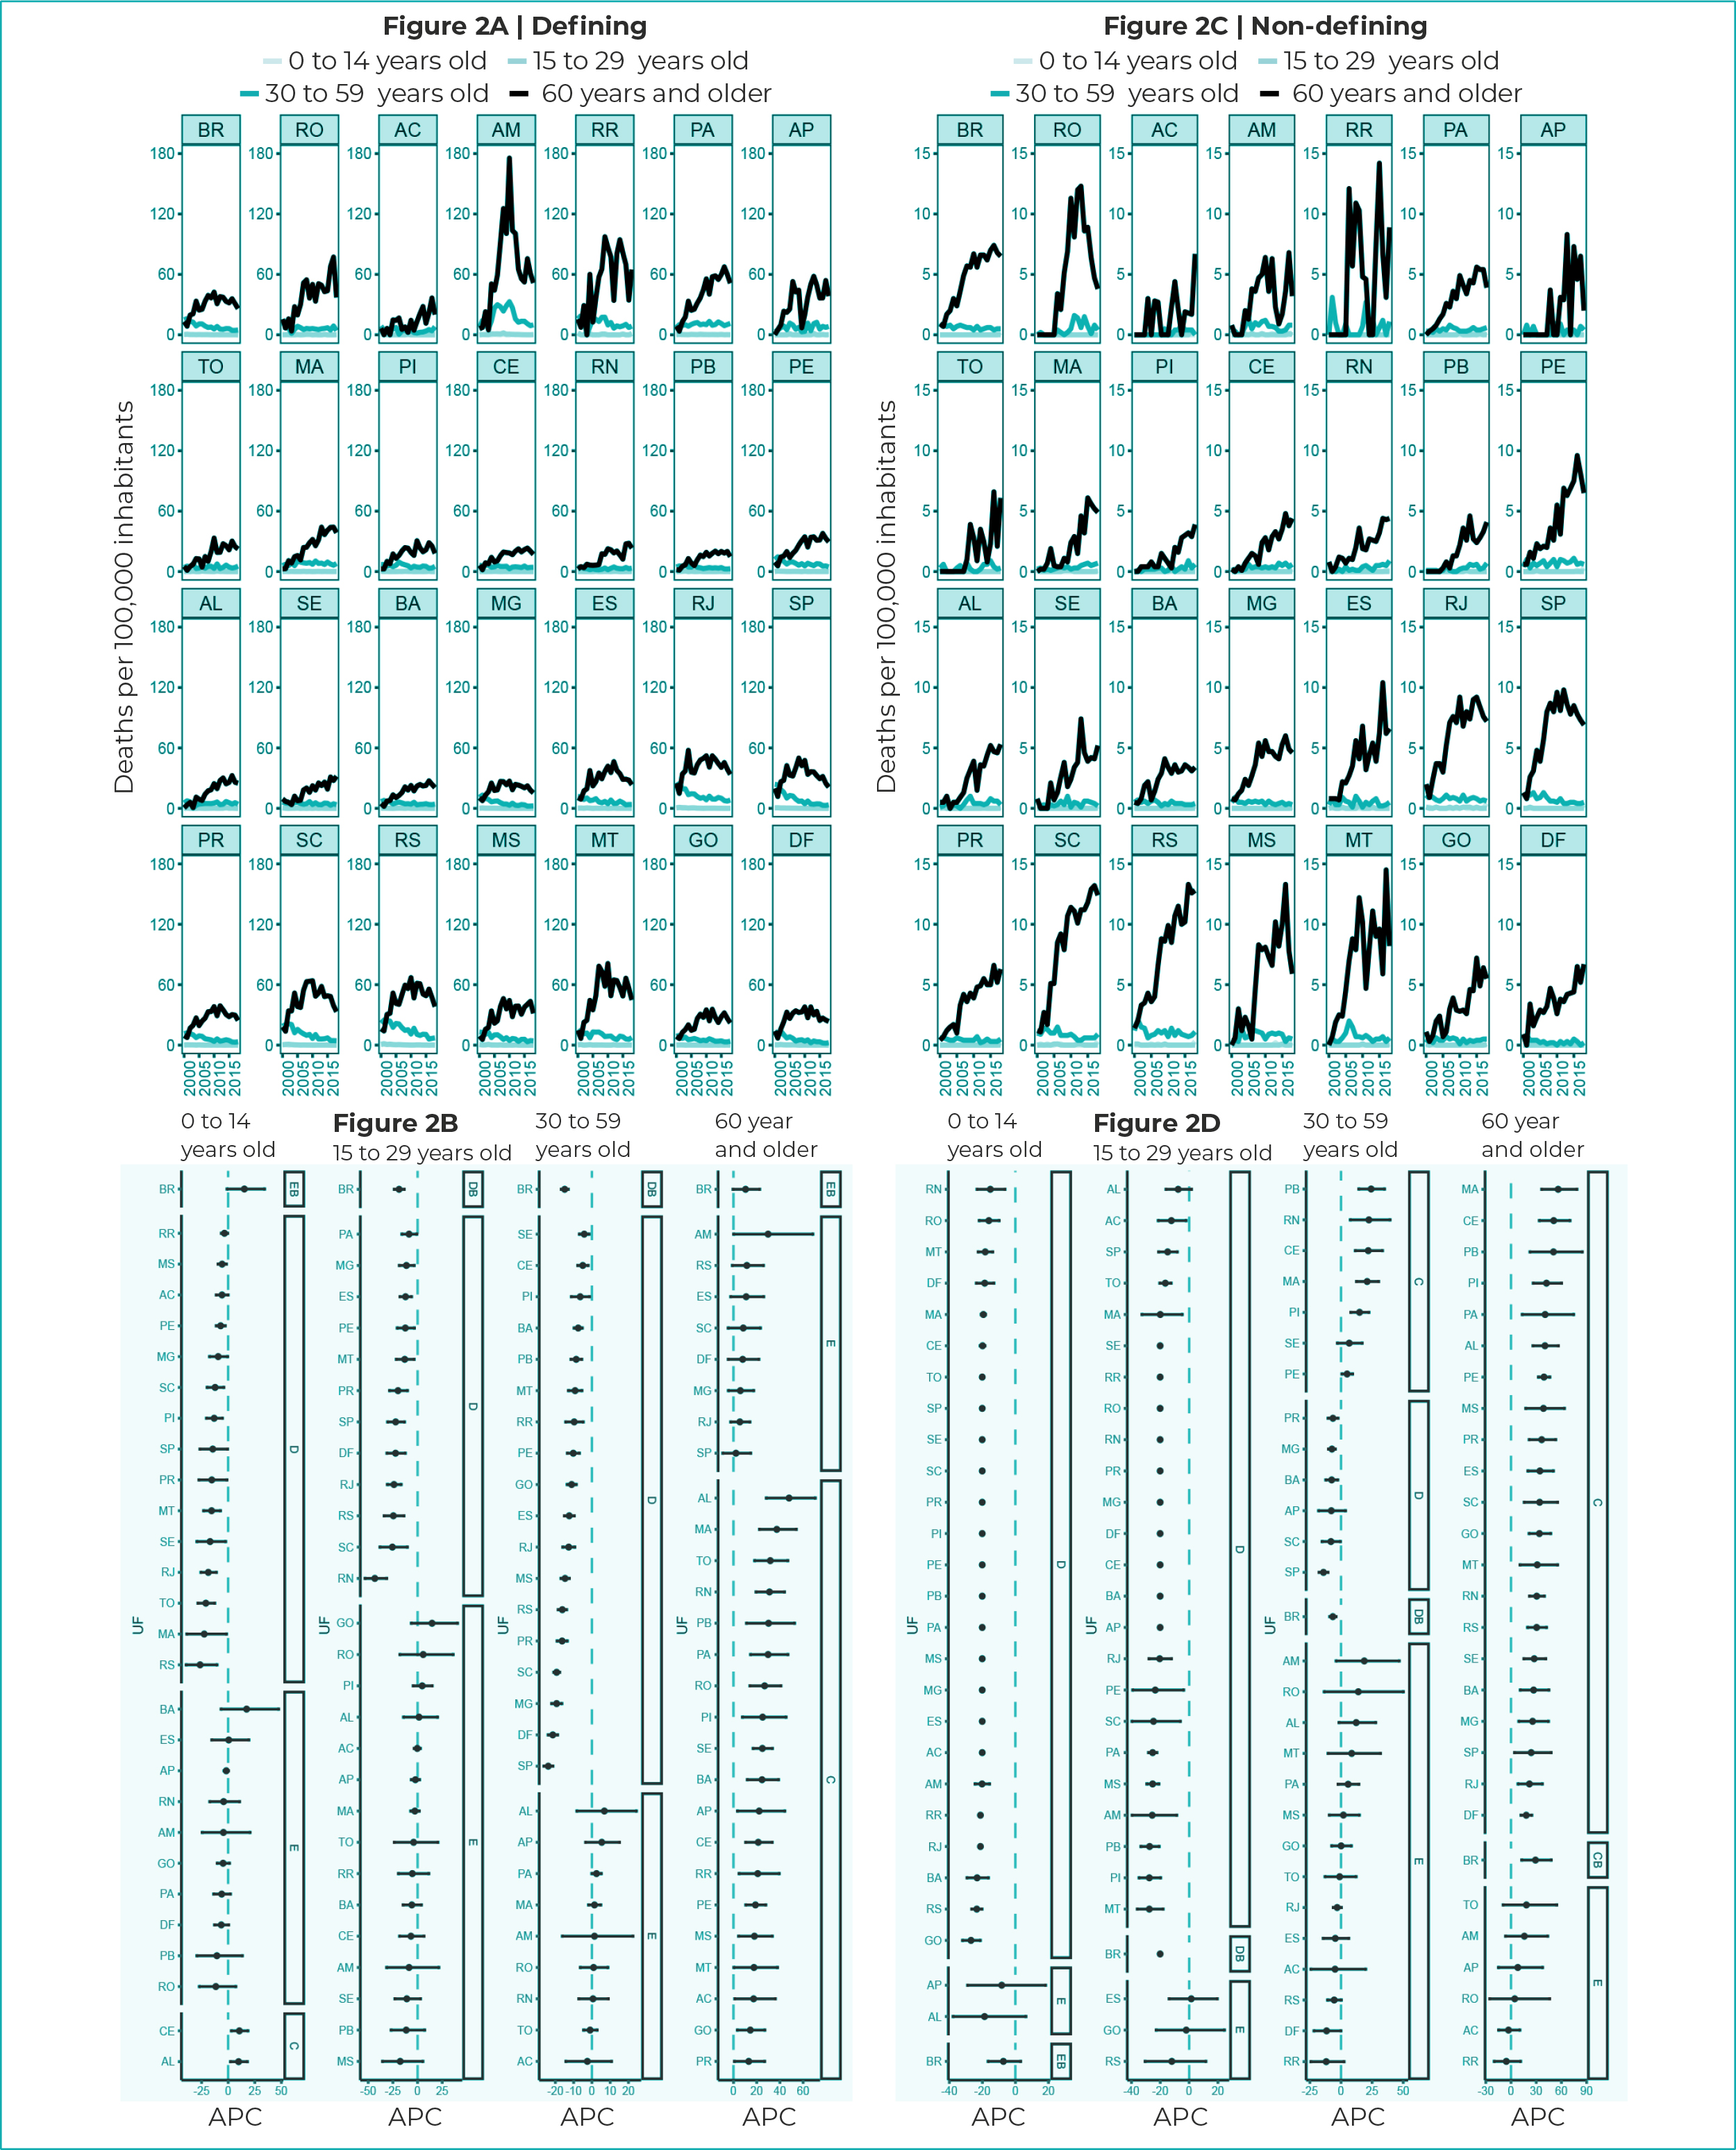
Legend: DB - decreasing trend in Brazil; SB - stationary trend in Brazil; IB - increasing trend in Brazil; D - decreasing trend; S - stationary trend; I - increasing trend; APC - Annual Percentage Change.
Figure 2 - Mortality rates and 95% confidence intervals with trends in HIV/AIDS-defining and non-HIV/AIDS defining illnesses, according to age group, Federative Units and Brazil, 2000-2018
Trend in mortality due to defining illnesses showed that in the 0 to 14 age group, only Ceará (APC = 10.5%; 95%CI 2.9;-18.7) and Alagoas (APC = 9.8%; 95%CI 2.1;18.1) showed an upward trend in mortality rates due to defining illnesses (Figure 2B). It could be seen that in the 15 to 29 age group, there was no increasing trend in any units of analysis, a fact that was also observed in the 30 to 59 age group (Figure 2B).
Among those aged 60 years and older, there was an upward trend in most of the geographic units of analysis, with the exception of the country (APC = 10.4%; 95%CI-0.5;22.6) and the states of Amazonas (APC = 29.8%; 95%CI -0.1;68.5), Rio Grande do Sul (APC = 11.5%; 95%CI -1.1;25.9), Espírito Santo (APC = 10.9%; 95%CI -2.5;26.1), Santa Catarina (APC = 8.4%; 95%CI -4.7;23.3), Federal District (APC = 7.9%; 95%CI -4.6;21.9), Minas Gerais (APC = 5.9%; 95%CI -4.5;17.5), Rio de Janeiro (APC = 5.5%; 95%CI -2.7;-14.2) and São Paulo (APC = 2.1%; 95%CI -9.3;14.9), which showed a stationary trend (Figure 2B).
Regarding non-HIV/AIDS defining illnesses, taking into consideration the country as a whole, there was a mostly decreasing trend in the 15 to 29 (APC = -20.1%; 95%CI -20.7;-19.5) and 30 to 59 (APC = -6.6%; 95%CI -9.1;-3.9) age groups. However, for those aged 60 years or over, there was an upward trend in most states and in Brazil (APC = 29.1%; 95%CI 12.6;-48.0) (Figure 2D).
Mortality rates due to defining illnesses and according to marital status were higher among unmarried individuals, throughout the period (from 27.0 deaths in 2000 to 12.4 deaths/100,000 inhabitants in 2018) (Figure 3A). In the state of Amazonas, rates due to defining illnesses were higher among unmarried individuals (from 9.1 deaths in 2000 to 22.9 deaths/100,000 inhabitants in 2018), with oscillations over the period. The states of Roraima, Pará and Amapá also showed significant rates among unmarried individuals (Figure 3A). Mortality due to non-defining illnesses showed lower rates when compared to defining illnesses (Figure 3A).
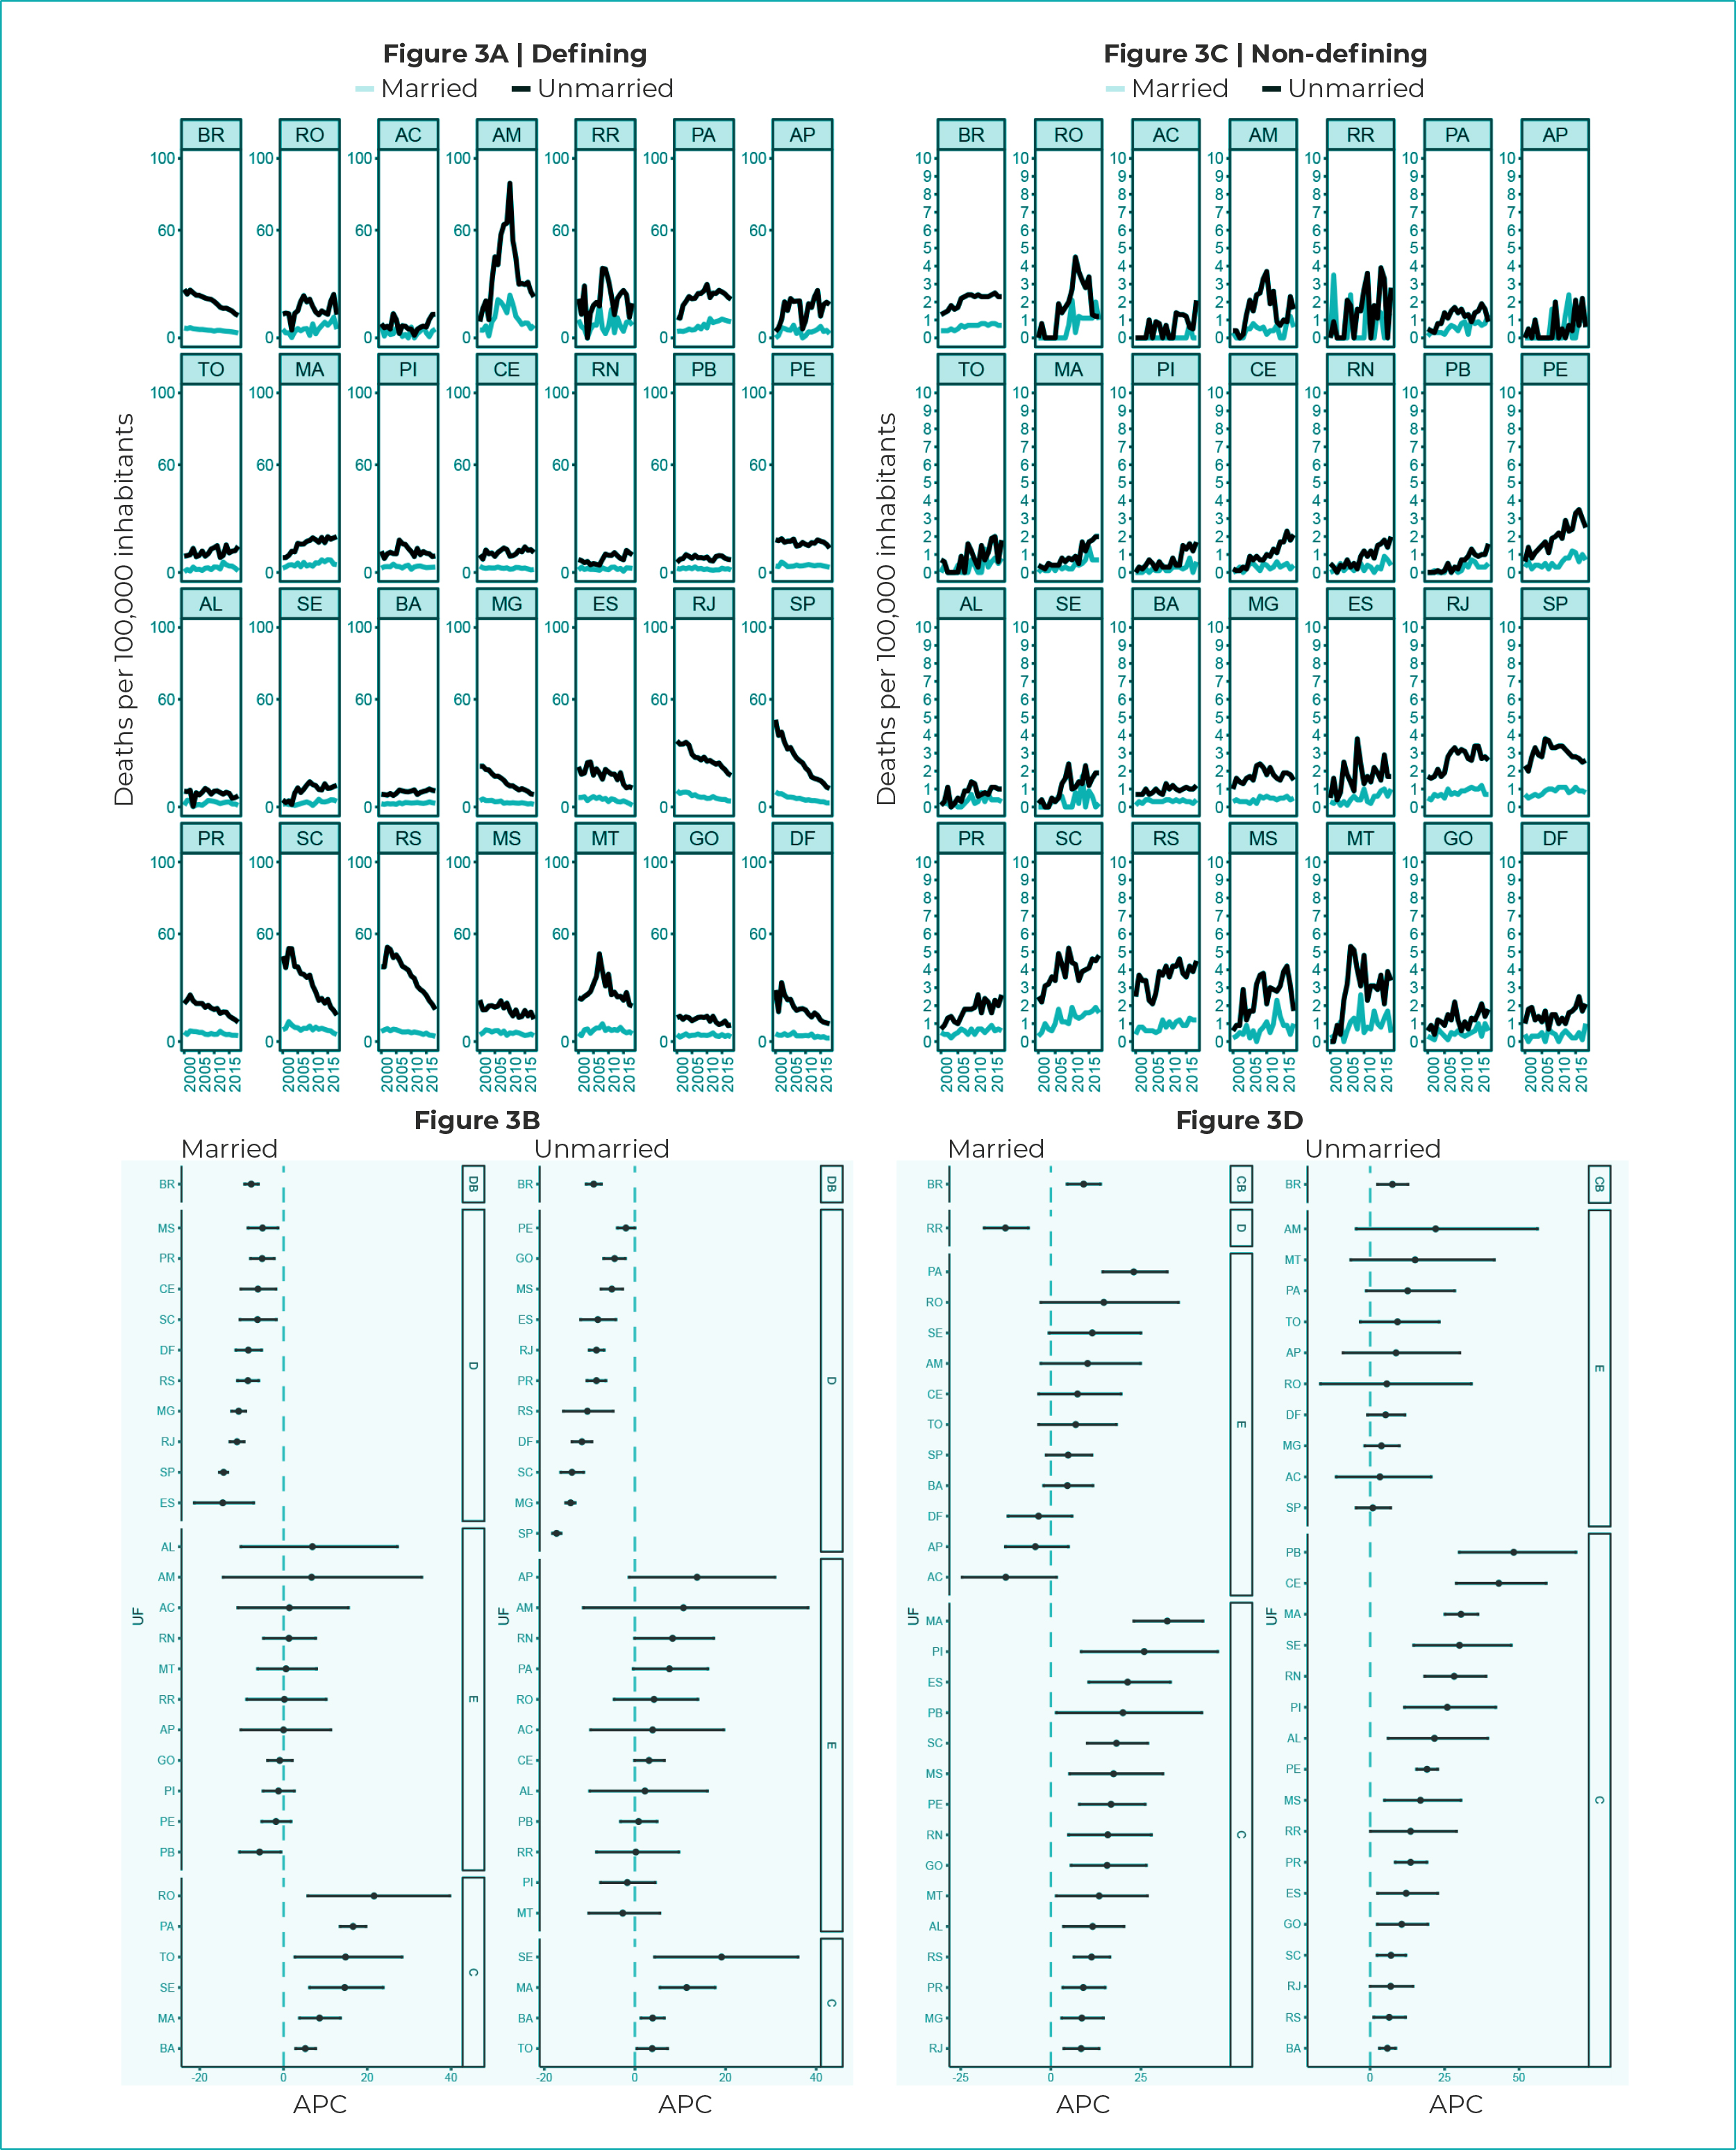
Legend: DB - decreasing trend in Brazil; SB - stationary trend in Brazil; IB - increasing trend in Brazil; D - decreasing trend; S - stationary trend; I - increasing trend; APC - Annual Percentage Change.
Figure 3 - Mortality rates and 95% confidence intervals with trends in HIV/AIDS-defining and non-HIV/AIDS defining illnesses, according to marital status, Federative Units and Brazil, 2000-2018
In Brazil, there was a decreasing trend for defining illnesses among married (APC = -7.7%; 95%CI -9.3;-6.0) and unmarried individuals (APC = -9.1%; 95%CI -10.8;-7.5), while there was an upward trend in both categories when the trends in non-defining diseases were evaluated: for married individuals (APC = 9.1%; 95%CI 4.5;13.8) and for unmarried individuals (APC = 7.5%; 95%CI 2.5;-12.7) (Figure 3B).
Mortality rates due to defining diseases in Brazil were higher when compared to non-defining diseases, also in the stratification by race/skin color (Figure 4A and 4D). Black people showed the highest rates for defining diseases, with the exception of the states of Amazonas, Roraima, Amapá, Maranhão, Santa Catarina, Rio Grande do Sul and Mato Grosso (Figure 4A). Mortality rates due to non-defining diseases were very close among White and Black races/skin color (Figure 4C).
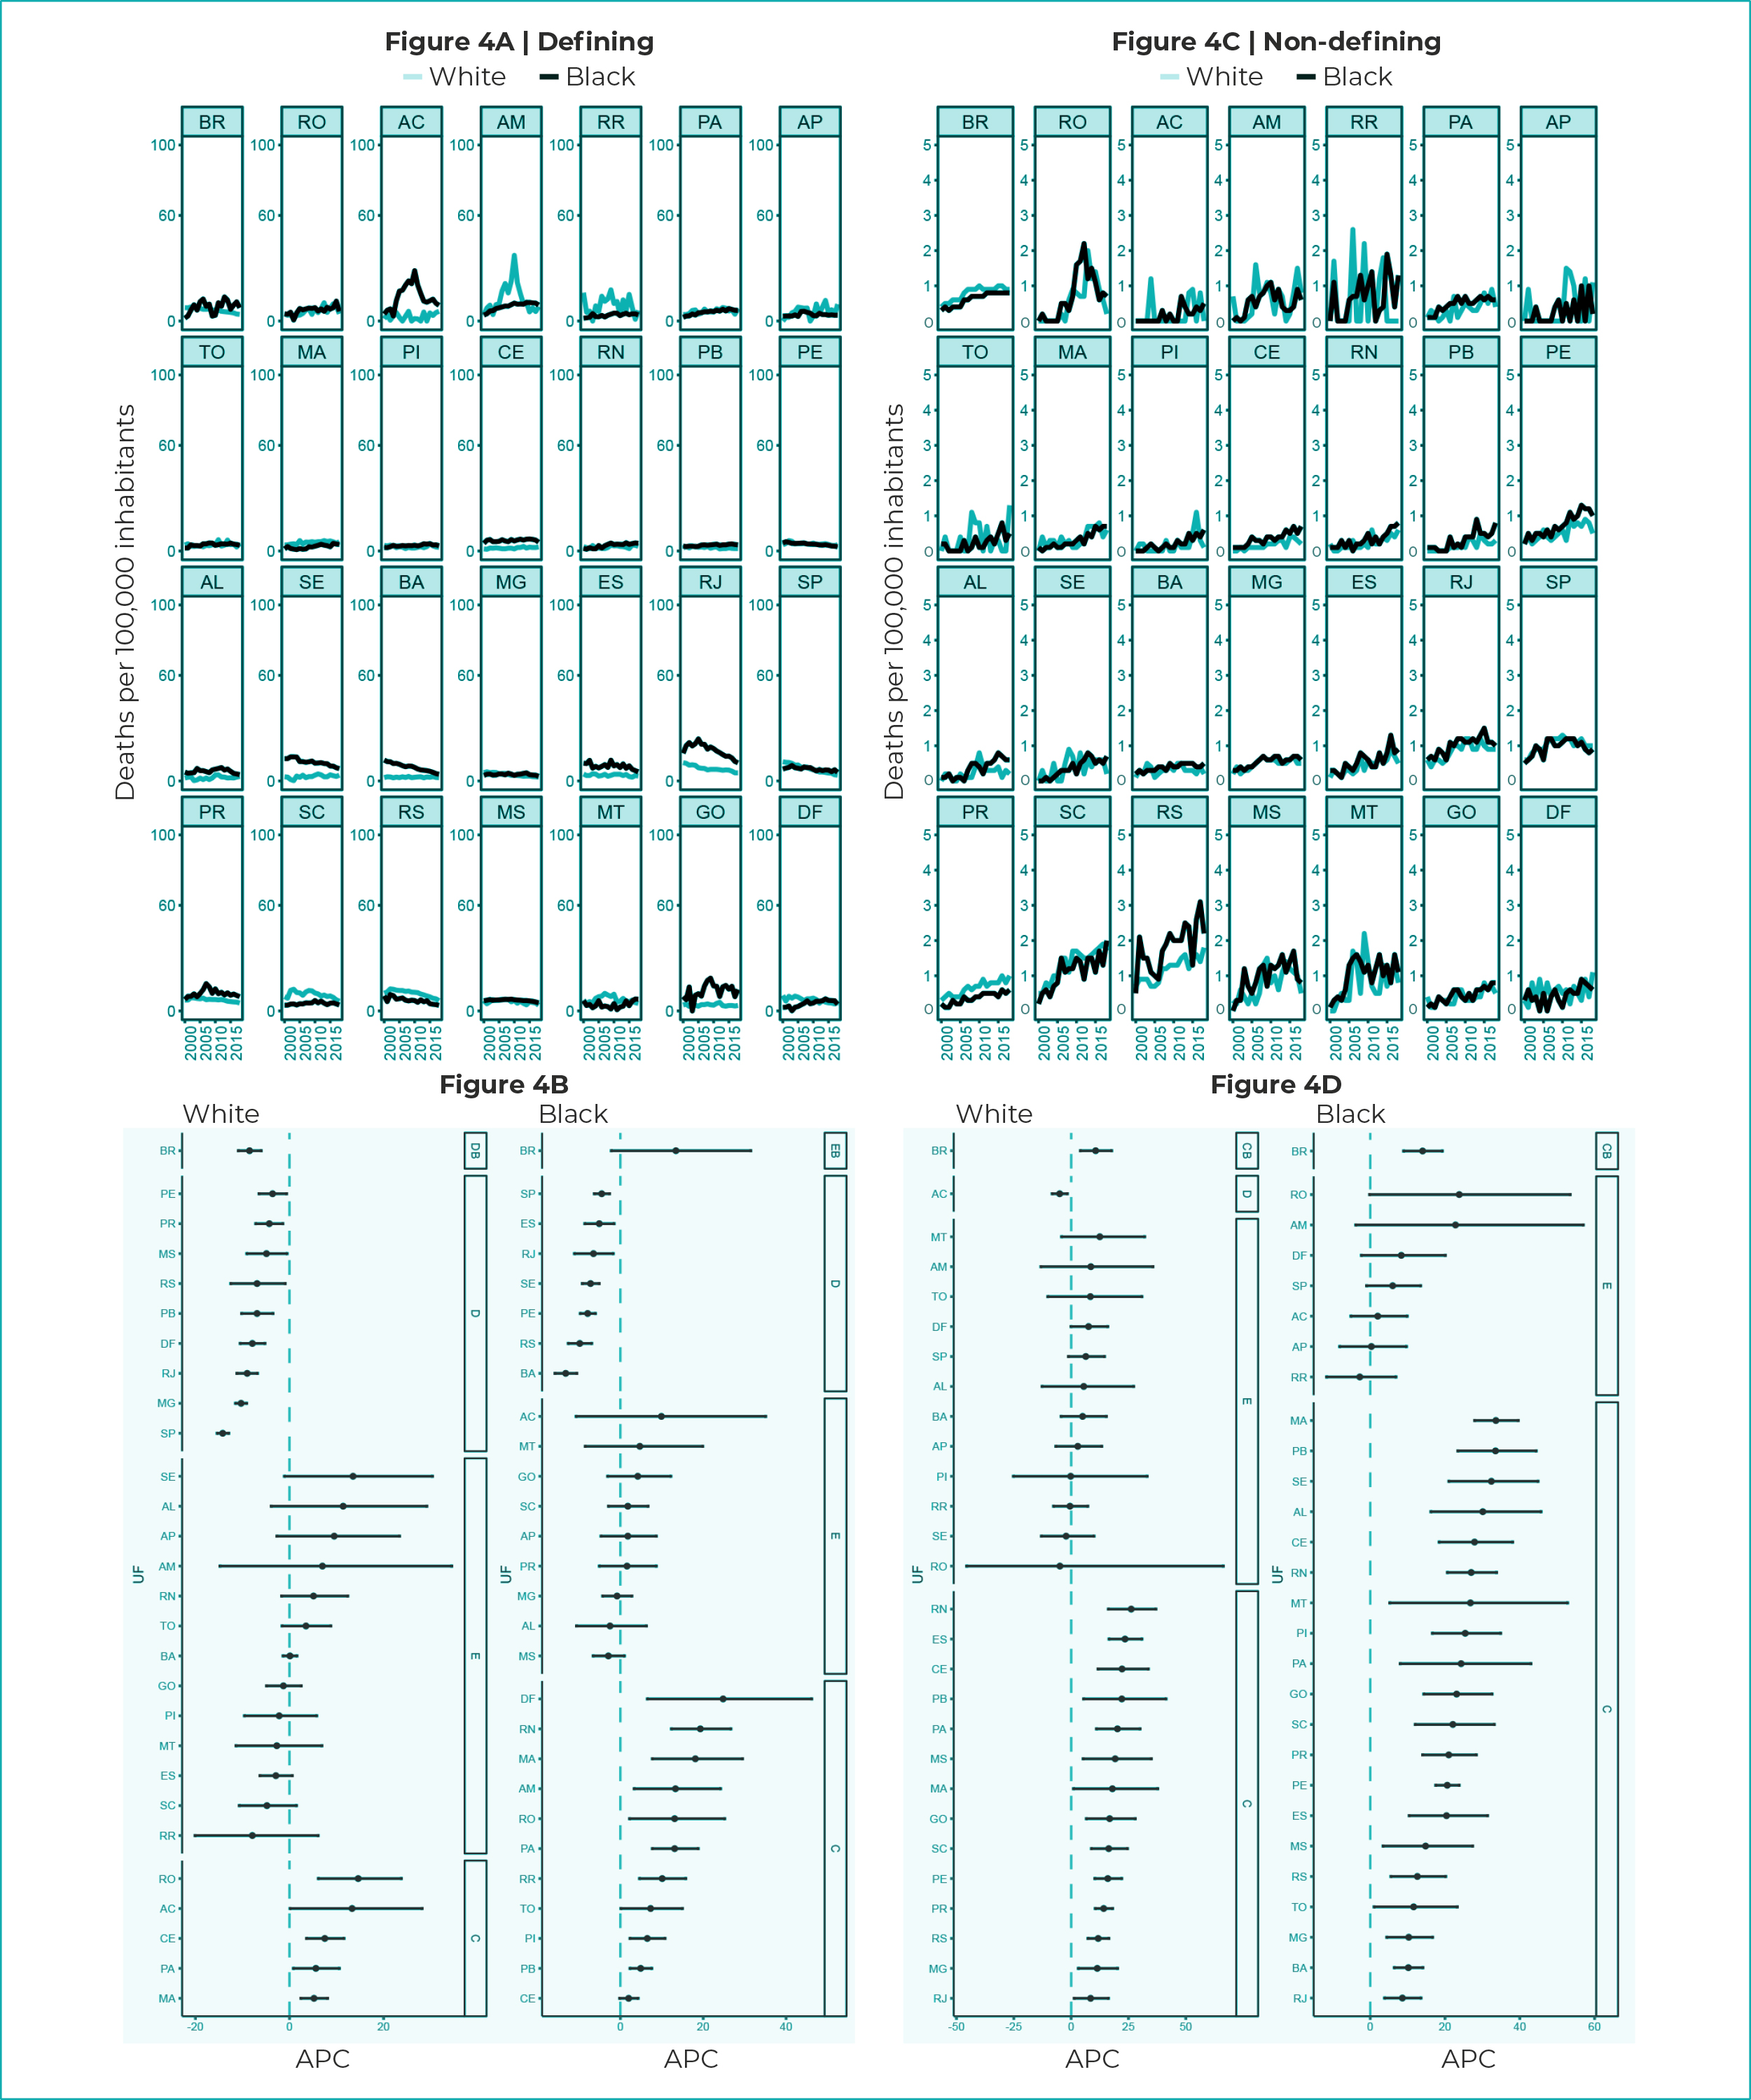
Legend: DB - decreasing trend in Brazil; SB - stationary trend in Brazil; IB - increasing trend in Brazil; D - decreasing trend; S - stationary trend; I - increasing trend; APC - Annual Percentage Change.
Figure 4 - Mortality rates and 95% confidence intervals with trends in HIV/AIDS-defining and non-HIV/AIDS defining illnesses, according to race/skin color, Federative Units and Brazil, 2000-2018
Mortality due to HIV/AIDS-defining illnesses among White race/skin color showed an upward trend in the states of Rondônia (APC = 14.6%; 95%CI 6.1;23.8), Ceará (APC = 7.5; 95%CI 3.6;11.6), Acre (APC = 13.3%; 95%CI 0.1;28.2), Pará (APC = 5.6%; 95%CI 2.4;8.1) and Maranhão (APC = 5.2%; 95%CI 2.4;8.1) (Figure 4B).
With regard to Black race/skin color, there was an upward trend in most states, namely: Ceará (APC = 2.0%; 95%CI -0.2;4.3), Rio Grande do Norte (APC = 19.3%; 95%CI 12.3;26.7), Paraíba (APC = 4.9%; 95%CI 2.3;7.6), Federal District (APC = 24.8%; 95%CI 6.5;46.2), Amazonas (APC = 13.3%; 95%CI 3.3;24.2), Roraima (APC = 10.1%; 95%CI 4.6;15.8), Pará (APC = 13.1%; 95%CI 7.7;18.8), Tocantins (APC = 7.3%; 95%CI 0.1;15.0), Maranhão (APC = 18.1%; 95%CI 7.7;29.5) and Piauí (APC = 6.5%; 95%CI 2.3;10.8) (Figure 4B). Mortality due to non-defining diseases showed an upward trend, either among individuals of White race/skin color, or among those of Black race/skin color (Figure 4C).
DISCUSSION
This study showed that the general mortality rates due to HIV/AIDS-defining illnesses are higher when compared to non-HIV/AIDS defining illnesses, regarding the analysis of the years between 2000 and 2018. According to sex, the rates for defining diseases were higher among males, compared to the female population.
In the observed period, mortality due to HIV/AIDS-defining illnesses showed a decreasing trend in the states of the South and Southeast regions, and upward and stationary trends in the North and Northeast regions, indicating the need for different measures aimed at controlling mortality due to the disease in these regions.5,13-15 Inequality in the regional distribution of services is likely to be contributing to this scenario.4
Nevertheless, non-HIV/AIDS defining illnesses showed an increasing trend in most states, when the general population and by sex were taken into consideration. The same pattern was found in other studies that pointed to an increase in deaths from non-defining illnesses.2,3,16
High mortality due to defining illnesses among males follows the pattern of mortality due to HIV/AIDS observed in the country and worldwide.3,17-19 However, females also need attention, because they have maintained an increasing trend in some states, when the defining illnesses are taken into consideration.
The oldest age groups, 30 to 59 and 60 years or over, showed higher rates of defining illnesses, while for non-defining illnesses, the age of 60 years or over showed more significant values. This scenario indicates that currently, mortality due to the disease can include individuals reaching advanced age who have acquired illnesses that are typical of HIV/AIDS, while the remaining people may be those who, after long-term ART use, suffered from the side effects of treatment and even from common conditions of older age.3,16-21
Regarding marital status, unmarried individuals showed higher rates of HIV/AIDS-defining illnesses. In addition, although mortality rates were higher among unmarried individuals, there was an upward trend, according to defining diseases, in the states of the Northeast region, and it could be seen an increasing trend, in most states, also among non-HIV/AIDS defining illnesses. High mortality rates among unmarried individuals were found in a study conducted in Papua, Indonesia, focusing on overall mortality, and the type of mortality was not detailed, whether due to defining diseases or not.21
Studies show that, depending on local culture, married individuals may be more vulnerable to HIV/AIDS, such as that observed in a rural area of South Africa, from 2000 to 2017, while in other locations the disease may be concentrated among unmarried individuals.23,24
The analysis based on race/skin color showed that mortality rates were higher among Black individuals in most states, according to defining diseases. There was also an upward trend in these rates, both for defining and non-defining illnesses. The highest proportion of the upward trend in non-defining illnesses was observed among Black individuals, while upward and stationary trends were found among White individuals, a result that may be linked to an ongoing increase in mortality due to non-defining illnesses among the population. Black population is in a greater social vulnerability25-28 and the change in their mortality patterns may occur at a slower rate than that observed in the population of White race/skin color.
A number of factors expose the population of Black race/skin color to mortality due to HIV/AIDS, such as unemployment, difficulty in accessing health care services and fear of seeking treatment due to discrimination.26
A study that analyzed the trend in mortality due to HIV/AIDS in Rio Grande do Sul and its capital, Porto Alegre, when checking mortality according to race/skin color, identified higher rates among Black and Brown individuals, between 2000 and 2011.29
This study has limitations related to possible incompleteness and inconsistencies in the data used. However, there was a significant improvement in SIM data resulting from the reduction in records of ill-defined causes of death. The analysis of comorbidities associated with HIV/AIDS may contribute to a better analysis of the dynamics of mortality due to HIV/AIDS and, consequently, a reduction in deaths from the disease.
Taking these results, it can be concluded that the findings of this research can contribute to the deepening of the analysis of mortality due to HIV/AIDS and thus, support the planning and management of public health actions. The existence of high mortality rates due to HIV/AIDS-defining diseases may indicate a scenario of inequalities in death from the disease. However, further studies are needed to deepen this analysis.
REFERENCES
1. Brasil. Lei nº 9.313, de 13 de novembro de 1996. Dispõe sobre a distribuição gratuita de medicamentos aos portadores do HIV e doentes de AIDS. Diário Oficial da União, Brasília (DF), 1996 nov 14. Seção 1: 23725. [ Links ]
2. Tsuda H, Koga M, Nojima M, Senkoji T, Kubota M, Kikuchi T, et al. Changes in survival and causes of death among people living with HIV: Three decades of surveys from Tokyo, one of the Asian metropolitan cities. J Infect Chemother. 2021;27(7):949-56. doi: 10.1016/j.jiac.2021.02.003 [ Links ]
3. Paula AA, Pires DF, Alves Filho P, Lemos KRV, Veloso VG, Grinsztejn B, et al. Perfis de mortalidade em pessoas vivendo com HIV/aids: comparação entre o Rio de Janeiro e as demais unidades da federação entre 1999 e 2015. Rev Bras Epidemiol. 2020;23:e200017. doi: 10.1590/1980-549720200017 [ Links ]
4. Santos IL, Cordeiro MRD, Melo MC. Uma década de mortalidade hospitalar de internações associadas ao HIV/AIDS segundo vulnerabilidade social em Campinas: um estudo de coorte retrospectivo. Braz J Infect Dis. 2022;26(1):102157. doi: 10.1016/j.bjid.2021.102157 [ Links ]
5. Montanha RM, Kerbauy G, Arcêncio RA, Furuya RK, Ferreira NMA, Tiroli CF, et al. Fatores demográficos e clínicos associados ao óbito por AIDS em uma região no Sul do Brasil. BJDV. 2022;8(1):6033-51. doi: 10.34117/bjdv8n1-409 [ Links ]
6. United Nations Programme on HIV/AIDS. 2020 Global AIDS Update - Seizing the moment - Tackling entrenched inequalities to end epidemics. Geneva: Joint United Nations Programme on HIV/AIDS; 2020. 384 p. [ Links ]
7. Boletim Epidemiológico. HIV/Aids | 2021. Brasília: Ministério da Saúde; 2021 [citado 10 de janeiro de 2022]. Disponível em: Disponível em: http://www.aids.gov.br/pt-br/pub/2021/boletim-epidemiologico-hivaids-2021 [ Links ]
8. Melo EA, Maksud I, Agostini R. Cuidado, HIV/Aids e atenção primária no Brasil: desafio para a atenção no Sistema Único de Saúde?. Rev Panam Salud Publica. 2018;42:e151. doi: 10.26633/RPSP.2018.151 [ Links ]
9. Ministério da Saúde (BR). Banco de dados do Sistema Único de Saúde (Datasus): transferência de arquivos. Brasília: Ministério da Saúde ; 2021 [citado 2021 Jan 3]. Disponível em: Disponível em: https://datasus.saude.gov.br/transferencia-de-arquivos// [ Links ]
10. Center for Disease Control and Prevention. National Black HIV/AIDS Awareness Day - February 7, 2013. MMWR Morb Mortal Wkly Rep. 2013;62(4):74. [ Links ]
11. Costa AJL, Kale PL, Vermelho LL. Indicadores de Saúde. In: Medronho RA, organizador. Epidemiologia. 2. ed. Rio de Janeiro: Atheneu; 2009. p. 31-82. [ Links ]
12. Antunes JLF, Cardoso MRA. Uso da análise de séries temporais em estudos epidemiológicos. Epidemiol Serv Saúde. 2015;24(3):565-76. doi: 10.5123/S1679-49742015000300024 [ Links ]
13. Ribeiro LCS, Freitas MIF, Tupinambás U, Lana FCF. Late diagnosis of Human Immunodeficiency Virus infection and associated factors. Rev Lat Am Enfermagem. 2020;28:e3342. doi: 10.1590/1518-8345.4072.3342 [ Links ]
14. Guimarães MDC, Carneiro M, Abreu DMX, França EB. Mortalidade por HIV/Aids no Brasil, 2000-2015: motivos para preocupação?. Rev Bras Epidemiol. 2017;20(Supl 1):182-90. doi: 10.1590/1980-5497201700050015 [ Links ]
15. Mangal TD, Meireles MV, Pascom ARP, Coelho RA, Benzaken AS, Hallett TB. Determinants of survival of people living with HIV/AIDS on antiretroviral therapy in Brazil 2006-2015. BMC Infect Dis. 2019;19(1):206. doi: 10.1186/s12879-019-3844-3 [ Links ]
16. Johnson LF, May MT, Dorrington RE, Cornell M, Boulle A, Egger M, et al. Estimating the impact of antiretroviral treatment on adult mortality trends in South Africa: a mathematical modelling study. PLoS Med. 2017;14(12):e1002468. doi: 10.1371/journal.pmed.1002468 [ Links ]
17. Croxford S, Kitching A, Desai S, Kall M, Edelstein M, Skingsley A, et al. Mortality and causes of death in people diagnosed with HIV in the era of highly active antiretroviral therapy compared with the general population: an analysis of a national observational cohort. Lancet Public Health. 2017;2(1):e35-e46. doi: 10.1016/S2468-2667(16)30020-2 [ Links ]
18. Weber A, Tombini LHT, Silva DTR, Pitilin EB, Rosa GD, Souza T. Análise da tendência temporal da infecção pelo HIV/AIDS na região oeste catarinense: estudo retrospectivo 1984-2015. Rev Epidemiol Controle Infecç. 2020;10(1):30-7. doi: 10.17058/jeic.v1i1.13089 [ Links ]
19. Smith CJ, Ryom L, Weber R, Morlat P, Pradier C, Reiss P, et al. Trends in underlying causes of death in people with HIV from 1999 to 2011 (D:A:D): a multicohort collaboration. The Lancet. 2014;384(9939):241-8. doi: 10.1016/S0140-6736(14)60604-8 [ Links ]
20. Lima MS, Firmo AAM, Martins-Melo FR. Trends in AIDS-related mortality among people aged 60 years and older in Brazil: a nationwide population-based study. AIDS Care. 2016;28(12):1533-40. doi: 10.1080/09540121.2016.1191608 [ Links ]
21. Hamidi O, Poorolajal J, Tapak L. Identifying predictors of progression to AIDS and mortality post-HIV infection using parametric multistate model. Epidemiology, Biostatistics and Public Health. 2017;14(2): e12438-1- e12438-9. doi: 10.2427/12438 [ Links ]
22. Waine I, Rantetampang AL, Msen Y, Mallongi A. Factors Related to HIV/AIDS Transmission by People with HIV/AIDS in Dogiyai District Papua Province. Int J Sci Healthc Res. 2018;3(4):91-8. [ Links ]
23. Tlou B. The influence of marital status on HIV infection in an HIV hyperendemic area of rural South Africa, 2000-2017. Afr J AIDS Res. 2019;18(1):65-71. doi: 10.2989/16085906.2018.1559209 [ Links ]
24. Momenyan S, Kavousi A, Poorolajal J, Momenyan N. Spatial inequalities and predictors of HIV/AIDS mortality risk in Hamadan, Iran: a retrospective cohort study. Epidemiol Health. 2018;40:e2018038. doi: 10.4178/epih.e2018038 [ Links ]
25. Nascimento A do, Fernandes F, Soyinka W, Nascimento EL. O genocídio do negro brasileiro: processo de um racismo mascarado. São Paulo: Perspectiva; 2016. 229 p. [ Links ]
26. Cockerham WC. Social causes of health and disease. 2nd ed. Cambridge: Polity; 2015. 255 p. [ Links ]
27. Ministério da Saúde (BR). e. Secretaria de Atenção à Saúde. Departamento de Ações Programáticas Estratégicas. Política Nacional de Atenção Integral à Saúde da Mulher: princípios e diretrizes. 1a. ed., 2a. reimp. Brasília: Ministério da Saúde ; 2011. 80 p. (Série C--Projetos, programas e relatórios). [ Links ]
28. Pascom ARP, Meireles MV, Benzaken AS. Sociodemographic determinants of attrition in the HIV continuum of care in Brazil, in 2016. Medicine. 2018;97(Suppl 1):S69-S74. doi: 10.1097/MD.0000000000009857 [ Links ]
29. Cunha AP, Cruz MM, Torres RMC. Tendência da mortalidade por aids segundo características sociodemográficas no Rio Grande do Sul e em Porto Alegre: 2000-2011. Epidemiol Serv Saúde. 2016;25(3):477-86. doi: 10.5123/S1679-49742016000300004 [ Links ]
ASSOCIATED ACADEMIC WORK Article derived from the Doctoral thesis entitled Mortality due to HIV/AIDS in Brazil between 2000 and 2018: the analysis was based on the sociodemographic profile, associated comorbidities and living conditions, submitted by Ana Paula da Cunha to the Postgraduate Program in Public Health of the Doctorate in Public Health, of the Escola Nacional de Saúde Pública Sergio Arouca/Fundação Oswaldo Cruz (ENSP/Fiocruz), in 2021.
Received: March 07, 2022; Accepted: July 25, 2022
 Este é um artigo publicado em acesso aberto sob uma licença Creative Commons
