


 texto em
  Inglês (pdf)
 Artigo em XML
 Referências do artigo
 Enviar este artigo por email
 Citado por SciELO
  Similares em
SciELO
Similares em
SciELO 
 Permalink
Study contributions
Main results
Medical consultations were the most frequent services and dental visits were the least frequent services among older adults. Dental visits and nutritional counseling were the most frequent services among those with higher level of education. Use of the the Brazilian National Health System (Sistema Único de Saúde − SUS) was most frequent in older adults, with lower level of education and lower income.
Introduction
Individual and collective health can be influenced by contextual and territorial differences, as well as by social distinction.1 In order to cope with these differences, health services are tools that have the potential to reduce health inequalities, and intersectoral actions and health policies are essential for the full performance of interventions aimed at changing the health status of the population.1-3
Use of health services is defined as the user's contact with such services, for the purpose of preventing, promoting maintenance or health recovery, and the reasons for seeking these services can vary and depend on individual needs and the community context.3 In Brazil, the public and private sectors offer health services to the population.4
The Brazilian National Health System (Sistema Único de Saúde − SUS) corresponds to the health services provided by the public sector, with the possible participation of the private sector in a complementary manner. Unlike the previous Brazilian health system, which was characterized by fragmentation and inequalities in care, SUS aims to provide universal health coverage, taking into consideration the principles of universality, integrality, equity, social participation, decentralization, hierarchization and regionalization.4,5
The analysis of social inequalities regarding the quality, access and use of health services is of utmost importance for assessing the performance of health systems.2 Since its implementation, SUS has contributed significantly to the reduction of health inequalities in Brazil; however, taking into consideration the social and economic differences among the macro-regions of the country, inequalities in population access and health care are still present.2
An individual's health conditions are not determined solely by biological and individual issues. Social determinants of health are social, cultural, behavioral, economic, political and racial conditions that also influence population health, highlighting that a disease process is not only determined by a relationship between cause and effect, but also by inequities.5
In this sense, the development of population-based research is of utmost importance for the evaluation of socioeconomic inequalities related to the use of health services.2 This type of research aims to promote improvements in the functioning of health systems and policies, as well as to establish relationships between the hierarchical levels of social determinants and their impact on population health.1,5
This study aimed to assess inequalities in the use of health services in a municipality in Southern Brazil.
Methods
This was a population-based cross-sectional study conducted in the municipality of Criciúma, state of Santa Catarina, between March and December 2019. Criciúma has 219,393 inhabitants, a population density of 815.87 inhabitants per km2, a human development index of 0.788 and a gross domestic product per capita of BRL 36,073.31.6 The data used in this study were derived from the research entitled Health of the Population of Criciúma, the first population-based study conducted among adults and older adults living in the municipality, with the objective of analyzing their health and associated factors.
All individuals aged 18 years or older living in the urban area of Criciúma were considered eligible for the study. Individuals unable to answer and/or conclude the interview due to cognitive deficits were excluded.
The sample estimation was based on data from the 2010 Population Census and was performed in two stages: first, (i) the selection of census tracts (primary units), and then (ii) the selection of households (secondary units) from primary units.7 All 306 census tracts located in the urban area of Criciúma with private households were listed, in ascending order and according to the code determined by the Brazilian Institute of Geography and Statistics (Instituto Brasileiro de Geografia e Estatística − IBGE), of these, 25% were randomly selected, totaling 77, in which 15,218 households were identified, 618 of them systematically selected to take part in the study. All eligible residents of the selected households were invited to participate.
For data collection, a single face-to-face, pre-coded and standardized questionnaire was administered, whose average administration time was 30 minutes, addressing sociodemographic, behavioral, anthropometric and health questions.
The outcomes studied were: medical consultation (yes; no); dental visit (yes; no); receiving nutritional counseling by a nutritionist, doctor or nurse (yes; no); and use of public or private health services. Use of SUS (yes; no), corresponding to the performance of one of the services provided by SUS, was also an outcome assessed. The information was reported by the participants and had as reference the year prior to the interview.
The independent variables were: sex (male; female); age (in years: 18 to 29; 30 to 39; 40 to 49; 50 to 59; 60 or older); race/skin color (White; Black; mixed-race/Asian/Indigenous); income (in Brazilian Real [BRL]: up to 500.00; 500.00 to 1,000.00; 1,001.00 to 2,000.00; 2,001.00 or more); and schooling (in years of study: 0 to 4; 5 to 8; 9 to 11; 12 or more).
Descriptive analyses of absolute and relative frequencies were performed and 95% confidence intervals (95%CI) were calculated for all variables studied. In order to assess the outcomes (use of SUS; medical consultation; dental visit; and receiving nutritional counseling) according to sex, age, race/skin color, income and schooling, prevalences and 95%CI were calculated and the differences were tested using Pearson's chi-square test; and adjusted analyses, by means of Poisson regression with robust variance.8 As a measure of effect of the adjusted analysis, the prevalence ratio (PR) was presented. The significance level of 5% and 95%CI were considered.
For the adjusted analyses, a hierarchical model was built to identify possible confounders.9 In the first level of this model, sex, race/skin color and age were included; and income and schooling were included in the second level. The variables that presented a significance level of 20% (p-value < 0.20) remained in the final analysis model.
Inequalities were assessed taking into consideration the variables age, income and schooling. In order to measure such inequalities, the Slope Index of Inequality (SII) was used. In this index, the difference in percentage points of the prevalence of outcomes in the extreme groups of the independent variables included were calculated, thus comparing the most favored with the least favored groups (in this study: age 18-29 versus ≥ 60 years; income ≥ BRL 2,001.00 versus < 500.00; schooling ≥ 12 versus 0-4 years of study). Positive values indicate a higher prevalence of the outcome in the most favored group of the independent variable, while negative values indicate a higher prevalence of the outcome in the least favored group of the independent variable.10-13 Equiplots were also built, with the aim of illustrating inequalities.
All statistical analyses were performed using Stata software, version 16.0, and considered complex sampling employed using the svy command.
The project was approved by the Research Ethics Committee of the Universidade do Extremo Sul Catarinense on December 14, 2018: Protocol No. 3,084,521 [Certificate of Submission for Ethical Appraisal (Certificado de Apresentação para Apreciação Ética - CAAE) No. 04033118.4.0000.0119]. All interviewees agreed to participate in the research by signing the Free and Informed Consent Form before the interview.
Results
A total of 820 individuals were interviewed, mostly female (63.78%) and of white race/skin color (82.50%). Approximately half of them were ≥ 60 years of age (45.00%) and had completed up to 8 years of education (53.60%); as for income, about one third (31.19%) received between BRL 1,001.00 and 2,000.00 per month (data not shown in the tables). Losses and refusals acconted for 13.9%.
Regarding the use of health services, 96.32% of the interviewees had used at least one of the services assessed in the previous year. Among those who used them, 40.43% used public services and 35.97% private services, while the use of services provided by both public and private sectors was mentioned by 23.60% of the participants. As for consultations, 88.30% of the sample had a medical consultation, 64.44% of whom in SUS. The frequency of dental visits was 68.79%, most of them in the private sector (71.70%). Just over a quarter of the interviewees had received nutritional counseling (29.78%), 58.82% of them in SUS (Table 1).
Table 1 Use of health services in the last year by individual living in Criciúma, state of Santa Catarina, Brazil, 2019 (n = 820)
| Variables | n | % (95%CI)a |
|---|---|---|
| Use of health services b | ||
| No | 30 | 3.68 (2.58;5.22) |
| Yes | 785 | 96.32 (94.78;97.42) |
| Nature of health service c | ||
| Public | 317 | 40.43 (37.04;43.92) |
| Private | 282 | 35.97 (32.68;39.40) |
| Public and private | 185 | 23.60 (20.75;26.70) |
| Performance of medical consultations | ||
| No | 95 | 11.70 (9.66;14.10) |
| Yes | 717 | 88.30 (85.90;90.34) |
| Nature of service where the medical consultation was performed d | ||
| Public | 462 | 64.44 (60.85;67.86) |
| Private | 255 | 35.56 (32.14;39.15) |
| Performance of dental consultation e | ||
| No | 242 | 31.31 (28.13;34.67) |
| Yes | 531 | 68.79 (65.33;71.87) |
| Nature of service where the dental consultation was performed f | ||
| Public | 150 | 28.30 (24.62;32.30) |
| Private | 380 | 71.70 (67.70;75.40) |
| Received nutritional counseling | ||
| No | 573 | 70.22 (66.99;73.26) |
| Yes | 243 | 29.78 (26.73;33.01) |
| Nature of service where he or she received nutritional counseling g,h | ||
| Public | 90 | 58.82 (50.80;66.40) |
| Private | 63 | 41.18 (33.60; 49.20) |
a) 95%CI: 95% confidence interval; b) Medical consultation, dental consultation or receiving nutritional counseling, in the public or private sector, in the last year; c) For those who answered "yes" to the variable "use of health services"; d) For those who answered "yes" to the variable "medical consultation"; e) Maximum percentage of unknown observations for dental consultation: 5.7% (n = 47); f) For those who answered "yes" to the variable "dental consultation"; g) For those who answered "yes" to the variable "nutritional counseling"; h) The answers "other", "media" and "hospital" were excluded from the analysis, because they did not consider the sector of the service.
The prevalence of use of SUS was higher among females (p-value = 0.002), in older adults (p-value = 0.001), with lower monthly income (p-value < 0.001) and lower level of education (p-value < 0.001). After adjustment, the lower the income and schooling, the higher the use of SUS (p-value < 0.001 for the two variables) (Table 2).
Table 2 Prevalence and prevalence ratio (PR) adjusted for the use of Brazilian National Health System's services by the sociodemographic characteristics of the population, Criciúma, state of Santa Catarina, Brazil, 2019
| Variables | n | % (95%CI)a | p-valueb | PR (95%CI) | p-valuec |
|---|---|---|---|---|---|
| Sex | 0.002 | 0.772 | |||
| Male | 100 | 44.84 (38.41;51.46) | 1.00 | ||
| Female | 217 | 57.71 (52.64;62.63) | 0.98 (0.83;1.15) | ||
| Age (years) | 0.001 | 0,280 | |||
| 18-29 | 22 | 33.85 (23.26;46.34) | 0.78 (0.54;1.12) | ||
| 30-39 | 26 | 39.39 (28.21;51.81) | 0.89 (0.65;1.22) | ||
| 40-49 | 38 | 60.32 (47.60;71.78) | 1.15 (0.92;1.43) | ||
| 50-59 | 72 | 58.54 (49.56;66.98) | 1.05 (0.88;1.25) | ||
| ≥ 60 | 159 | 56.38 (50.51;62.08) | 1.00 | ||
| Race/skin color d | 0.098 | 0,169 | |||
| White | 246 | 51.04 (46.57;55.49) | 1.00 | ||
| Black | 24 | 66.67 (49.38;80.39) | 1.27 (0.98;1.64) | ||
| Mixed-race/Asian/Indigenous | 40 | 59.70 (47.40;70.90) | 1.09 (0.91;1.32) | ||
| Income (Brazilian Real - BRL) | < 0.001 | < 0,001 | |||
| < 500.00 | 72 | 68.57 (58.98;76.80) | 2.00 (1.56;2.57) | ||
| Between 500.00 and 1,000.00 | 89 | 68.99 (60.42;76.43) | 1.76 (1.36;2.27) | ||
| Between 1,001.00 and 2,000.00 | 96 | 56.80 (49.18;64.12) | 1.63 (1.27;2.10) | ||
| ≥ 2,001.00 | 54 | 30.17 (23.85;37.33) | 1.00 | ||
| Schooling (years of study) | < 0.001 | < 0,001 | |||
| 0-4 | 118 | 71.08 (63.68;77.51) | 3.36 (2.07;5.43) | ||
| 5-8 | 107 | 68.59 (60.83;75.43) | 3.24 (2.00;5.25) | ||
| 9-11 | 76 | 39.58 (32.87;46.71) | 2.00 (1.22;3.28) | ||
| ≥ 12 | 16 | 18.82 (11.78;28.71) | 1.00 |
a) 95%CI: 95% confidence interval; b) Pearson’s chi-square test; c) Wald test; d) Missing data in 7 participants.
Younger individuals showed a lower prevalence of medical consultations (p-value = 0.002), and higher prevalence of dental visits (p-value < 0.001). Lower level of education was associated with lower prevalence of dental visits (p-value < 0.001) and receiving nutritional counseling (p-value = 0.008). After adjustment, younger individuals (18-29 years) presented lower prevalence (PR = 0.88; 95%CI 0.79;0.97) and higher dental visits (PR = 1.14; 95%CI 1.00;1.30) of medical consultations when compared to older adults (≥ 60 years). The lower the level of education, the lower the prevalence of dental visits (p-value < 0.001). Those who had completed up to 4 years of education had lower prevalence (PR = 0.62; 95%CI 0.45;0.86) of receiving nutritional counseling when compared to those with a higher level of education (≥ 12 years) (Table 3).
Table 3 Prevalence and prevalence ratio (PR) of medical consultations, dental consultations and receiving nutritional counceling according to the sociodemographic characteristics of the population, Criciúma, state of Santa Catarina, Brazil, 2019
| Variables | Performance of medical consultation (n = 717) | Performance of dental consultation (n = 531) | Receiving nutritional counseling (n = 243) | ||||||||||||
|---|---|---|---|---|---|---|---|---|---|---|---|---|---|---|---|
| n | % (95%CIa) | p-valueb | PR (95%CIa) | p-valuec | n | % (95%CId) | p-valueb | PR (95%CIa) | p-valuec | n | % (95%CId) | p-valueb | PR (95%CIa) | p-valuec | |
| Sex | 0.075 | 0.077 | 0.288 | 0.670 | 0.097 | 0.054 | |||||||||
| Male | 250 | 85.62 (81.09;89.21) | 1.00 | 201 | 71.02 (65.44;76.03) | 1.00 | 78 | 26.26 (21.55;31.59) | 1.00 | ||||||
| Female | 467 | 89.81 (86.89;92.12) | 1.05 (0.99;1.11) | 330 | 67.35 (63.05;71.37) | 0.98 (0.89;1.08) | 165 | 31.79 (27.92;35.94) | 1.25 (0.99;1.57) | ||||||
| Age (in years) | 0.002 | 0.001 | < 0.001 | 0.012 | 0.774 | 0.452 | |||||||||
| 18-29 | 81 | 82.65 (73.73;89.00) | 0.88 (0.79;0.97) | 79 | 83.16 (74.13;89.48) | 1.14 (1.00;1.30) | 32 | 31.68 (23.27;41.48) | 0.87 (0.62;1.21) | ||||||
| 30-39 | 73 | 78.49 (68.86;85.77) | 0.84 (0.75;0.94) | 77 | 84.62 (75.53;90.74) | 1.19 (1.05;1.35) | 32 | 34.41 (25.38;44.73) | 0.97 (0.69;1.36) | ||||||
| 40-49 | 75 | 89.29 (80.51;94.38) | 0.96 (0.88;1.04) | 56 | 68.29 (57.32;77.55) | 1.04 (0.88;1.23) | 23 | 27.38 (18.82;38.02) | 0.84 (0.57;1.22) | ||||||
| 50-59 | 151 | 88.30 (82.52;92.35) | 0.95 (0.90;1.02) | 109 | 66.46 (58.84;73.31) | 1.04 (0.91;1.19) | 47 | 27.49 (21.28;34.71) | 0.87 (0.65;1.16) | ||||||
| ≥ 60 | 337 | 92.08 (88.81;94.45) | 1.00 | 210 | 61.58 (56.29;66.62) | 1.00 | 109 | 29.70 (25.23;34.59) | 1.00 | ||||||
| Race/skin color | 0.960 | 0.918 | 0.819 | 0.772 | 0.262 | 0.208 | |||||||||
| White | 582 | 88.72 (86.05;90.92) | 1.00 | 428 | 68.70 (64.94;72.22) | 1.00 | 194 | 29.53 (26.16;33.14) | 1.00 | ||||||
| Black | 41 | 89.13 (75.95;95.51) | 1.02 (0.92;1.13) | 30 | 65.22 (50.13;77.76) | 0.92 (0.74;1.13) | 12 | 24.49 (14.26;38.74) | 0.82 (0.49;1.38) | ||||||
| Mixed-race/Asian/Indigenous | 79 | 87.78 (79.12;93.16) | 1.00 (0.92;1.08) | 60 | 70.59 (59.92;79.39) | 1.04 (0.90;1.20) | 33 | 36.67 (27.27;47.21) | 1.28 (0.95;1.72) | ||||||
| Income (Brazilian Real - BRL) | 0.351 | 0.276 | 0.050 | 0.332 | 0.946 | 0.602 | |||||||||
| < 500.00 | 130 | 86.09 (79.55;90.79) | 1.03 (0.95;1.12) | 99 | 68.75 (60.66;75.84) | 0.95 (0.83;1.09) | 44 | 29.33 (22.55;37.17) | 0.92 (0.66;1.27) | ||||||
| Between 500.00 and 1,000.00 | 152 | 92.12 (86.86;95.39) | 1.06 (0.99;1.14) | 91 | 59.87 (51.83;67.41) | 0.92 (0.79;1.07) | 46 | 27.88 (21.53;35.26) | 0.94 (0.68;1.31) | ||||||
| Between 1,001.00 and 2,000.00 | 214 | 88.43 (83.72;91.91) | 1.03 (0.96;1.10) | 157 | 68.86 (62.52;74.56) | 0.98 (0.87;1.10) | 71 | 28.74 (23.42;34.73) | 0.96 (0.73;1.28) | ||||||
| ≥ 2,001.00 | 200 | 87.34 (82.34;91.07) | 1.00 | 166 | 73.45 (67.28;78.83) | 1.00 | 70 | 30.57 (24.92;36.87) | 1.00 | ||||||
| Schooling (years of study) | 0.624 | 0.144 | < 0.001 | < 0.001 | 0.008 | 0.001 | |||||||||
| 0-4 | 196 | 90.32 (85.58;93.62) | 0.95 (0.87;1.04) | 101 | 49.51 (42.66;56.37) | 0.64 (0.54;0.76) | 55 | 25.35 (19.97;31.59) | 0.62 (0.45;0.86) | ||||||
| 5-8 | 188 | 86.24 (80.97;90.23) | 0.94 (0.87;1.03) | 140 | 68.97 (62.23;74.98) | 0.86 (0.76;0.98) | 54 | 24.66 (19.37;30.83) | 0.61 (0.44;0.85) | ||||||
| 9-11 | 232 | 88.21 (83.70;91.60) | 0.99 (0.91;1.07) | 197 | 77.87 (72.30;82.58) | 0.95 (0.85;1.06) | 89 | 33.46 (28.02;39.37) | 0.84 (0.63;1.11) | ||||||
| ≥12 | 100 | 88.50 (81.09;93.24) | 1.00 | 92 | 82.14 (73.83;88.24) | 1.00 | 45 | 39.82 (31.14;49.20) | 1.00 | ||||||
a) 95%CI: 95% confidence interval; b) Pearson’s chi-square test; c) Wald test.
Table 4 Absolute inequalities in medical consultation, dental consultation, receiving nutritional counseling and use of Brazilian National Health System's (Sistema Único de Saúde − SUS) services according to age, income and schooling, Criciúma, state of Santa Catarina, Brazil, 2019
| Outcome | Coefficienta,b | p-value |
|---|---|---|
| Performance of medical consultation | ||
| Agec | 14.2 | 0.001 |
| Incomed | -1.2 | 0.779 |
| Schoolinge | -1.8 | 0.636 |
| Performance of dental consultation | ||
| Agec | -29.5 | < 0.001 |
| Incomed | 11.0 | 0.061 |
| Schoolinge | 41.1 | < 0.001 |
| Receiving nutritional counseling | ||
| Agec | -2.8 | 0.632 |
| Incomed | 2.3 | 0.687 |
| Schoolinge | 18.0 | 0.001 |
| Use of SUS service | ||
| Agec | 21.3 | 0.003 |
| Incomed | -51.6 | < 0.001 |
| Schoolinge | -61.2 | < 0.001 |
a) Analysis performed using the Slope index of inequality (SII); b) Unit of measurement: Percentage points; c) Age: 18-29 versus ≥ 60 years old; d) Income: < BRL 500.00 versus ≥ BRL 2,001.00; e) Schooling: 0 to 4 versus 12 years or more of study.
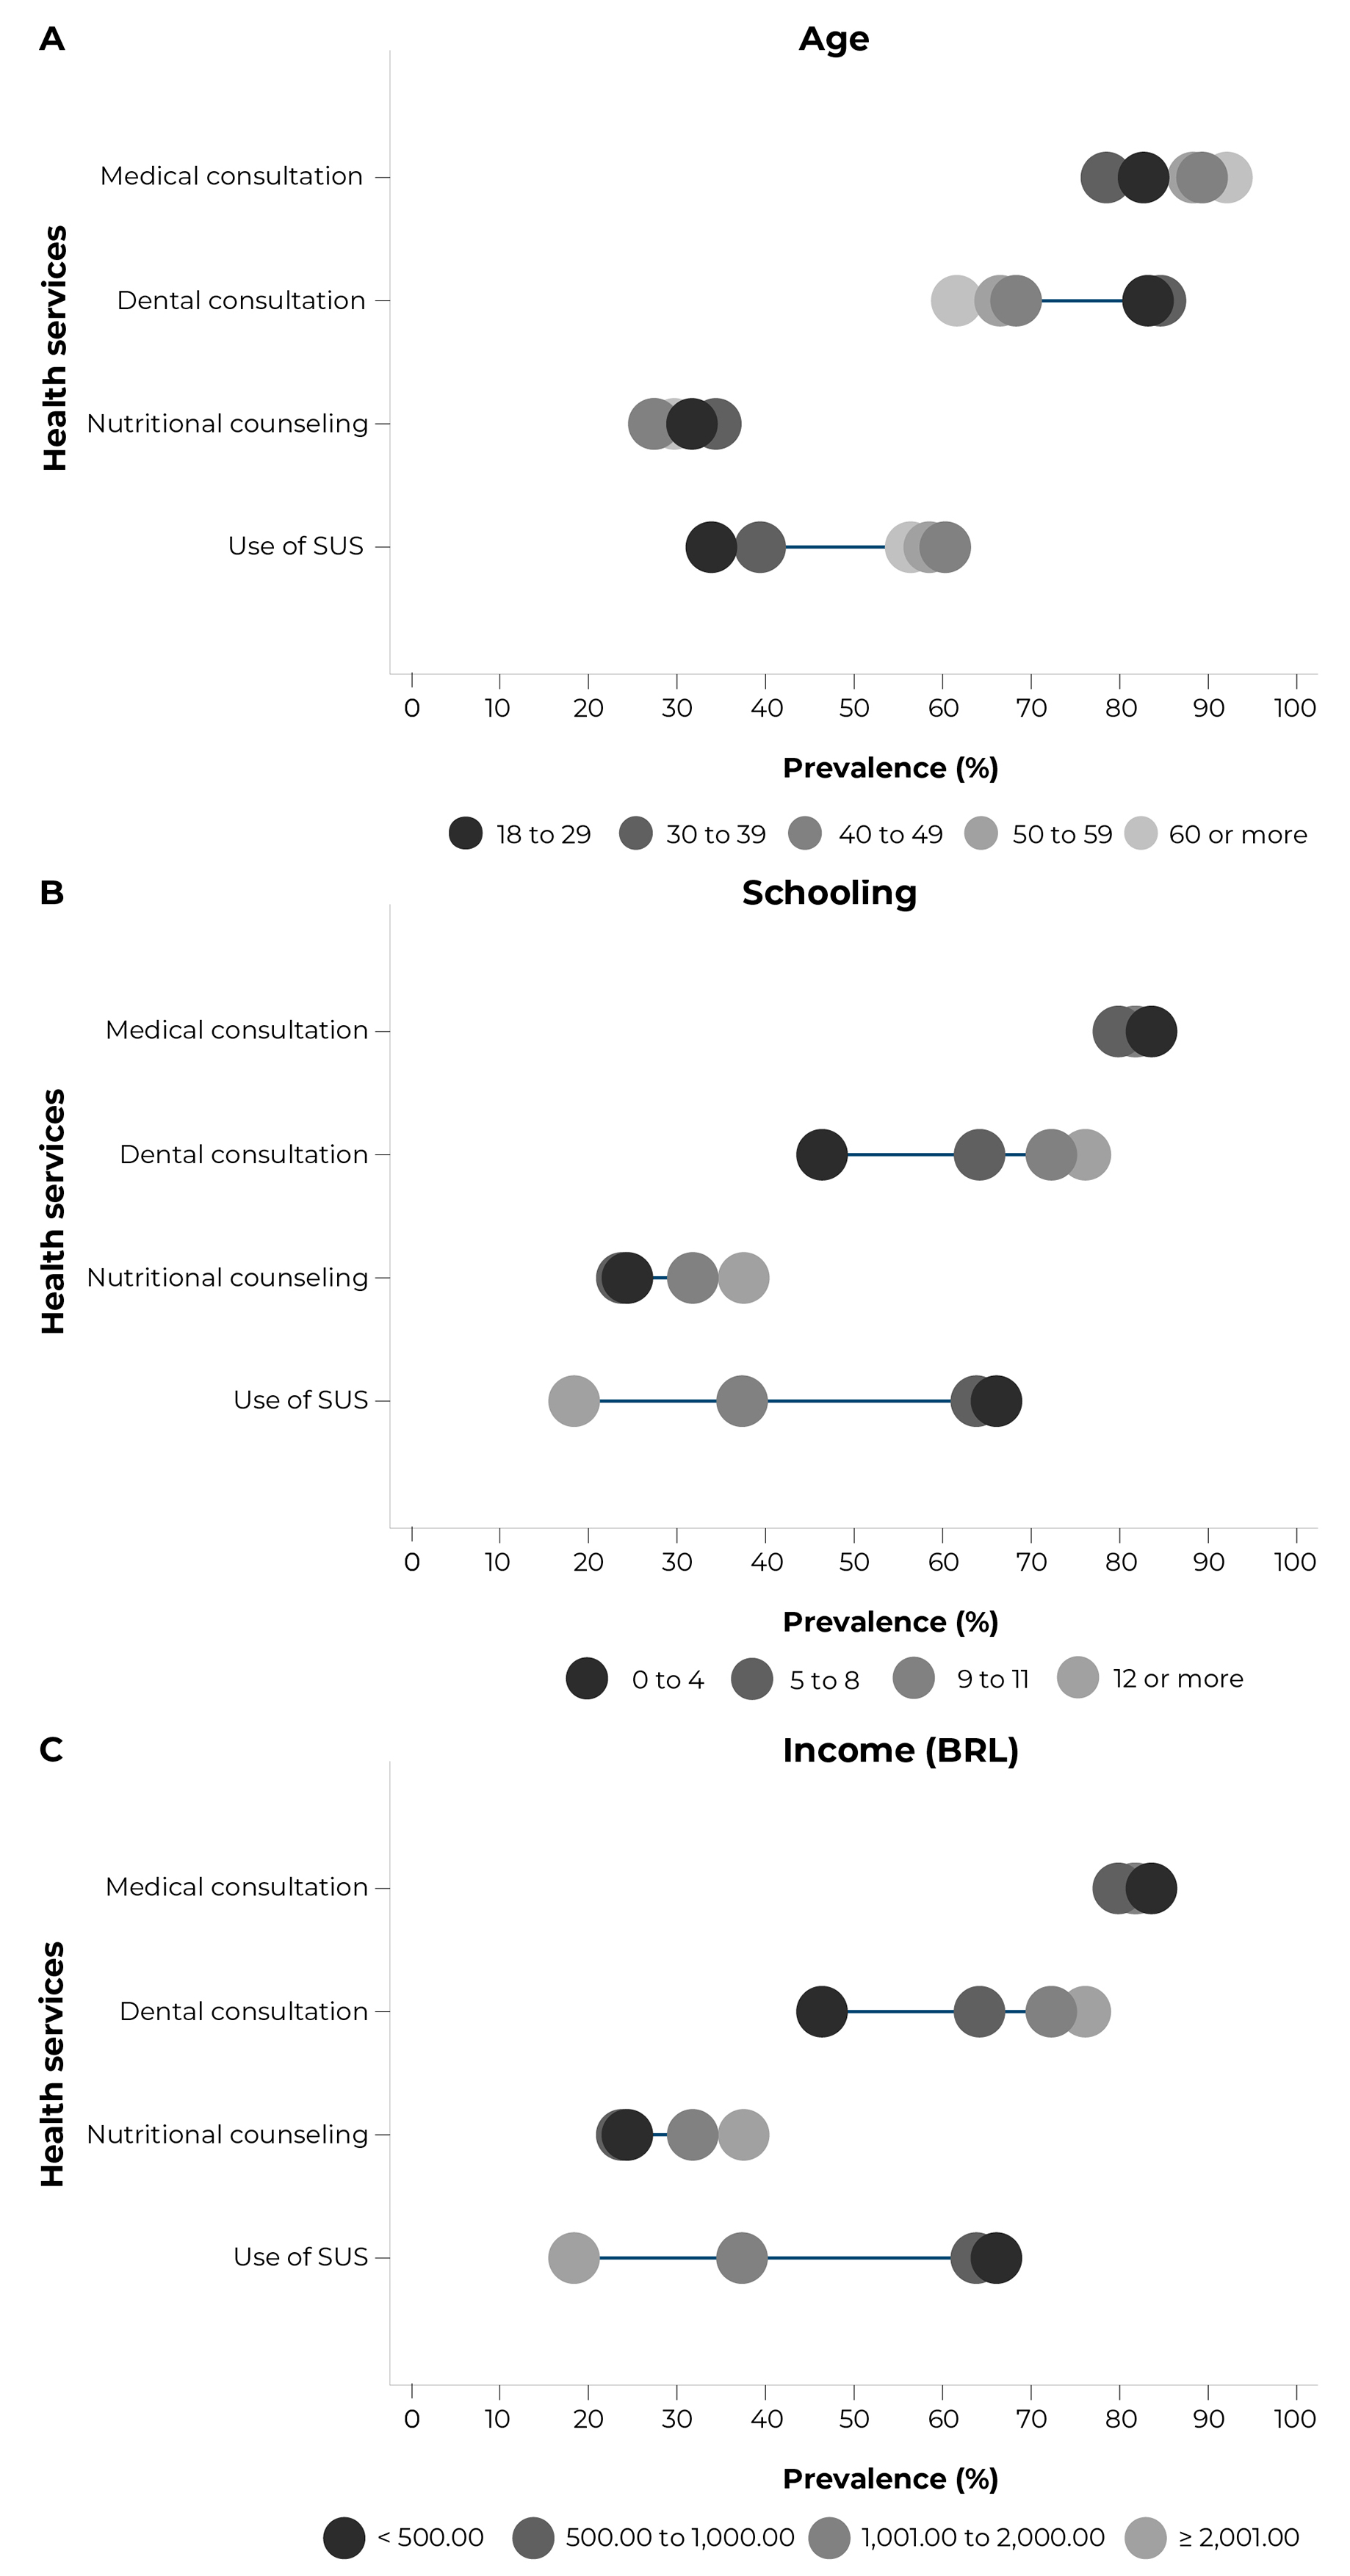
Figure 1 Percentage of medical consultation, dental consultation, receiving nutritional counseling and use of Brazilian National Health System's (Sistema Único de Saúde − SUS) according to age (A), education (B) and income (C), Criciúma, state of Santa Catarina, Brazil, 2019
The inequalities in the use of SUS, assessed by the SII according to age, income and schooling, can be seen in Table 4, and are graphically illustrated in Figure 1. The frequency of medical consultations was 14.2 percentage points (p.p.) higher in older adults, when compared to younger people (18-29 years old). Dental visits, on the other hand, were mostly concentrated among younger people with higher level of education. Individuals aged 18 to 29 years had a prevalence 29.5 p.p. higher than older adults; this same prevalence, among those with higher level of education was 41.1 p.p. higher when compared to those with lower level of education. Receiving nutritional counseling was more concentrated in individuals with higher level of education, i.e.: they presented a prevalence of 18.0 p.p. when compared to those with lower level of education. The frequency of use of SUS was higher among older adults with lower income and lower level of education. Older adults, specifically, presented a 21.3 p.p. higher prevalence of use of public sector when compared to younger individuals. Finally, those who earned up to BRL 500.00 per month and had up to 4 years of education presented, respectively, 51.6 and 61.2 p.p. higher prevalence of use of SUS, when compared to those with higher income and higher level of education.
Discussion
This study found important inequalities when taking into consideration the variables age, income and schooling in the profile of use of health services. Older adults had a higher frequency of medical consultations and lower frequency of dental visits, when compared to younger individuals, while individuals with higher level of education presented a higher frequency of receiving nutritional counseling and dental visits, when compared to those with fewer years of education. In turn, a higher frequency of use of SUS was found in older adults, individuals with lower level of education and lower income, when compared to their peers.
The National Health Policy (Política Nacional de Saúde − PNS), a Brazilian survey of national coverage, conducted with the population aged 14 years or older, in 2019, and a representative study of Brazilian older adults, conducted with data from the Global Burden of Disease Study 2017, also conducted in the national territory, indicate that aging is accompanied by an increase in the prevalence of chronic non-communicable diseases, in mortality and in the rise in disability due to such diseases, with 60- year-or-older age group being the most affected. This fact probably occurs due to increased life expectancy and increased access to health.14,15 which could facilitate the development and identification of these diseases. The existence of such diseases, as well as a greater number of comorbidities, is related to a greater use of health services, including medical consultation, which is most likely due to the need for treatment and monitoring of their health conditions. Accordingly, another study, on data from the 2013 PNS, shows that having any chronic health condition, functional limitation and a worse health perception15 is associated with a greater demand for medical care.
It could be seen that older adults had a lower frequency of dental visits, while those with higher level of education presented a higher frequency of this service. In Brazil, a research evaluating the trend of inequality in the use of dental services, estimated by the SII index based on the periods 1998 and 2013, on data from the National Household Sample Survey (Pesquisa Nacional por Amostra de Domicílios) conducted by IBGE, from 1998 to 2008, and 2013 PNS (both conducted in the national territory, the first one with data from all residents in selected households and the second one only with individuals aged 18 years or older), observed that, for all age groups analyzed, there was a reduction in the lack of access to dental visits between 1998 and 2008, due to the implementation of the National Oral Health Policy (Política Nacional de Saúde Bucal − PNSB). The PNSB has expanded access to public oral health care throughout the country.16 As for education, a cross-sectional study with individuals aged 30 years and older, conducted in the United States, on data from the National Health and Nutrition Examination Survey, 2015-2016, also using the SII, showed that, as the level of education increased, the frequency of not having a dental visit in the last year decreased.17 However, the findings of the North American study should not serve as a reference for the Brazilian reality, given the socioeconomic and health system differences between the two countries.
One of the reasons reported for not seeking dental services is tooth loss,18 which may be related to the lower frequency of dental care among older adults. This finding is worrisome, taking into consideration the decline in oral health with aging, which may affect food intake, nutritional status and, consequently, the health of older adults, although the quality of such evidence is considered weak.19 In addition, greater knowledge about oral health, an outcome also related to higher level of education,20 seems to be associated with greater demand for dental services, including preventive dental care, and perform a lower number of invasive dental treatments, such as tooth extractions and endodontics21 - which may explain the finding of the present study, that is, individuals with higher level of education presented higher frequency of dental visits.
Another important result of this research is related to the frequency of receiving nutritional counseling, which was higher among those with higher level of education. A population-based cross-sectional study with adults, also conducted in a municipality in the South region, in 2016, found a higher prevalence of nutritional counseling in males with higher level of education; however, this association was not found in females.22 Nutrition literacy may play an important role in elucidating this result, a hypothesis discussed below.
Nutrition literacy is an individual’s capacity to understand nutrition information, and if this ability does not exist, its absence can hinder the access, choices and construction of a nutrition knowledge.23 This may be related to inequality in receiving nutritional counseling according to schooling, given that lower level of education seems to be associated with lower nutrition literacy.24 However, most nutrition education programs and actions, despite being aimed at people with lower socioeconomic status, do not in fact take into consideration issues of socioeconomic access, which influences the achievement of a nutritionally adequate diet by these individuals.25
A systematic review on interventions promoting healthy eating in developing countries, such as Brazil, demonstrated the importance of food and nutrition education to reduce social inequality in diet.25 Therefore, it is evident the importance of receiving nutritional counseling for the population health and, consequently, the adoption of healthy eating, reducing the risk for NCDs.25
Inequality in receiving nutritional counseling is also a worrisome result, given the current scenario of double burden of malnutrition - coexistence of malnutrition and overweight in the same population - described in low- and middle-income countries, such as Brazil.26 The double burden of malnutrition has important associations with socioeconomic inequalities in the Brazilian population26 and nutrition education is one of the intersectoral actions necessary to address it. Nutrition education, through actions, programs and interventions aimed at promoting healthy eating, can favor the change of this nutritional scenario.27
Older adults with lower level of education and lower-income presented a higher frequency of use of the services provided by SUS. A population-based cross-sectional study, conducted in São Paulo, in 2003 and 2008, with individuals of all ages, also found an association between schooling, income and use of SUS, i.e.: lower prevalence of use of health services provided by SUS in 2003 and 2008 among individuals with 12 or more years of education and income of 5 or more minimum wages, when compared to those with lower level of education and lower income, respectively.28
SUS offers several health services, such as multidisciplinary care (including home care), distribution of medicines, immunization, surgical procedures and health surveillance; in addition to having policies aimed at specific aspects and vulnerable populations, such as older adults and people with lower socioeconomic status, and allowing easier access to health services, given its free and universal character.4,29
The inequalities observed in the utilization of SUS reflect how its services constitute a reference of belonging to the most vulnerable population, which, however, does not mean inequity. While the term "inequality" points to the difference found between population groups in the evaluation of an outcome, the expression "inequity" is used to refer to inequalities considered unfair and avoidable.11
Knowing individual health determinants is not enough. It is also necessary to identify the social determinants responsible for conditioning individual behaviors and, consequently, health, given their mediation in the access to food, information, work, health, education and income. Socioeconomic disadvantage exposes individuals to the worst health outcomes and vulnerabilities in health care.5
Identifying determinants that influence health inequality is necessary in order to plan interventions with greater impact. Public policies, despite being developed in different sectors, need intersectoral action to ensure adequate social conditions for all individuals, reaching mainly the most vulnerable groups.5
It is worth highlighting some limitations of this study. The cross-sectional design does not allow establishing causality in the results found. The sample studied had a higher proportion of women and older adults, populations that may present a higher demand for health services; and found socioeconomic differences when compared to data from the 2010 Population Census.30 This is possibly due to business hours when the interviews were conducted. Furthermore, the outcomes were reported by the participants and may be subject to information bias. The scarcity of studies using SII to assess health inequalities, in turn, hinders the comparison of the results found with findings on other regions of the country. Taking into consideration that the results are related to a sample of a single municipality, more studies are needed to assess inequalities in the use of health services, using specific indicators for this purpose.
As strengths of this study, we highlight the fact that this population-based study represents the adult and older adult population of the municipality of Criciúma. It is worth mentioning the use of SII, an important and complex measure of inequality, widely used in epidemiological and economic studies,10,11 although little explored in research conducted in the public health field.
It can be concluded that important socioeconomic inequalities in the use of medical and dental services, in receiving nutritional counseling and in the use of SUS were found, affecting mainly older adults with low-income and lower level of education. These results reinforce the importance of assessing health inequalities and the need for public health policies and actions that take into account the most vulnerable socioeconomic groups, in order for them to be developed and implemented.
To expand population access to health care, joint actions between managers and professionals are necessary in order to emphasize and disseminate the importance and availability of multidisciplinary care in a more effective health care. Health care based on the interdisciplinarity and horizontality of SUS, aspects that are reinforced from continuing and permanent education for professionals, and from a management that analyzes and develops actions according to the needs of its territory, can contribute to the expansion of access and use of its medical, dental and nutritional services, promoting the health of the general population.

