


 texto em
  Inglês (pdf)
 Artigo em XML
 Referências do artigo
 Enviar este artigo por email
 Citado por SciELO
  Similares em
SciELO
Similares em
SciELO 
 Permalink
Study contributions
Main results
Cases with delay in starting treatment accounted for 54.5% (2019) and 48.7% (2020), with 49% to 95% greater chance in women aged over 40. Delays were 21% lower in 2020 than in 2019, and 21% higher for those residing more than 200 km from the place of treatment.
Introduction
Breast cancer accounted for 11.7% of all forms of cancer diagnosed among men and women worldwide in 2020, surpassing lung cancer which accounted for 11.4% of all cancer diagnoses in both sexes.1 Breast cancer mortality has been falling in many high-income countries, despite stable or growing incidence. Scientific progress, especially with treatment, achieved in recent decades has led to an increase in net survival in many countries;2 in middle- and low-income countries, both incidence and mortality are increasing, which indicates the need to prioritize early detection actions and access to treatment.3
In Brazil, availability and use of screening, diagnosis and care services for people with cancer is unequal between the country’s regions, compromising timely starting of treatment.4 Data from the hospital-based cancer registries (Registros Hospitalares de Câncer - RHC), which include the establishments responsible for high complexity care in the Brazilian National Health System (Sistema Único de Saúde - SUS) and some private services specialized in cancer, show that risk of diagnosis in advanced stages is higher for Black and mixed-race women compared to White women, as well as for those with lower levels of education compared to those with higher levels of education.5
Studies that analyzed the time elapsed between the performance of mammograms with abnormal results and the beginning of treatment,6 or between diagnosis and treatment,7 found prolonged intervals. Risk of death was found to increase by about 38% when first treatment occurred 60 days after diagnosis.8 Among the reasons possibly related to the difficulty in starting treatment in the SUS network in a timely manner following diagnosis, is the distance from the treatment referral service, resulting in many service users having to travel around 300 km from their residence.9
Evaluations performed based on the studies cited6,7 indicate that cancer control strategies have had little impact on reversing the mortality trend. The finding that breast cancer screening has been falling since 2014 in all regions of the country,10 points to a future scenario of possible worsening. It is therefore urgent to review cancer control policies, taking into account the data available on SUS health information systems and the impact of the actions taken so far, always based on the best scientific evidence. Thus, it is certainly possible to reorganize the planning of early detection actions and the monitoring of the flow in the SUS network.
In this sense, the Oncology Panel (PAINEL-Oncologia) stands out as a tool made available by the Ministry of Health in 2019 that gathers information from SUS health information systems on diagnosis and first treatment of malignant neoplasms, enabling health service managers to monitor treatment delay with effect from cancer diagnosis.11
The objective of this study was to analyze delay in treatment delay and the flow of care for women with breast cancer in Brazil in 2019 and 2020.
Methods
We conducted a follow-up study of breast cancer cases, as described in category C50 of the International Statistical Classification of Diseases and Related Health Problems - Tenth Revision (ICD-10), in females throughout Brazil, diagnosed in 2019 and 2020, with treatment information, using the individualized data available on the Oncology Panel. The data were accessed on the SUS Department of Information Technology (Departamento de Informática do SUS - DATASUS) website on December 9, 2021.
The Oncology Panel is a tool for monitoring the time between diagnosis and first treatment based on data from the consolidated SUS health information systems.11
We only took into consideration treatment performed in SUS licensed cancer care facilities. Cases treated surgically in non-licensed hospitals were excluded from the study.
Variables
Time between diagnosis and first treatment, dichotomized between “less than or equal to 60 days” and “greater than 60 days”, whereby the latter category is considered to be delay in treatment, as per Law No. 12.732/2012.12
Age group (in years: up to 39; 40-49; 50-59; 60-69; 70 or over);
Year of diagnosis (2019; 2020).
Municipality of residence.
Municipality where treatment was provided [municipality of residence; other municipality, up to 200 km away from municipality of residence; other municipality, more than 200 km away from municipality of residence (the 200 km cutoff point described the odds of the delay for those furthest way, in an initial exploratory analysis)].
Health macro-region of residence.
Health macro-region where treatment was provided.
Region of residence in Brazil (North; Northeast; Southeast; South; Midwest).
Average per capita income in the health macro-region of residence, as per the 2010 Demographic Census (categorized in terciles).
For each health macro-region, we checked the existence of SUS licensed cancer care facilities13 and obtained data on the average per capita income of the resident population in 2010.14
Initially, we analyzed the frequency distribution (relative and absolute) of case-related characteristics with delay in starting treatment. Pearson’s chi-square test was used to compare the distribution of the variables.
In order to identify predominant care flows, thematic maps were prepared showing the flows from health macro-regions of residence and health macro-regions of treatment and the absolute frequencies of service users treated in each macro-region. In order to facilitate visualization of the most important flows, only those that indicated at least 10% of users having to travel to other health macro-regions were selected. In order to visualize regional inequalities, thematic maps of the health macro-regions were prepared showing the distribution, in quintiles, of the following variables: “percentage delay of more than 60 days in starting treatment” and “average distances traveled for treatment”.
We used the R program, specifically the ggplot function from the ggplot2 package, to prepare the maps. We plotted (i) the polygons of the macro-regions as a first layer, (ii) the arrows linking the centroids of the macro-regions of residence with the centroids of the macro-regions of treatment, as a second layer, and (iii) a layer of points indicating the centroid of the macro-region of treatment, with the diameter of the points proportional to the frequency of women treated in that macro-region.
We applied multilevel logistic models with random intercept to evaluate factors associated with delay in starting treatment, considering the existence of a hierarchical structure per health macro-region,15 taking the person in treatment as level 1 and the health macro-region of residence as level 2. Initially, the model was only adjusted with the random intercept, without exposure variables, to estimate the overall variation in the odds of delay and the intraclass correlation coefficient, which quantifies the proportion of variance explained by the group (macro-region of residence). We then adjusted simple models with each exposure variable. Finally, the multiple model was built with the variables that showed significant association in the simple models, using the likelihood-ratio test to compare both models. The fixed effects of the variables were estimated as odds ratios (OR) by exponentiating the respective coefficients, with a 95% confidence interval (95%CI). The fit of the final multiple model was evaluated by analyzing the residuals for overdispersion, normality and outliers using the R program DHARMa (Diagnostics for HierArchical Regression Models) package set of functions (https://cran.r-project.org/package=DHARMa). The tests indicated the adequacy of the model in relation to the data.
All the analyses were performed using release 4.1.0 of the R program;16 we used the lme4 package to adjust the multilevel models via the glmer function, and the Geosphere package to estimate distance via the distHaversine function. A 0.05 significance level was used in all the analyses.
Ethical aspects
As the study used public domain data, with no identification of the participants, the study project did not need to be submitted for appraisal by a Research Ethics Committee.
Results
A total of 78,527 breast cancer cases were identified on the Oncology Panel for the period 2019-2020, relating to women residing in the 118 Brazilian health macro-regions: 42,102 were diagnosed in 2019 and 36,425 in 2020. This means that in 2020 there was a 13.5% reduction in diagnoses compared to the previous year. Of the total number of cases included in this study, starting treatment was delayed for 51.8% (40,678): 22,956 (54.5%) in 2019 and 17,722 (48.7%) in 2020 (Table 1).
Table 1 Absolute and relative frequencies of the variables, stratified by time between diagnosis and treatment, Brazil, 2019-2020
| Variables | Total (n = 78,527) | Time (in days) | p-valuea | |
|---|---|---|---|---|
| ≤ 60 (n = 37,849) | > 60 (n = 40,678) | |||
| n (%) | n (%) | n (%) | ||
| Age (in years) | < 0.001 | |||
| ≤ 39 | 8,850 (100.0) | 5,358 (60.5) | 3,492 (39.5) | |
| 40-49 | 17,800 (100.0) | 8,983 (50.5) | 8,817 (49.5) | |
| 50-59 | 21,189 (100.0) | 10,011 (47.2) | 11,178 (52.8) | |
| 60-69 | 17,791 (100.0) | 7,841 (44.1) | 9,950 (55.9) | |
| ≥ 70 | 12,897 (100.0) | 5,656 (43.9) | 7,241 (56.1) | |
| Year of diagnosis | < 0.001 | |||
| 2019 | 42,102 (100.0) | 19,146 (45.5) | 22,956 (54.5) | |
| 2020 | 36,425 (100.0) | 18,703 (51.3) | 17,722 (48.7) | |
| Municipality where treatment was provided | < 0.001 | |||
| Same municipality (of residence) | 36,351 (100.0) | 17,757 (48.8) | 18,594 (51.2) | |
| Another municipality, up to 200 km away | 37,158 (100.0) | 17,836 (48.0) | 19,322 (52.0) | |
| Another municipality, more than 200 km away | 5,018 (100.0) | 2,256 (45.0) | 2,762 (55.0) | |
| Treatment in other health macro-region | < 0.001 | |||
| No | 67,827 (100.0) | 32,885 (48.5) | 34,942 (51.5) | |
| Yes | 10,700 (100.0) | 4,964 (46.4) | 5,736 (53.6) | |
| Licensed service in macro-region of residence | < 0.001 | |||
| Yes | 74,824 (100.0) | 36,198 (48.4) | 38,626 (51.6) | |
| No | 3,703 (100.0) | 1,651 (44.6) | 2,052 (55.4) | |
| Average per capita income in macro-region of residence | < 0.001 | |||
| 1st tercile | 26,636 (100.0) | 13,194 (49.5) | 13,442 (50.5) | |
| 2nd tercile | 23,515 (100.0) | 11,347 (48.3) | 12,168 (51.7) | |
| 3rd tercile | 28,376 (100.0) | 13,308 (46.9) | 15,068 (53.1) | |
| Region of residence in Brazil | < 0.001 | |||
| North | 3,162 (100.0) | 1,485 (47.0) | 1,677 (53.0) | |
| Northeast | 18,489 (100.0) | 9,233 (49.9) | 9,256 (50.1) | |
| Southeast | 35,689 (100.0) | 16,217 (45.4) | 19,472 (54.6) | |
| South | 16,147 (100.0) | 8,577 (53.1) | 7,570 (46.9) | |
| Midwest | 5,040 (100.0) | 2,337 (46.4) | 2,703 (53.6) | |
a) P-value: Pearson’s chi-square test.
Treatment delay was greater as the age group became older and as the distance traveled between the places of residence and places of treatment increased, with regard to treatment outside the macro-region of residence and in the case of residents in health macro-regions with no SUS licensed cancer care facilities. A greater delay was also found among women living in health macro-regions with higher per capita income. A higher proportion of service users with treatment delay was found in the Southeast region, and a lower proportion in the Southern region (Table 1).
When comparing the proportion of cases with delayed treatment, according to Federative Unit of residence, in 2020, there was an increase in the states of Amazonas, Pará, Piauí and Goiás. The lowest proportion of treatment delay in 2020 was in the state of Roraima (Table 2).
Table 2 Percentage of breast cancer cases treated with time interval greater than 60 days, by year of diagnosis and Federative Unit of residence, Brazil, 2019-2020
| Region | Federative Unit of residence | 2019 | 2020 | ||
|---|---|---|---|---|---|
| Cases | Delay | Cases | Delay | ||
| n (%) | n (%) | n (%) | n (%) | ||
| North | Acre | 64 (100.0) | 36 (56.3) | 64 (100.0) | 31 (48.4) |
| Amapá | 53 (100.0) | 30 (56.6) | 51 (100.0) | 28 (54.9) | |
| Amazonas | 397 (100.0) | 233 (58.7) | 385 (100.0) | 228 (59.2) | |
| Pará | 702 (100.0) | 359 (51.1) | 584 (100.0) | 340 (58.2) | |
| Rondônia | 156 (100.0) | 80 (51.3) | 253 (100.0) | 110 (43.5) | |
| Roraima | 46 (100.0) | 31 (67.4) | 52 (100.0) | 9 (17.3) | |
| Tocantins | 192 (100.0) | 95 (49.5) | 163 (100.0) | 67 (41.1) | |
| Northeast | Alagoas | 487 (100.0) | 255 (52.4) | 442 (100.0) | 230 (52.0) |
| Bahia | 2,324 (100.0) | 1,277 (54.9) | 2,035 (100.0) | 1,070 (52.6) | |
| Ceará | 1,868 (100.0) | 968 (51.8) | 1,725 (100.0) | 798 (46.3) | |
| Maranhão | 637 (100.0) | 369 (57.9) | 652 (100.0) | 322 (49.4) | |
| Paraíba | 861 (100.0) | 495 (57.5) | 772 (100.0) | 442 (57.3) | |
| Pernambuco | 1,860 (100.0) | 888 (47.7) | 1,521 (100.0) | 670 (44.0) | |
| Piauí | 577 (100.0) | 227 (39.3) | 433 (100.0) | 173 (40.0) | |
| Rio Grande do Norte | 845 (100.0) | 432 (51.1) | 705 (100.0) | 312 (44.3) | |
| Sergipe | 404 (100.0) | 192 (47.5) | 341 (100.0) | 136 (39.9) | |
| Southeast | Espírito Santo | 955 (100.0) | 464 (48.6) | 819 (100.0) | 337 (41.1) |
| Minas Gerais | 5,021 (100.0) | 2,864 (57.0) | 4,199 (100.0) | 2,128 (50.7) | |
| Rio de Janeiro | 3,900 (100.0) | 2,433 (62.4) | 3,213 (100.0) | 1,805 (56.2) | |
| São Paulo | 9,459 (100.0) | 5,485 (58.0) | 8,123 (100.0) | 3,956 (48.7) | |
| South | Paraná | 2,927 (100.0) | 1,185 (40.5) | 2,602 (100.0) | 899 (34.6) |
| Rio Grande do Sul | 3,560 (100.0) | 1,832 (51.5) | 3,079 (100.0) | 1,436 (46.6) | |
| Santa Catarina | 2,058 (100.0) | 1,235 (60.0) | 1,921 (100.0) | 983 (51.2) | |
| Midwest | Distrito Federal | 476 (100.0) | 288 (60.5) | 481 (100.0) | 285 (59.3) |
| Goiás | 1,194 (100.0) | 611 (51.2) | 974 (100.0) | 525 (53.9) | |
| Mato Grosso | 565 (100.0) | 286 (50.6) | 451 (100.0) | 199 (44.1) | |
| Mato Grosso do Sul | 514 (100.0) | 306 (59.5) | 385 (100.0) | 203 (52.7) | |
| Brazil | 42,102 (100.0) | 22,956 (54.5) | 36,425 (100.0) | 17,722 (48.7) | |
The maps in Figure 1 show the care flows between the macro-regions of residence and the macro-regions of treatment in 2019 and 2020, as well as the macro-regions that received the most service users for treatment. It can be seen that the Federative Unit capital cities are the main destinations of care flows, usually comprised of service users from other health macro-regions within the same Federative Unit but - occasionally - also from other Federative Units, as is the case of some health macro-regions of the state of São Paulo (Figure 1).
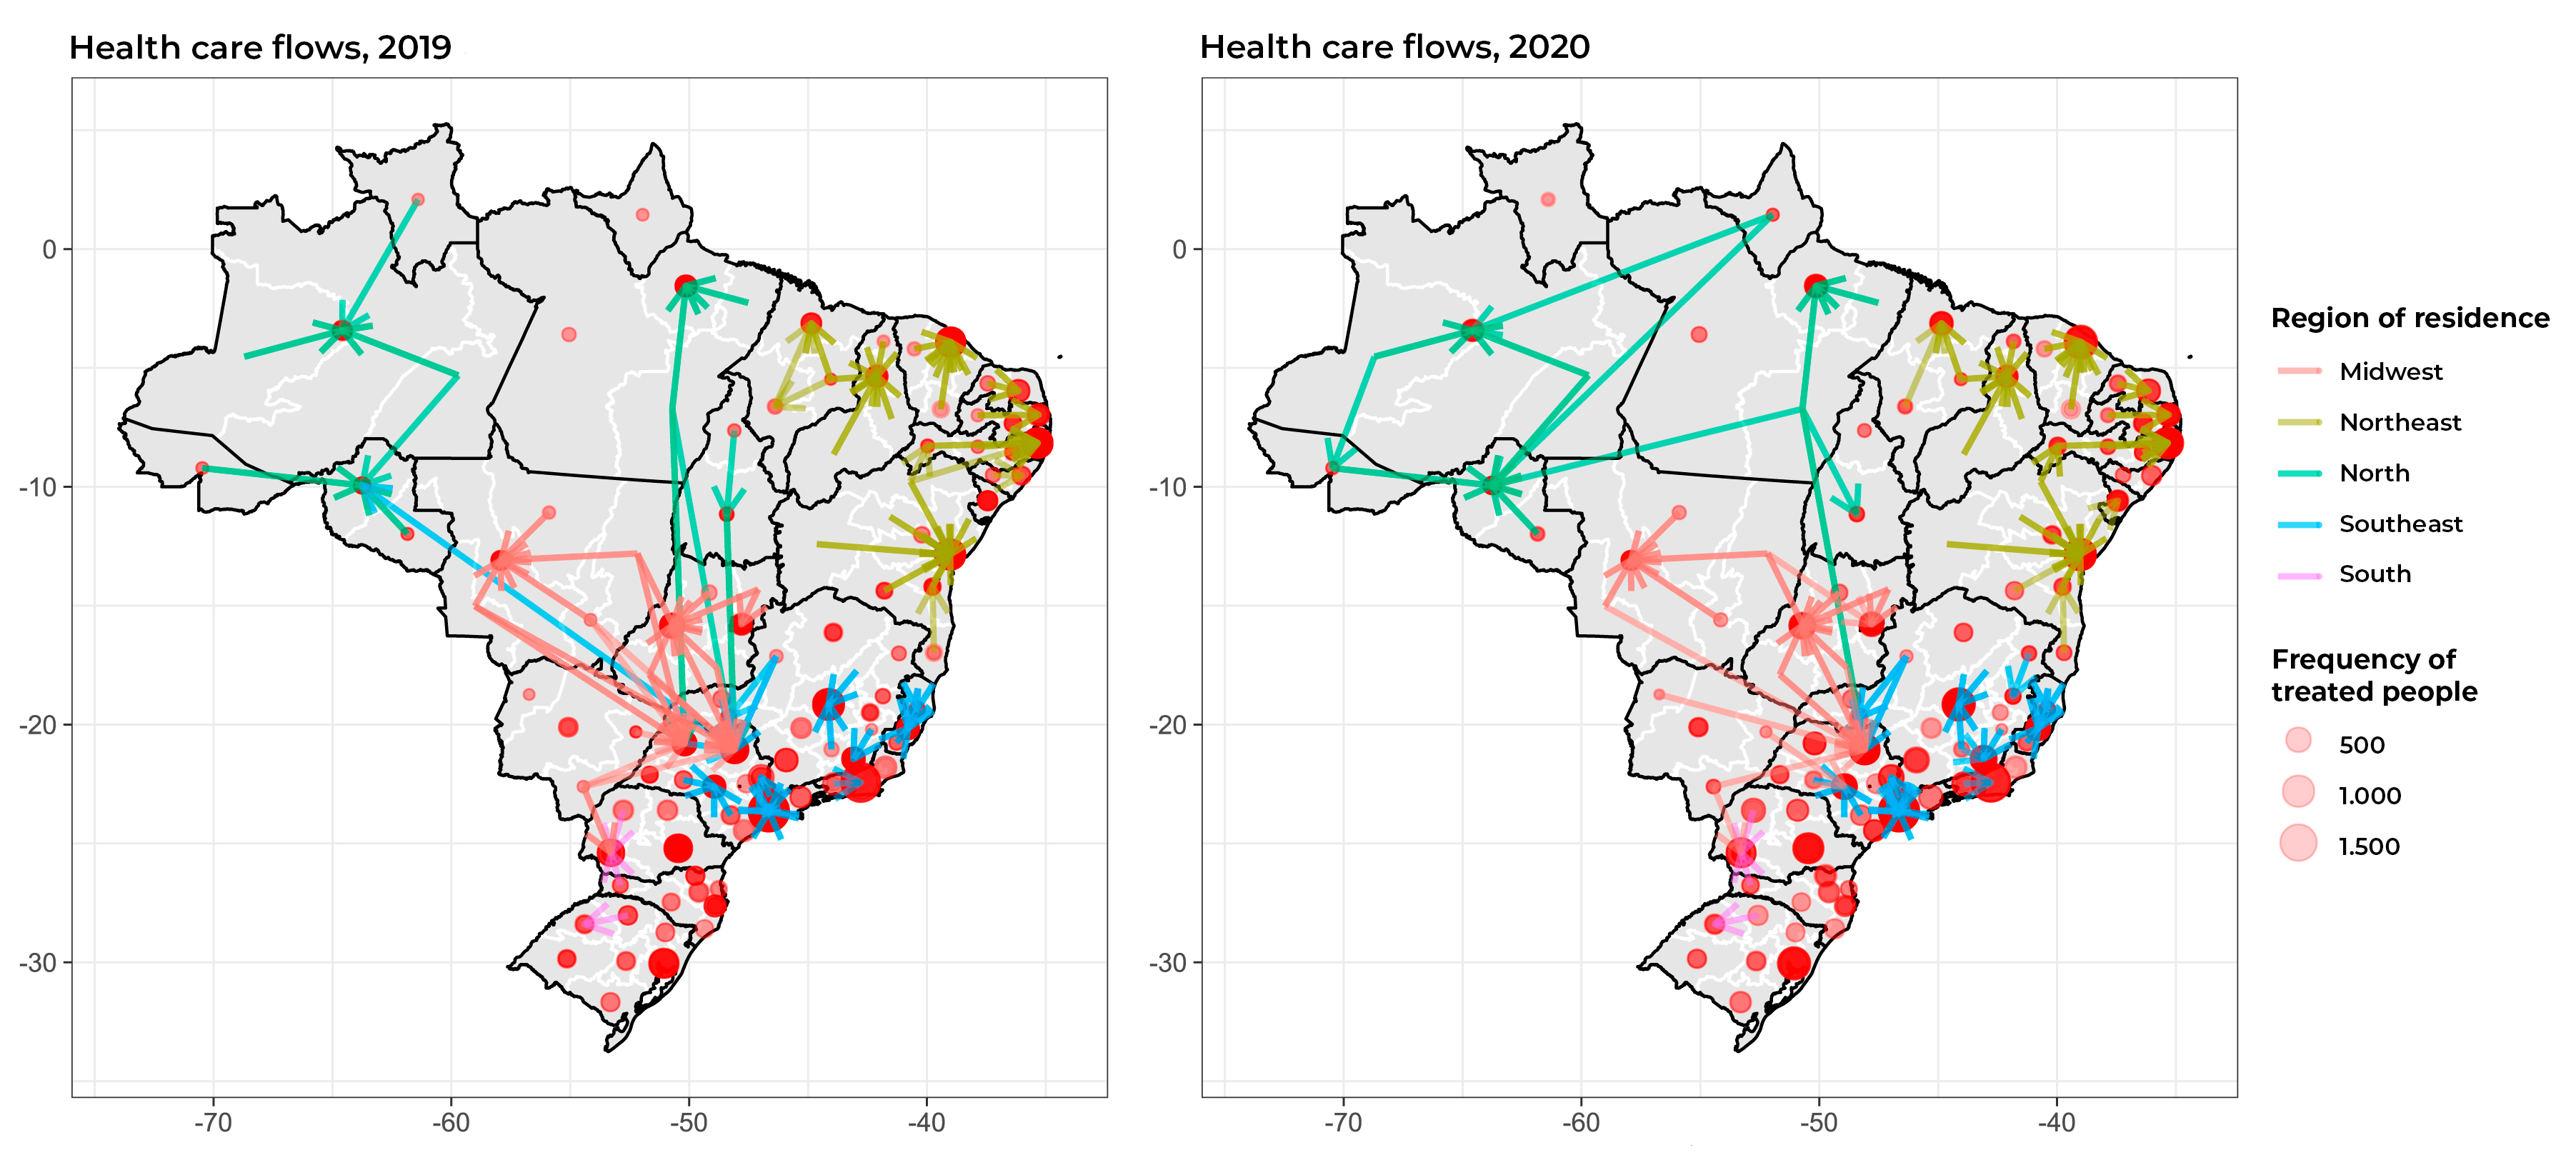
Figure 1 Maps of flows between health macro-regions of residence (origin) and macro-regions of treatment (destination) for female breast cancer, with representation of main destinations for treatment, Brazil, 2019-2020
Once we plotted the maps comprising Figure 2, we found great heterogeneity in the proportions of SUS service users with delayed treatment initiation between the health macro-regions of residence of practically all the Federative Units. When comparing the years 2019 and 2020, we found that some health macro-regions of the North and Northeast regions, as well as the state of Mato Grosso do Sul in 2020, had stronger colors, indicating greater delay in the treatment performed in those macro-regions.
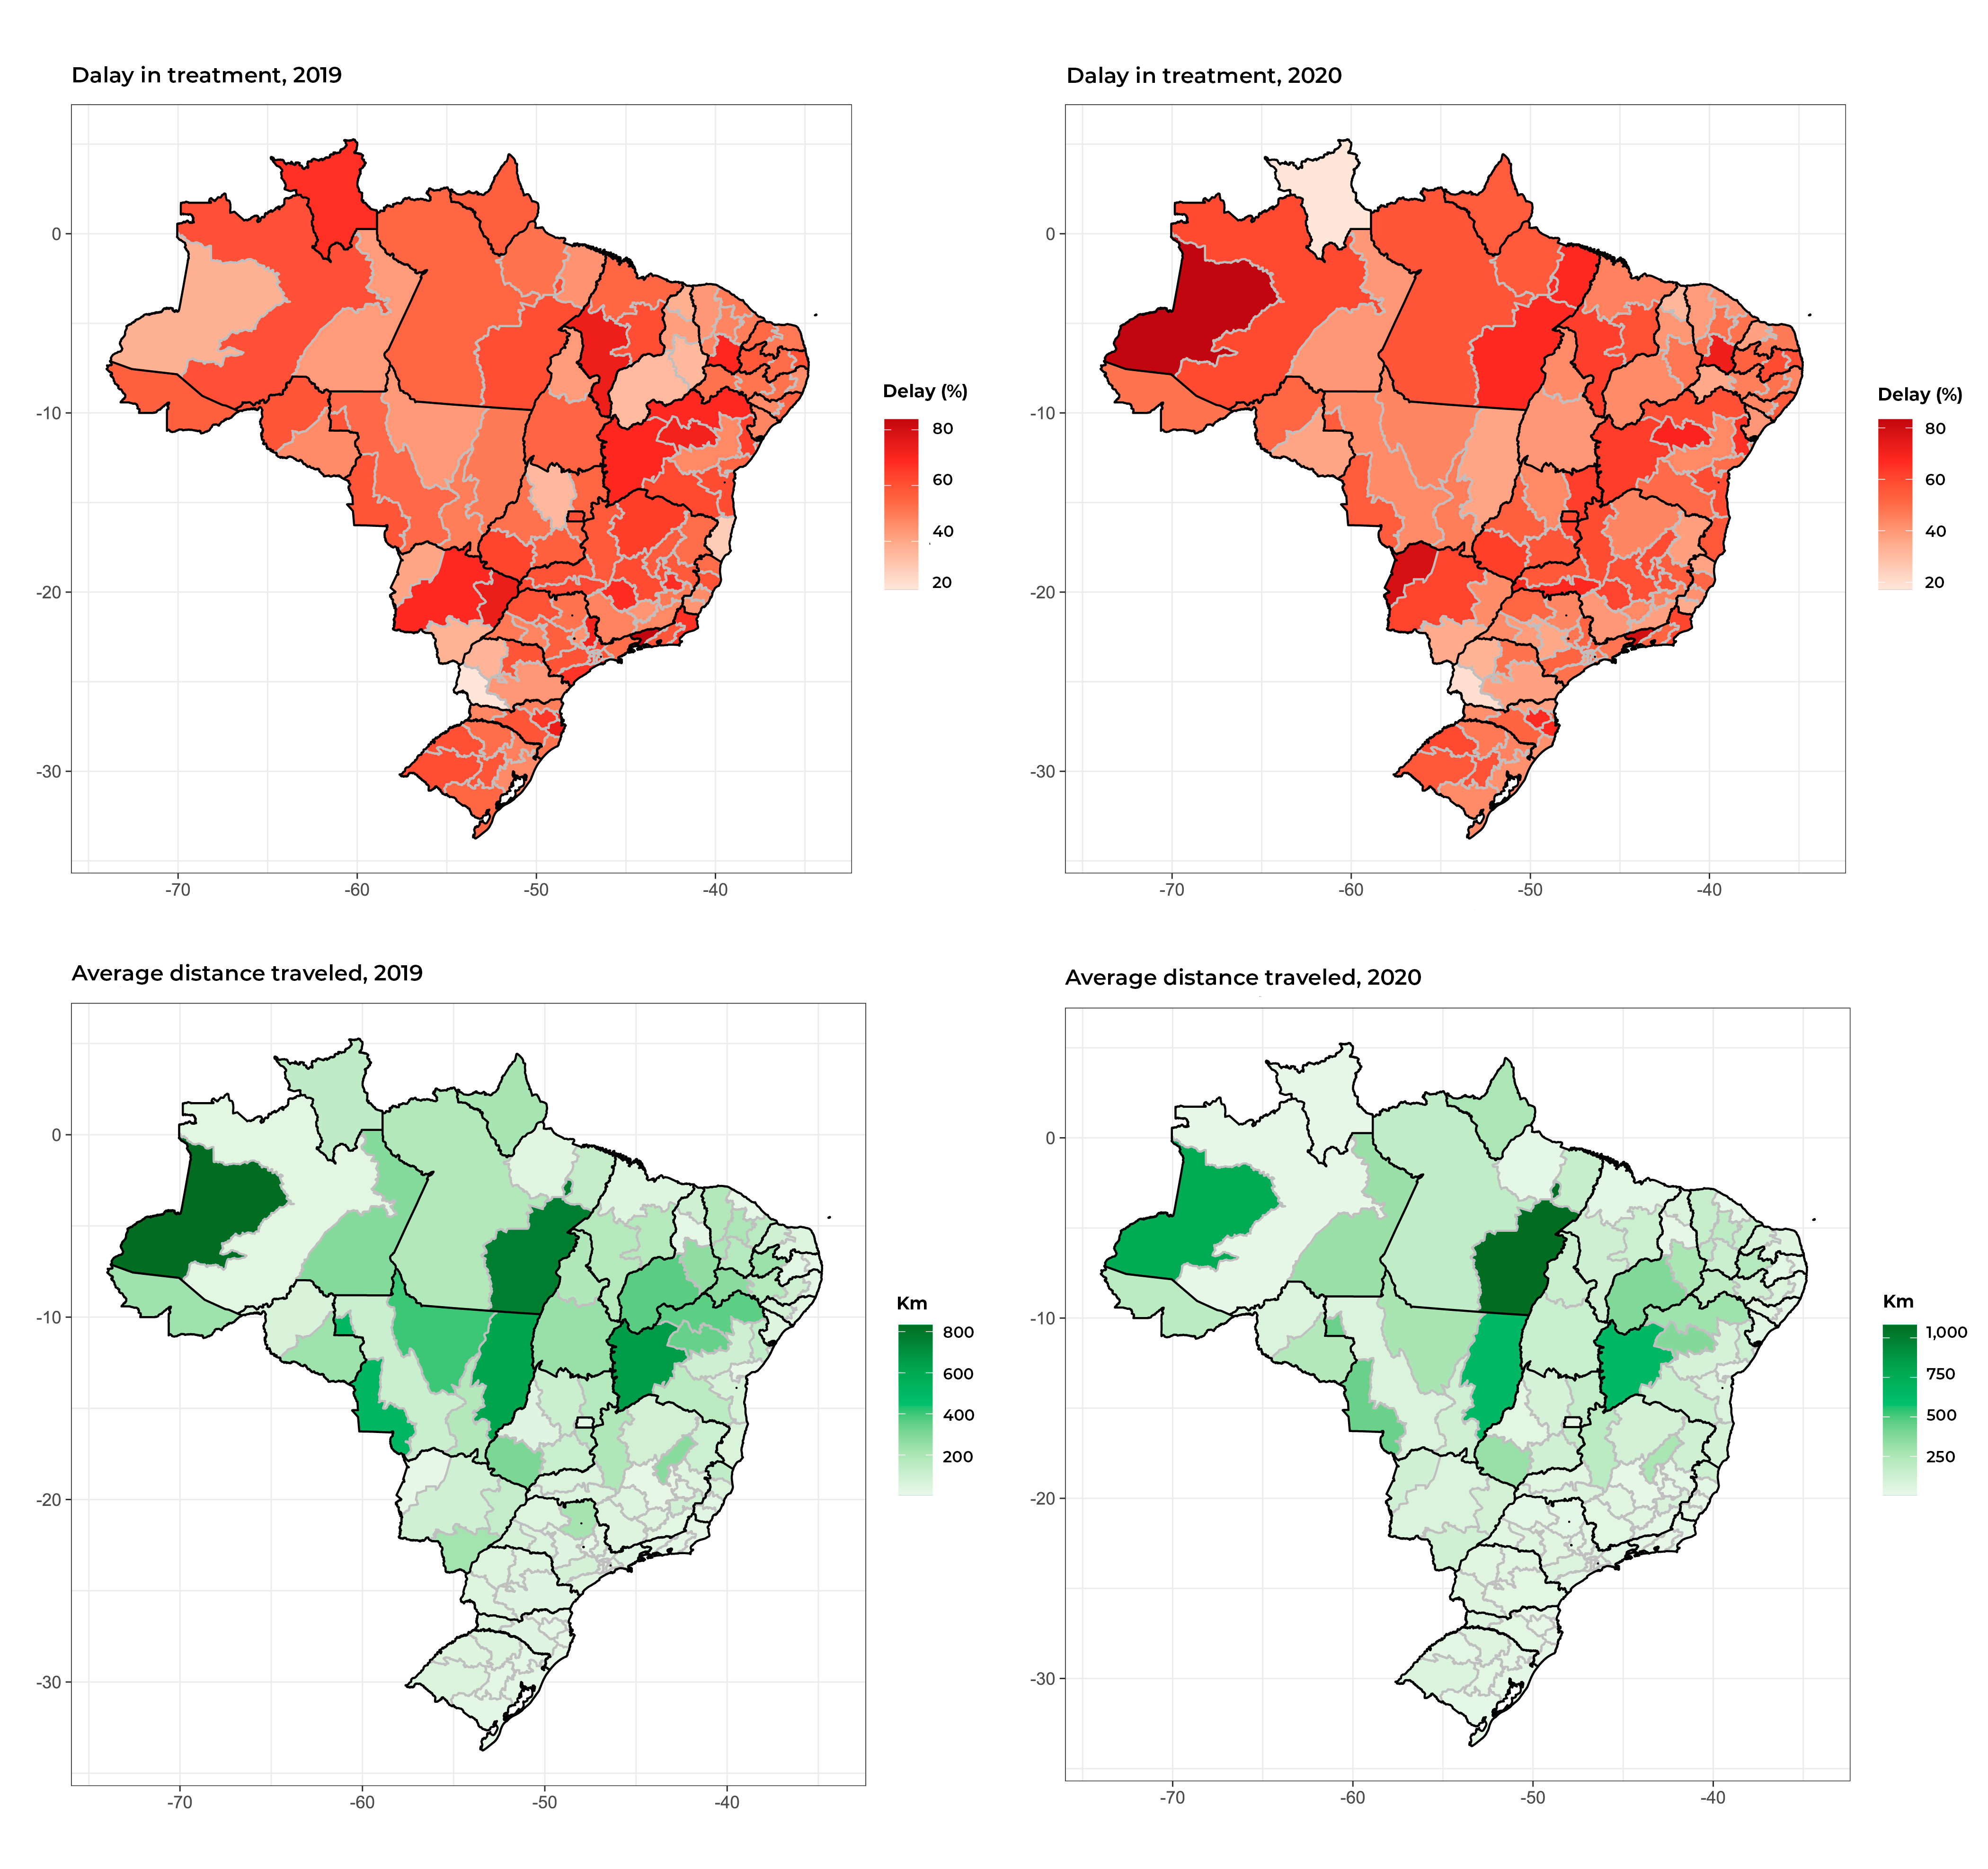
Figure 2 Maps showing distribution of the proportion of delay in starting treatment for female breast cancer and average distance between health macro-region of residence and health macro-region of treatment, by health macro-region, Brazil, 2019-2020
There was wide variation in the distances traveled for the treatment, with greater distances found in the North, Northeast and Midwest regions. Higher proportions of treatment delay were also noted in those regions (Figure 2).
The multilevel logistic regression allowed us to conclude that, for the simple models, the chance of delay increased with age and distance traveled for first treatment, and it was lower in 2020 (p-value < 0.001), compared to the previous year. Treating breast cancer outside the health macro-region of residence, residing in a health macro-region with a SUS licensed cancer treatment service, and large region of residence showed no association with the odds of delay (Table 3). The intraclass correlation coefficient was 0.04, indicating that 4% of the variance was explained by the macro-region level.
Table 3 Odds ratios of the simple and multiple multilevel logistic regression models,a for the outcome “delay in starting treatment for female breast cancer”, Brazil, 2019-2020
| Variables | Simple model | Multiple modeld | ||||
|---|---|---|---|---|---|---|
| ORb | 95%CIc | p-value | ORb | 95%CIc | p-value | |
| Age group (in years) | ||||||
| ≤ 9 years | 1.00 | < 0.001e | 1.00 | < 0.001e | ||
| 40-49 | 1.50 | 1.42;1.58 | 1.49 | 1.42;1.57 | ||
| 50-59 | 1.70 | 1.62;1.79 | 1.70 | 1.61;1.79 | ||
| 60-69 | 1.93 | 1.83;2.03 | 1.93 | 1.83;2.03 | ||
| ≥ 70 | 1.95 | 1.85;2.07 | 1.95 | 1.85;2.07 | ||
| Year of diagnosis | ||||||
| 2019 | 1.00 | 1.00 | ||||
| 2020 | 0.79 | 0.76;0.81 | < 0.001f | 0.79 | 0.77;0.81 | < 0.001f |
| Municipality where treatment was provided | ||||||
| Same municipality (of residence) | 1.00 | < 0.001e | 1.00 | < 0.001e | ||
| Another municipality, up to 200 km away | 1.07 | 1.03;1.10 | 1.09 | 1.05;1.12 | ||
| Another municipality, more than 200 km away | 1.20 | 1.11;1.29 | 1.21 | 1.13;1.31 | ||
| Treatment outside health macro-region of residence | ||||||
| No | 1.00 | |||||
| Yes | 1.03 | 0.97;1.09 | 0.299f | |||
| Licensed service in health macro-region of residence | ||||||
| Yes | 1.00 | |||||
| No | 1.11 | 0.91;1.35 | 0.325f | |||
| Region of residence in Brazil | ||||||
| South | 1.00 | |||||
| North | 1.05 | 0.80;1.39 | 0.729f | |||
| Northeast | 1.06 | 0.85;1.32 | 0.592f | |||
| Southeast | 1.18 | 0.96;1.46 | 0.119f | |||
| Midwest | 1.10 | 0.84;1.43 | 0.490f | |||
a) Multilevel model taking the person (health service user) as level 1 and health macro-region of residence as level 2; b) OR: Odds ratio; c) 95%CI: 95% confidence interval; d) Variables included in the multiple model: age, distance traveled for first treatment and year of diagnosis; e) P-value of linear trend; f) P-value of trend for ordinal variables.
In the multiple multilevel logistic regression model, including the variables that were significant in the simple models (age group; year of diagnosis; distance from residence to treatment facility) made it possible to find adjusted ORs similar to the crude ORs, with the three variables remaining significant. Thus, the odds of delay in starting treatment were between 49% (OR = 1.49; 95%CI 1.42;1.57) and 95% (OR = 1.95; 95%CI 1.85;2.07) higher in age groups over 40 years compared to ages up to 39 years, 21% (OR = 0.79; 95%CI 0.77; 0.81) lower in 2020 compared to 2019, and 21% (OR = 1.21; 95%CI 1.13;1.31) higher among women who traveled more than 200 km for treatment (Table 3). Analysis of the residuals from this model showed no deviations from the expected distribution.
Discussion
More than half of the female breast cancer cases started oncology treatment within a time frame of more than 60 days after diagnosis in 2019 and 2020, in violation of Law No. 12732/12.12 This situation was worse for the older age groups and for SUS service users who had to travel more than 200 km from their residence for treatment.
The results of this study indicate that the odds of women aged 40 and over having delayed treatment were higher when compared to younger women, this being a finding similar to that of research conducted before the COVID-19 pandemic, between the years 2010 and 2012, which evaluated the time elapsed between an abnormal mammogram and starting treatment.6 A study conducted at a cancer referral center in Rio de Janeiro/RJ, with women diagnosed and treated between 2014 and 2015, identified, among those aged 60 years or older, greater chance of starting treatment more than 60 days after diagnosis.17 Another study conducted in the United States from 2004 to 2006 found that the chance of delay of 60 days or more in starting adjuvant chemotherapy treatment among women with breast cancer also increased with age.18 Presence of comorbidities and difficulty in accessing health services have been identified as factors that can influence late starting of treatment as age increases.19 It should be noted that in the present study it was not possible to assess presence of comorbidities associated with delay in starting treatment, because this variable is not included in the information system used.
Studies that evaluated time elapsed before starting breast cancer treatment indicate that access to diagnostic confirmation is one of the components influencing late treatment initiation and diagnosis of cases at a more advanced stage.20,21 Between 2019 and 2020, there was a reduction in the number of breast cancer diagnoses, indicating women having greater difficulty in confirming diagnosis of malignant neoplasia during the COVID-19 pandemic.22,23
For cases diagnosed in 2020, the year in which the pandemic began in Brazil, when greater difficulty in accessing health services would be expected, we identified a reduction in the proportion of cases with delayed treatment in comparison to cases diagnosed in the previous year. This finding could be related to a lower volume of women diagnosed with breast cancer in 2020, which would reduce the demand for care and consequently reduce the delay in starting treatment. When comparing women diagnosed and treated for breast cancer, before and during the COVID-19 pandemic, a study conducted at a hospital in Philadelphia, USA,24 likewise did not identify greater delays in starting cancer treatment. However, the proportion of diagnosed and untreated service users, which was not addressed in this study, may lead to a misinterpretation, because, although there has been an improvement in the time to treatment initiation, many users may not have accessed treatment, especially in 2020.
A study that evaluated the time to lung cancer treatment initiation in the state of Minas Gerais found that the availability of services in the state’s health macro-regions was also associated with this time interval.25 Our study did not find that macro-regions influenced time to initiation of breast cancer treatment, either for women residing in a macro-region with a SUS licensed service or for women treated in another macro-region. The analysis we used showed that the health macro-region level explained only 4% of the variance. The discordant findings between both studies regarding the existence of this association can be explained - in part - by methodological differences and by the fact that they address two types of cancer, with distinct diagnosis and treatment characteristics.
Although delay in starting treatment was shown to be less in 2020, for some states this time interval increased even though the care flow map shows the main flows taking place within the states themselves. When evaluating breast cancer treatment flows by municipality of residence, Saldanha et al.9 concluded that most flows are to the state capitals or to large cities within the states themselves, which corroborates the flow direction of our results. However, we did find some flows towards other Federative Units, in which macro-region referral services attracted demand, such as the cities of São Paulo/SP and Barretos/SP.
Despite the reduction of around 13.5% in cases diagnosed in 2020, in Brazil as a whole four states showed an increase in the proportion of cases treated after more than 60 days. It is noteworthy that in 12 states, the start of treatment was delayed for more than half of the women diagnosed.
The distance traveled was greater in the North, Northeast and Midwest regions; however, locations with longer traveling distances were not necessarily those with greater delays. In their research into two cancer referral hospitals in the state of Piauí, Souza et al.26 identified that delay in breast cancer treatment occurred regardless of the distance between the person’s residence and the place where treatment was provided, and whether or not the catchment area where the person lived had licensed cancer treatment facilities. The authors of that study concluded that it is the lack of organization of the health care network that contributes to the delay in breast cancer treatment, and not necessarily geographical barriers.
The limitations of this study include the possibility that the categories used to measure traveling are too broad and not sensitive enough to detect the influence of having to travel on the time elapsed until the beginning of treatment. Moreover, we did not assess other dimensions of barriers to access, such as road networks, ease and cost of travel, which are factors that influence travel time. The lack of availability of staging information for all treated cases, due to a limitation of the Oncology Panel,11 made it impossible to evaluate the influence of this factor on the delay in starting breast cancer treatment.
It is possible that not including diagnosed but untreated women in the study group may have influenced the results found. Furthermore, the Oncology Panel only includes cases of SUS users who have a national health card in the “master” category,11 and the public access tabulator only includes people with identified diagnosis of cancer. These two elements may also limit this study. However, a report on the interval between diagnosis and start of first treatment27 shows that the proportion of breast cancer cases without diagnostic information has been progressively reduced. Therefore, the volume of people treated but with no diagnosis held on the database available for analysis may have had little influence on the results of this study.
Despite the limitations pointed out above, this research demonstrates the need to monitor the stages of breast cancer care in the Brazilian National Health System, aiming, above all, to reduce inequities in access to cancer treatment in Brazil. Health care network organization must consider strategies for optimizing referral flows and mitigating the effect of the distance service users need to travel in order to start cancer treatment.

