


 texto em
  Inglês (pdf)
 Artigo em XML
 Referências do artigo
 Curriculum ScienTI
 Enviar este artigo por email
 Citado por SciELO
  Similares em
SciELO
Similares em
SciELO 
 Permalink
INTRODUCTION
Epidemiological surveillance, when integrated with immunization actions, enables control, eradication and elimination of vaccine-preventable diseases, promoting improvement in the population’s health.1),(2 However, the benefits of immunization are unequally distributed: among poorer, more marginalized and more vulnerable populations, access to these benefits is limited to immunization services.3
The Immunization Agenda 2030 (IA2030) aims to improve the global population’s access to primary health care and achieve universal coverage of vaccine products. In this sense, childhood vaccination is essential for strengthening public health policies, as well as implementation and progress of immunization programs worldwide.3
Several countries achieved improvement in child vaccination coverage between 1980 and 2010.4 However, in the 2010s, with the introduction and expansion of new vaccines, particularly in Latin America and the Caribbean, reductions in vaccination coverage were seen, with fewer countries in these regions of the Americas achieving 90% coverage for five of the nine childhood vaccines between 2013 and 2017: only 61% of Latin American and Caribbean countries achieved 90% coverage for the first dose of the triple viral vaccine in 2017.4),(5
Difficulties in achieving or maintaining the immunization coverage target are recurrent. In 2020 especially, during the early stages of the novel coronavirus (COVID-19) pandemic, routine childhood immunization services were interrupted due to social distancing measures taken with the aim of preventing SARS-CoV-2 transmission. Consequently, mass vaccination campaigns intended to prevent diseases such as measles, meningitis and polio were not undertaken.6
The Brazilian National Immunization Program has achieved worldwide recognition, given the geographic dimension and complexity of operations involved in vaccination campaigns, routine vaccination and vaccine blockades in the country.7),(8
The National Immunization Program offers, free of charge, a variety of immunobiologics for different age groups, from childhood to old age. Through the population’s adherence to vaccination and timely health surveillance, measles transmission in the Americas was interrupted.9),(10 Measles is an extremely contagious disease, it can cause serious complications and even death, especially in children under 5 years of age and malnourished children.11 However, the circulation of measles in other regions of the world led to the reintroduction of the virus in Brazil in 2018,12 associated with the drop in vaccination coverage in the country.10),(13),(14
Vaccination coverage is one of the indicators capable of evaluating the performance of vaccination strategies, when measuring the effect of the intervention on an eligible population. Another indicator of vaccination coverage is the dropout rate, which estimates the population’s adherence to the vaccination schedule proposed by the Brazilian National Immunization Program, that is, how many people started but did not complete the vaccination schedule. Vaccination coverage also estimates the effectiveness of interventions, compared to programmed actions.15),(16
Surveillance of immunization indicators is essential for achieving and maintaining established coverage targets, aiming to protect the population from vaccine-preventable diseases, especially those that affect children.15),(17
Brazil offers triple viral vaccination - against measles, mumps and rubella (MMR) - on the childhood vaccination schedule, with a first dose at 12 months old; and the second dose of MMR vaccine or, alternatively, a dose of tetraviral vaccine - against measles, mumps, rubella and varicella (MMRV) at 15 months old. This has been the National Immunization Program guideline since 2014.
The objective of this study was to analyze the temporal trend of MMR vaccination coverage and dropout rate in Brazil, according to the country’s Federative Units (FUs) and Macro-Regions, from 2014 to 2021.
METHODS
This was an ecological time series study, using data from the National Immunization Program Information System (Sistema de Informações do Programa Nacional de Imunizações - SI-PNI)18 and the Live Birth Information System (Sistema de Informações sobre Nascidos Vivos - SINASC),19 for the period 2014-2021, taking the Brazilian territory as a whole, its FUs and its macro-regions as units of analysis.
The SI-PNI system aggregates information related to the records of administered vaccine doses, by period of time and geographic area of vaccine administration.18 The SINASC system holds information regarding births registered in Brazil.19 The two databases are freely accessible, being made available by the Brazilian National Health System Department of Information Technology (Departamento de Informática do Sistema Único de Saúde - DATASUS).18),(19
We consulted the SI-PNI and SINASC records and processed the resulting data using the Health Information Tabulator (Tabulador de Informações em Saúde - TabNet), an application made available by DATASUS.18),(19 Data from both systems were accessed on October 25, 2022 and filtered using TabNet, as follows:
a) Administered doses - SI-PNI
- period (2014 - 2021);
- FU;
- imunobiolologic (MMR and MMRV vaccines); and
- dose (1st dose and 2nd dose);
b) Live birth population - SINASC
- period (2014 - 2021);
- FU;
- year of birth; and
- birth according to mother’s place of residence.
Vaccination coverage was calculated using the following formula:
When selecting the “second dose” variable, we compared the amounts of MMR vaccine and MMRV vaccine administered in each FU and opted for the vaccine with the highest number of doses administered there. This procedure was necessary as there was variation in the distribution logistics of these vaccines in the Brazil throughout the analyzed period.20 The median value was used when calculating vaccine coverage by macro-region.
The dropout rate was calculated based on the first administered doses of the MMR vaccine and the second administered doses of the MMR or MMRV vaccines, using the same choice criterion defined for calculating vaccination coverage. The dropout rate was calculated using the following formula:
When FUs had inconsistent dropout rates, such as values < 1% or negative values, these were replaced by the dropout rate value for the previous year.
Joinpoint regression analysis models based on the Monte Carlo permutation method were used for temporal analysis of vaccination coverage and dropout rate. This regression model verifies whether a line with multiple points is statistically better for describing the temporal evolution of vaccination coverage and dropout rate, compared to a straight line. Classifying temporal trend as not significant (p-value > 0.05), positive (p-value < 0.05 and positive regression coefficient) or negative (p-value < 0.05 and negative regression coefficient) allowed us to calculate annual percentage change (APC) and the average change over the period (ACP). In the regression model, years with a dropout rate < 1 were excluded, by FU.21),(22) A 95% confidence interval (95%CI) was used for all temporal trends.
We generated thematic maps of vaccination coverage ACP and dropout rate ACP per FU. The ACP value strata used in the thematic maps were obtained by adopting the QGIS program natural breaks procedure.
The digital grid for Brazil and its Federative Units was obtained from the webpage of the Brazilian Institute of Geography and Statistics (Instituto Brasileiro de Geografia e Estatística - IBGE) (https://www.ibge.gov.br/geociencias/downloads-geociencias.html), which we accessed on December 29, 2022.
In order to perform the analyses, we used the Join Point Regression Program, version 4.9.1.0, dated April 2022 (Statistical Research and Applications Branch, National Cancer Institute), and the QGIS Geographic Information System.23
As only secondary public domain and freely accessible data sources were used, the study project did not need to be submitted to a Research Ethics Committee.
RESULTS
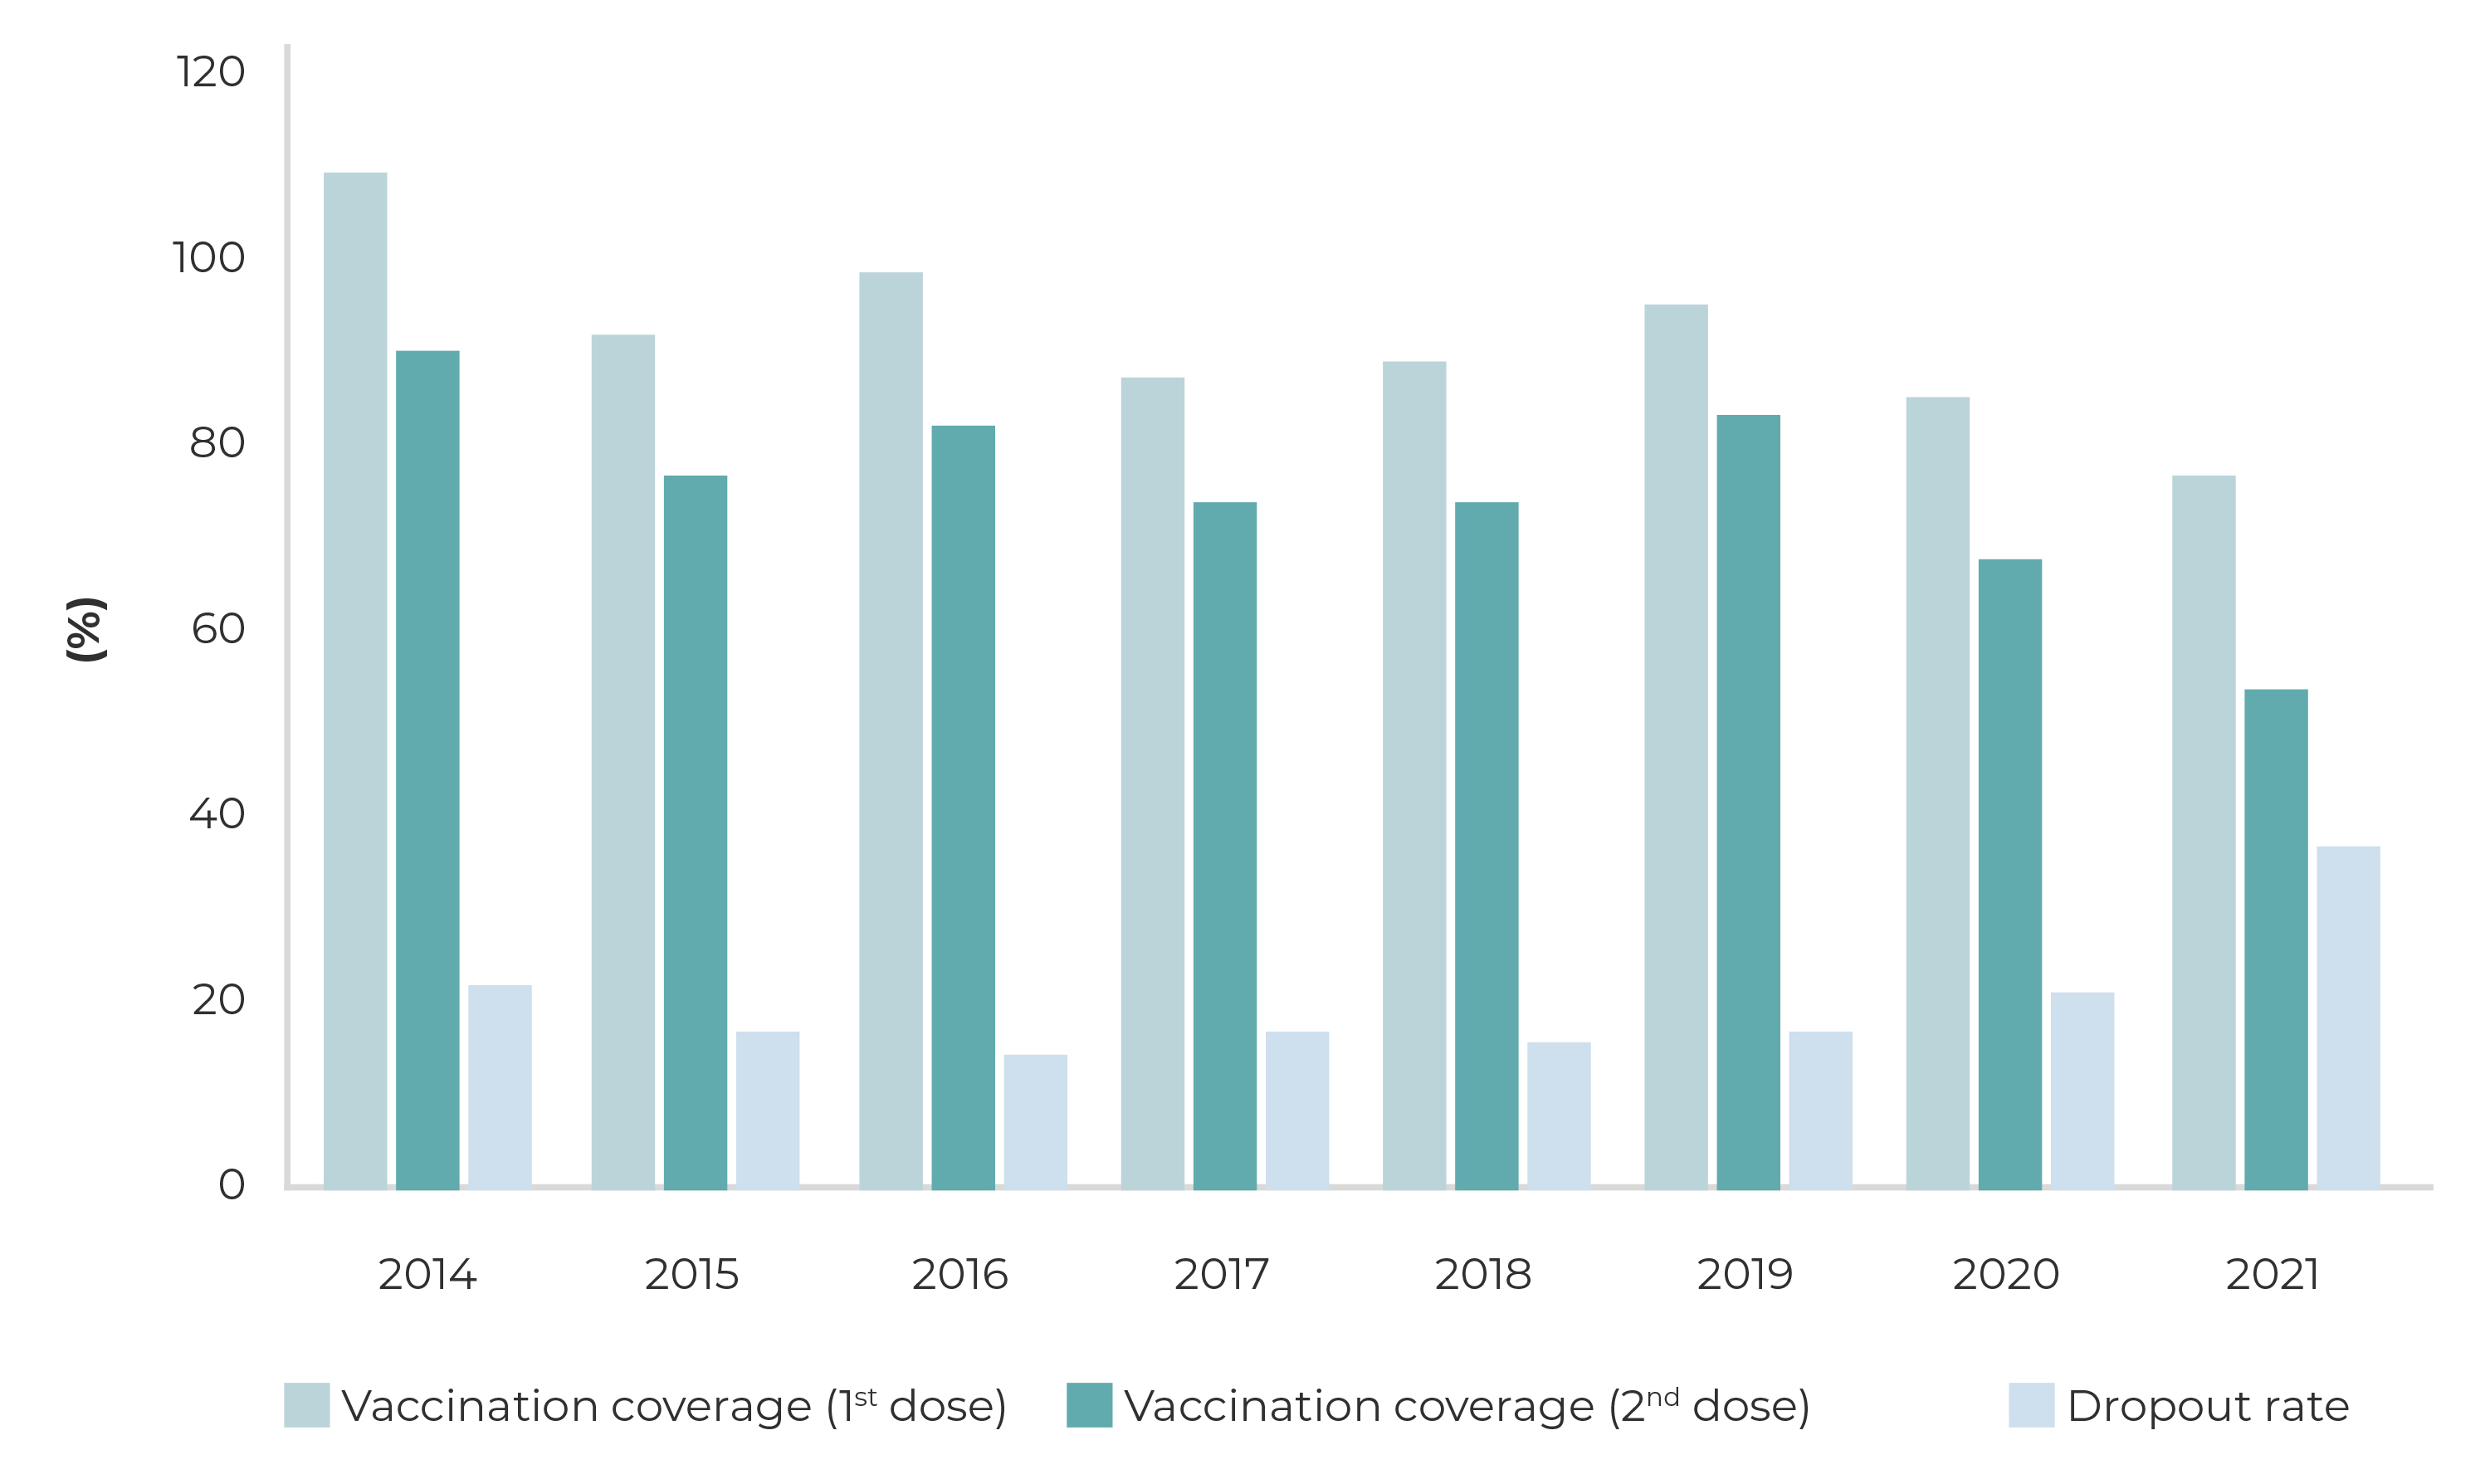
In Brazil, MMR vaccine coverage ranged from 92.3% to 54.4% between 2015, 2017, 2018, 2020 and 2021. As for the second dose, MMR or MMRV vaccine coverage was below 95% in the period studied period. The dropout rate remained high throughout the period, ranging from 22.2% (2014) to 37.4% (2021) (Figure 1).
For Brazil as a whole, the temporal trend as per the MMR vaccine first dose coverage regression model was not significant, both in the first period, from 2014 to 2019 (APC = -2.4; 95%CI -8.6;4.2), and in the second period, from 2019 to 2021 (APC = -6.7; 95%CI -30.3;25.1) (Table 1).
Table 1 Temporal trends of MMR (1st dose), and MMR or MMRV (2nd dose) vaccination coverage, according to joinpoint regression, in the national macro-regions and Federative Units, Brazil, 2014-2021
| Region/ Federative Unit | 1st dose | 2nd dose | ||||
|---|---|---|---|---|---|---|
| Period | APCa (95%CIb) | Trendc | Period | APCa (95%CIb) | Trendc | |
| North | 2014-2019 | -4.3 (-8.6;0.1) | Not significant | 2014-2019 | -1.1 (-10.5;9.3) | Not significant |
| 2019-2021 | -7.9 (-24.8;12.7) | 2019-2021 | -23.2 (-50.8;20.0) | |||
| RO | 2014-2016 | -9.7 (-36.0;27.4) | Not significant | 2014-2019 | -5.0 (-11.1;1.5) | Not significant |
| 2016-2021 | -3.9 (-11.0;3.8) | 2019-2021 | -23.5 (-43.1;2.9) | |||
| AC | 2014-2019 | -2.5 (-6.8;2.0) | Not significant | 2014-2019 | 6.0 (-6.0;19.5) | Not significant |
| 2019-2021 | -11.2 (-27.4;8.7) | 2019-2021 | -38.9 (-64.3;4.5) | |||
| AM | 2014-2016 | -9.0 (-37.0;31.5) | Not significant | 2014-2019 | -0.9 (-10.2;9.4) | Not significant |
| 2016-2021 | -2.4 (-10.1;6.0) | 2019-2021 | -23.5 (-50.8;18.8) | |||
| RR | 2014-2019 | -9.4c (-13.4;-5.1) | Negative | 2014-2019 | -4.0c (-7.6;-0.3) | |
| 2019-2021 | -0.3 (-18.8;22.5) | Not significant | 2019-2021 | -27.5c (-38.7;-14.2) | Negative | |
| PA | 2014-2016 | -16.0 (-49.0;38.4) | Not significant | 2014-2019 | 5.4 (-11.5;25.5) | Not significant |
| 2016-2021 | -0.6 (-11.1;11.2) | 2019-2021 | -32.4 (-69.1;47.8) | |||
| AP | 2014-2019 | -5.9 (-15.1;4.3) | Not significant | 2014-2019 | -4.2 (-16.6;10.0) | Not significant |
| 2019-2021 | -9.9 (-43.0;42.5) | 2019-2021 | -28.6 (-61.6;32.6) | |||
| TO | 2014-2017 | -4.9 (-17.2;9.2) | Not significant | 2014-2019 | 1.7 (-16.9;24.4) | Not significant |
| 2017-2021 | -0.4 (-8.8;8.6) | 2019-2021 | -20.1 (-67.6;97.0) | |||
| Northeast | 2014-2019 | -2.5 (11.2;7.1) | Not significant | 2014-2019 | -3.4 (-9.8;3.5) | Not significant |
| 2019-2021 | -9.1 (-40.2;38.2) | 2019-2021 | -17.9 (-39.6;11.5) | |||
| MA | 2014-2016 | -15.1 (-43.8;28.2) | Not significant | 2014-2016 | -18.8 (-59.2;61.7) | Not significant |
| 2016-2021 | -3.6 (-12.1;5.7) | 2016-2021 | -4.2 (-17.9;11.8) | |||
| PI | 2014-2016 | -4.9 (-31.6;32.0) | Not significant | 2014-2019 | 0.6 (-9.4;11.7) | Not significant |
| 2016-2021 | 0.7 (-6.4;8.4) | 2019-2021 | -14.7 (-46.6;36.3) | |||
| CE | 2014-2019 | -4.2 (-14.5;7.3) | Not significant | 2014-2019 | -5.7 (-16.3;6.2) | Not significant |
| 2019-2021 | -11.1 (-46.5;47.9) | 2019-2021 | -14.3 (-49.6;45.7) | |||
| RN | 2014-2019 | -2.4 (-11.4;7.5) | Not significant | 2014-2016 | -17.4 (-71.0;135.1) | Not significant |
| 2019-2021 | -8.3 (-40.4;41.3) | 2016-2021 | -2.6 (-22.9;23.0) | |||
| PB | 2014-2019 | -2.0 (-10.9;7.9) | Not significant | 2014-2019 | 1.0 (-11.7;15.5) | Not significant |
| 2019-2021 | -12.7 (-43.1;33.9) | 2019-2021 | -23.3 (-57.9;39.7) | |||
| PE | 2014-2019 | -1.0 (-11.9;11.2) | Not significant | 2014-2019 | -3.9 (-4.5;-3.3) | Not significant |
| 2019-2021 | -15.7 (-49.9;41.9) | 2019-2021 | -20.5 (-22.8;-18.1) | |||
| AL | 2014-2019 | -1.5 (-7.2;4.5) | Not significant | 2014-2019 | -4.8 (-10.4;1.2) | Not significant |
| 2019-2021 | -12.9 (-33.1;13.4) | 2019-2021 | -14.9 (-35.1;11.5) | |||
| SE | 2014-2019 | -0.7 (-6.4;5.4) | Not significant | 2014-2019 | -2.5 (-6.2;1.4) | Not significant |
| 2019-2021 | -7.8 (-29.1;20.1) | 2019-2021 | -7.6 (-22.3;10.0) | |||
| BA | 2014-2016 | -13.5 (-45.8;38.0) | Not significant | 2014-2016 | -16.1 (-58.5;69.6) | Not significant |
| 2016-2021 | -2.0 (-11.7;8.8) | 2016-2021 | -3.8 (-17.8;12.6) | |||
| Southeast | 2014-2019 | -1.5 (-8.1;5.6) | Not significant | 2014-2019 | -1.5 (-4.4;1.5) | Not significant |
| 2019-2021 | 5.6 (-30.8;28.7) | 2019-2021 | -9.0 (-20.4;4.1) | |||
| MG | 2014-2019 | -1.2 (-6.2;4.1) | Not significant | 2014-2019 | 1.8 (-11.2;16.8) | Not significant |
| 2019-2021 | -4.3 (-24.3;20.8) | 2019-2021 | -11.1 (-51.9;64.2) | |||
| ES | 2014-2019 | -1.7 (-11.2;8.8) | Not significant | 2014-2019 | -1.8 (-8.0;4.9) | Not significant |
| 2019-2021 | -4.6 (-39.4;50.3) | 2019-2021 | -7.8 (-31.2;23.5) | |||
| RJ | 2014-2019 | -1.8 (-9.1;6.2) | Not significant | 2014-2019 | -4.5 (-6.8;-2.2) | Not significant |
| 2019-2021 | -23.7 (-46.2;8.1) | 2019-2021 | -27.8 (-35.2;-19.6) | |||
| SP | 2014-2019 | -1.1 (-4.5;2.5) | Not significant | 2014-2019 | -2.4 (-5.0;0.2) | Not significant |
| 2019-2021 | -4.3 (-18.4;12.4) | 2019-2021 | -9.4 (-19.7;2.3) | |||
| South | 2014-2017 | -5.1 (-14.2;4.9) | Not significant | 2014-2019 | 1.2 (-9.8;13.5) | Not significant |
| 2017-2021 | 0.6 (-5.6;7.2) | 2019-2021 | -9.6 (-46.0;51.2) | |||
| PR | 2014-2017 | -5.6 (-13.1;2.5) | Not significant | 2014-2019 | 1.7 (-7.9;12.3) | Not significant |
| 2017-2021 | 0.9 (-4.2;6.3) | 2019-2021 | -11.1 (-42.9;38.5) | |||
| SC | 2014-2017 | -5.3 (-15.8;6.4) | Not significant | 2014-2019 | 0.9 (-9.8;12.9) | Not significant |
| 2017-2021 | 0.0 (-7.1;7.7) | 2019-2021 | -9.3 (-45.1;49.8) | |||
| RS | 2014-2016 | -5.7 (-32.9;32.6) | Not significant | 2014-2019 | 3.4 (-10.0;18.8) | Not significant |
| 2016-2021 | 0.2 (-7.1;8.2) | 2019-2021 | -17.9 (-55.9;53.1) | |||
| Midwest | 2014-2017 | -7.0 (-23.3;12.7) | Not significant | 2014-2019 | 0.2 (-14.0;16.6) | Not significant |
| 2017-2021 | - 0.5 (-11.9;12.3) | 2019-2021 | -23.2 (-61.1;51.7) | |||
| MS | 2014-2016 | -12.6 (-47.1;44.5) | Not significant | 2014-2019 | -0.2 (-17.1;20.1) | Not significant |
| 2016-2021 | -3.0 (-13.3;8.6) | 2019-2021 | -32.8 (-70.7;54.1) | |||
| MT | 2014-2017 | -7.1 (-20.7; 8.9) | Not significant | 2014-2019 | -1.5 (-11.9;10.1) | Not significant |
| 2017-2021 | -1.0 (-10.4;9.5) | 2019-2021 | -23.2 (-53.4;26.6) | |||
| GO | 2014-2016 | -11.5 (-28.2;9.1) | Not significant | 2014-2019 | 0.5 (-13.6;17.0) | Not significant |
| 2016-2021 | -0.7 (-5.3;4.0) | 2019-2021 | -18.1 (-58.4;61.1) | |||
| DF | 2014-2016 | 5.2 (-12.3;26.3) | Not significant | 2014-2016 | 14.0 (-41.9;123.8) | Not significant |
| 2016-2021 | -1.9 (-5.9;2.2) | 2016-2021 | -8.9 (-21.6;6.0) | |||
| Brazil | 2014-2019 | -2.4 (-8.6;4.2) | Not significant | 2014-2019 | -1.6 (-7.0;4.2) | Not significant |
| 2019-2021 | -6.7 (-30.3;25.1) | 2019-2021 | -15.4 (-34.4;9.0) | |||
a) APC: Annual percentage change; b) 95%CI: 95% confidence interval; c) significance teste using the Monte Carlo permution method.
As for coverage of the second MMR dose or its replacement by a dose of MMRV vaccine, the regression model showed the same periods of non-significant temporal vaccine coverage trends as the first dose. However, for the period as a whole, from 2014 to 2021, a negative trend was found (ACP = -5.8; 95%CI = -10.5;-0.8), from 91.0% (2014) to 54.4% (2021) (Figure 1).
The temporal trend in the dropout rate regression model was not considered to be significant, both in the period 2014-2019 and also in the period 2019-2021.
Brazilian macro-regions
The results of the temporal trend analysis of MMR vaccine first dose coverage for the Brazilian macro-regions were not significant for the North, Northeast and Southeast regions, from 2014 to 2019 (Table 1).
The North and Northeast regions showed the same temporal behaviors as Brazil as a whole for first dose MMR vaccine coverage, between 2014 and 2021. The trend was negative (ACP = -5.4; 95%CI -9.2;-1.4), decreasing from 105.0% (2014) to 71.0% (2021) in the Northern region (Table 2 and Figure 2A). In the case of MMR (or MMRV) vaccine second dose coverage, a non-significant temporal trend prevailed in the Brazilian regions. A negative trend was found for the Southeast region (ACP = -3.7; 95%CI -6.3;-1.1), falling from 92% (2014) to 66.6% (2021) (Table 2 and Figure 2B). The dropout rate was not significant in any of the Brazilian regions throughout the study period (Table 3).
Table 2 MMR (1st dose), and MMR or MMRV (2nd dose), in the national macro-regions and Federative Units, Brazil, 2014-2021
| Region/ Federative Unit | 1st dose | 2nd dose | ||||||
|---|---|---|---|---|---|---|---|---|
| Period | Population < 1 year | Doses administered | Coverage (%) | Period | Population < 1 year | Doses administered | Coverage (%) | |
| North | 2014-2019 | 316,408 | 277,688 | 87.7 | 2014-2019 | 316,408 | 213,955 | 67.6 |
| 2019-2021 | 305,655 | 234,748 | 76.8 | 2019-2021 | 305,655 | 173,553 | 56.7 | |
| RO | 2014-2016 | 27,739 | 34,208 | 123.3 | 2014-2019 | 27,534 | 24,929 | 90.5 |
| 2016-2021 | 26,803 | 26,703 | 99.6 | 2019-2021 | 26,208 | 17,165 | 65.4 | |
| AC | 2014-2019 | 16,559 | 13,941 | 84.1 | 2014-2019 | 16,559 | 10,089 | 60.9 |
| 2019-2021 | 15,521 | 11,294 | 72.7 | 2019-2021 | 15,521 | 7,955 | 51.2 | |
| AM | 2014-2016 | 80,621 | 81,868 | 101.5 | 2014-2019 | 78,819 | 59,222 | 75.1 |
| 2016-2021 | 76,958 | 64,709 | 84.0 | 2019-2021 | 76,297 | 46,129 | 60.4 | |
| RR | 2014-2019 | 11,798 | 10,820 | 91.7 | 2014-2019 | 11,798 | 9,811 | 83.1 |
| 2019-2021 | 14,047 | 9,133 | 65.0 | 2019-2021 | 14,047 | 7,627 | 54.2 | |
| PA | 2014-2016 | 143,580 | 129,723 | 90.3 | 2014-2019 | 141,068 | 79,391 | 56.2 |
| 2016-2021 | 137,067 | 98,221 | 71.6 | 2019-2021 | 134,739 | 70,573 | 52.3 | |
| AP | 2014-2019 | 15,761 | 14,049 | 89.1 | 2014-2019 | 15,761 | 11,598 | 73.5 |
| 2019-2021 | 14,874 | 10,416 | 70.0 | 2019-2021 | 14,874 | 7,472 | 50.2 | |
| TO | 2014-2017 | 24,641 | 23,828 | 96.7 | 2014-2019 | 24,641 | 19,113 | 77.5 |
| 2017-2021 | 24,464 | 21,041 | 86.0 | 2019-2021 | 24,464 | 17,422 | 71.2 | |
| Northeast | 2014-2019 | 825,948 | 808,278 | 97.8 | 2014-2019 | 825,948 | 605,616 | 73.3 |
| 2019-2021 | 782,217 | 656,844 | 83.9 | 2019-2021 | 782,217 | 480,680 | 61.4 | |
| MA | 2014-2016 | 117,317 | 123,694 | 105.4 | 2014-2016 | 117,317 | 92,323 | 78.6 |
| 2016-2021 | 111,018 | 82,263 | 74.0 | 2016-2021 | 111,018 | 59,086 | 53.2 | |
| PI | 2014-2016 | 48,597 | 41,195 | 84.7 | 2014-2019 | 48,444 | 31,034 | 64.0 |
| 2016-2021 | 47,236 | 38,943 | 82.4 | 2019-2021 | 46,130 | 27,876 | 60.4 | |
| CE | 2014-2019 | 129,346 | 148,190 | 114.5 | 2014-2019 | 129,346 | 118,188 | 91.3 |
| 2019-2021 | 124,331 | 113,893 | 91.6 | 2019-2021 | 124,331 | 90,104 | 72.4 | |
| RN | 2014-2019 | 47,381 | 43,787 | 92.4 | 2014-2016 | 48,605 | 38,896 | 80.0 |
| 2019-2021 | 43,697 | 37,013 | 84.7 | 2016-2021 | 45,131 | 26,386 | 58.4 | |
| PB | 2014-2019 | 58,081 | 56,730 | 97.6 | 2014-2019 | 58,081 | 39,092 | 67.3 |
| 2019-2021 | 56,819 | 48,964 | 86.1 | 2019-2021 | 56,819 | 35,275 | 62.0 | |
| PE | 2014-2019 | 138,699 | 145,678 | 105.0 | 2014-2019 | 138,699 | 105,147 | 75.8 |
| 2019-2021 | 130,107 | 112,742 | 86.6 | 2019-2021 | 130,107 | 80,129 | 61.5 | |
| AL | 2014-2019 | 51,028 | 53,423 | 104.6 | 2014-2019 | 51,028 | 37,963 | 74.3 |
| 2019-2021 | 48,828 | 43,961 | 89.4 | 2019-2021 | 48,828 | 29,147 | 59.6 | |
| SE | 2014-2019 | 33,925 | 30,955 | 91.24 | 2014-2019 | 33,925 | 25,193 | 76.5 |
| 2019-2021 | 32,088 | 27,006 | 84.1 | 2019-2021 | 32,088 | 21,777 | 67.8 | |
| BA | 2014-2016 | 205,344 | 212,162 | 103.3 | 2014-2016 | 205,344 | 172,157 | 83.8 |
| 2016-2021 | 197,404 | 160,343 | 81.2 | 2016-2021 | 197,404 | 119,084 | 60.3 | |
| Southeast | 2014-2019 | 1,161,104 | 1,131,875 | 97.4 | 2014-2019 | 1,161,104 | 944,673 | 81.3 |
| 2019-2021 | 1,069,265 | 955,463 | 89.3 | 2019-2021 | 1,069,265 | 783,218 | 73.2 | |
| MG | 2014-2019 | 262,710 | 258,335 | 98.3 | 2014-2019 | 262,710 | 209,693 | 79.8 |
| 2019-2021 | 250,429 | 234,775 | 93.7 | 2019-2021 | 250,429 | 198,811 | 79.3 | |
| ES | 2014-2019 | 55,893 | 53,727 | 96.1 | 2014-2019 | 55,893 | 44,143 | 78.9 |
| 2019-2021 | 54,153 | 48,820 | 90.1 | 2019-2021 | 54,153 | 41,405 | 76.4 | |
| RJ | 2014-2019 | 226,679 | 236,052 | 104.1 | 2014-2019 | 226,679 | 174,434 | 76.9 |
| 2019-2021 | 202,079 | 156,917 | 77.6 | 2019-2021 | 202,079 | 112,494 | 55.6 | |
| SP | 2014-2019 | 615,819 | 583,761 | 94.7 | 2014-2019 | 615,819 | 516,401 | 83.8 |
| 2019-2021 | 562,603 | 514,951 | 91.5 | 2019-2021 | 562,603 | 430,507 | 76.5 | |
| South | 2014-2017 | 398,260 | 387,959 | 97.4 | 2014-2019 | 397,648 | 327,646 | 82.3 |
| 2017-2021 | 385,891 | 346,834 | 89.8 | 2019-2021 | 378,665 | 308,262 | 81.4 | |
| PR | 2014-2017 | 158,642 | 158,753 | 100.0 | 2014-2019 | 157,966 | 134,750 | 85.3 |
| 2017-2021 | 151,990 | 138,624 | 91.2 | 2019-2021 | 148,683 | 124,132 | 83.4 | |
| SC | 2014-2017 | 95,256 | 94,730 | 99.4 | 2014-2019 | 96,742 | 79,433 | 82.1 |
| 2017-2021 | 98,361 | 87,673 | 89.1 | 2019-2021 | 97,954 | 81,162 | 82.8 | |
| RS | 2014-2016 | 145,837 | 136,896 | 93.8 | 2014-2019 | 142,940 | 113,462 | 79.3 |
| 2016-2021 | 136,517 | 122,054 | 89.4 | 2019-2021 | 132,026 | 102,967 | 77.9 | |
| Midwest | 2014-2017 | 242,517 | 248,493 | 102.4 | 2014-2019 | 243,529 | 197,818 | 81.2 |
| 2017-2021 | 238,425 | 205,532 | 86.2 | 2019-2021 | 234,009 | 160,762 | 68.6 | |
| MS | 2014-2016 | 44,100 | 54,160 | 122.8 | 2014-2019 | 43,930 | 39,112 | 89.0 |
| 2016-2021 | 42,960 | 48,429 | 112.7 | 2019-2021 | 42,103 | 28,936 | 68.7 | |
| MT | 2014-2017 | 55,567 | 56,248 | 101.2 | 2014-2019 | 56,524 | 44,894 | 79.4 |
| 2017-2021 | 57,769 | 48,429 | 83.8 | 2019-2021 | 57,642 | 37,442 | 64.9 | |
| GO | 2014-2016 | 100,235 | 101,854 | 101.6 | 2014-2019 | 98,485 | 73,892 | 75.0 |
| 2016-2021 | 95,600 | 81,222 | 84.9 | 2019-2021 | 93,882 | 63,809 | 67.9 | |
| DF | 2014-2016 | 45,421 | 37,856 | 83.3 | 2014-2016 | 45,421 | 34,629 | 76.2 |
| 2016-2021 | 42,207 | 40,226 | 95.3 | 2016-2021 | 45,207 | 37,010 | 81.8 | |
Federative Units
The results of the temporal trend analysis of MMR vaccine first dose coverage by FU showed a negative trend in Roraima (APC = -9.4; 95%CI -13.4;-5.1), from 105.0% (2014) to 65.1% (2019) (Tables 1 and 2). With regard to the temporal trend in the period as a whole, from 2014 to 2021, Acre and Rio de Janeiro reported negative trends (Figure 2A).
The FUs that make up the Southeast region showed the same temporal behaviors for MMR vaccine first dose coverage as the region as a whole (Table 1).
Regarding MMR vaccine (or MMRV vaccine) second dose coverage, Roraima showed a negative trend in the period 2014-2019 (APC = -4.0; 95%CI -7.6;-0.3) and in the period 2019-2021 (APC = -27.5; 95%CI -38.7;-14.2), ranging from 85.6% to 37.0% in the period as a whole, from 2014 to 2021. In this longer period, negative trends were also found for Rondônia, Amapá, Pernambuco, Alagoas, Sergipe and Rio de Janeiro (Tables 1 and 2; Figure 2B).
Dropout rate trends over time were not assessed for Roraima and the Federal District because they were less than 1% between 2017 and 2019 (Table 3).
Table 3 Dropout rate temporal trend, according to joinpoint regression, in the national macro-regions and Federative Units, Brazil, 2014-2021
| Region/ Federative Unit | Period | APCa (95%CIb) |
|---|---|---|
| North | 2014-2016 | -35.9 (-86.6;207.0) |
| 2016-2021 | 26.8 (-10.7;79.9) | |
| RO | 2014-2016 | -20.0 (-74.4;150.4) |
| 2016-2021 | 23.2 (-4.5;59.0) | |
| AC | 2014-2019 | -23.2 (-47.3;11.9) |
| 2019-2021 | 139.0 (-55.7;1188.5) | |
| AM | 2014-2019 | -10.8 (-43.0;39.5) |
| 2019-2021 | 95.1 (-73.6;1341.8) | |
| RR | 2014-2021c | 9.3 (-24.3;57.8) |
| PA | 2014-2019 | -21.5 (-56.0;40.3) |
| 2019-2021 | 91.4 (-85.7;2465.8) | |
| AP | 2014-2016 | -33.8 (-82.2;146.3) |
| 2016-2021 | 27.7 (-4.8;71.3) | |
| TO | 2014-2019 | -16.1 (-67.3;115.4) |
| 2019-2021 | 128.5 (-96.6;15419.1) | |
| Northeast | 2014-2019 | 0.0 (-26.2;35.6) |
| 2019-2021 | 32.1 (-66.1;414.5) | |
| MA | 2014-2019 | 0.5 (-16.3;20.6) |
| 2019-2021 | 11.7 (50.6;152.8) | |
| PI | 2014-2016 | -3.4 (-16.1;11.2) |
| 2016-2021 | 42.1 (42.1;-24.3) | |
| CE | 2014-2016 | 43.9 (43.9;252.2) |
| 2016-2021 | -2.5 (-20.2;19.0) | |
| RN | 2014-2016 | 43.2 (-56.8;374.8) |
| 2016-2021 | -2.3 (-25.3;27.7) | |
| PB | 2014-2019 | -10.9 (-29.2;12.3) |
| 2019-2021 | 40.1 (-50.1;293.4) | |
| PE | 2014-2016 | 46.9 (-60.0;439.8) |
| 2016-2021 | -1.0 (-26.0;32.4) | |
| AL | 2014-2016 | 29.3 (-4.6;75.2) |
| 2016-2021 | 1.0 (-5.6;8.2) | |
| SE | 2014-2018 | 8.0 (-14.6;36.6) |
| 2018-2021 | 1.7 (32.2;42.5) | |
| BA | 2014-2019 | -0.7 (-22.2;26.8) |
| 2019-2021 | 29.6 (-56.6;286.9) | |
| Sortheast | 2014-2019 | 2.2 (-13.2;20.4) |
| 2019-2021 | 21.4 (-41.5;152.0) | |
| MG | 2014-2017 | -35.5 (-85.8;193.2) |
| 2017-2021 | 25.8 (51.7;227.6) | |
| ES | 2014-2019 | -6.0 (-35.3;36.5) |
| 2019-2021 | 27.0 (-76.0;573.4) | |
| RJ | 2014-2016 | 37.8 (-53.6;309.0) |
| 2016-2021 | 0.4 (-21.3;28.1) | |
| SP | 2014-2017 | -18.4 (73.2;148.6) |
| 2017-2021 | 31.9 (-34.8;166.8) | |
| Sorth | 2014-2018 | -23.4 (-62.5;56.5) |
| 2018-2021 | 45.7 (-52.9;350.8) | |
| PR | 2014-2019 | -42.1 (-70.8;14.8) |
| 2019-2021 | 261.0 (-83.1;7609.6) | |
| SC | 2014-2019 | -35.7 (-61.0;6.1) |
| 2019-2021 | 93.1 (-79.4;1710.0) | |
| RS | 2014-2019 | -26.7 (-64.6;51.8) |
| 2019-2021 | 173.0 (-89.5;6979.6) | |
| Midwest | 2014-2016 | -55.3 (-93.9;226.1) |
| 2016-2021 | 42.9 (-8.4;122.9) | |
| MS | 2014-2018 | -27.3 (-74.0;102.7) |
| 2018-2021 | 82.3 (-64.0;823.2) | |
| MT | 2014-2019 | -16.7 (-35.5;7.6) |
| 2019-2021 | 132.2 (-26.1;629.7) | |
| GO | 2014-2019 | -24.3 (-58.8;39.0) |
| 2019-2021 | 93.1 (-87.2;2822.5) | |
| DF | 2014-2021c | 29.7 (-26.8;130.1) |
| Brazil | 2014-2019 | -3.9 (-15.8;9.7) |
| 2019-2021 | 49.2 (-17.5;169.9) |
a) Annual percentage change; b) 95%CI: 95% confidence interval; c) Without regression results, due to the low values.
Note: All trends were stationary.
Vaccination coverage and dropout rate indicators, according to the period observed, showed different trends within the same region of the country, showing temporal heterogeneity between the FUs (Tables 1, 2 and 3; Figure 2C).
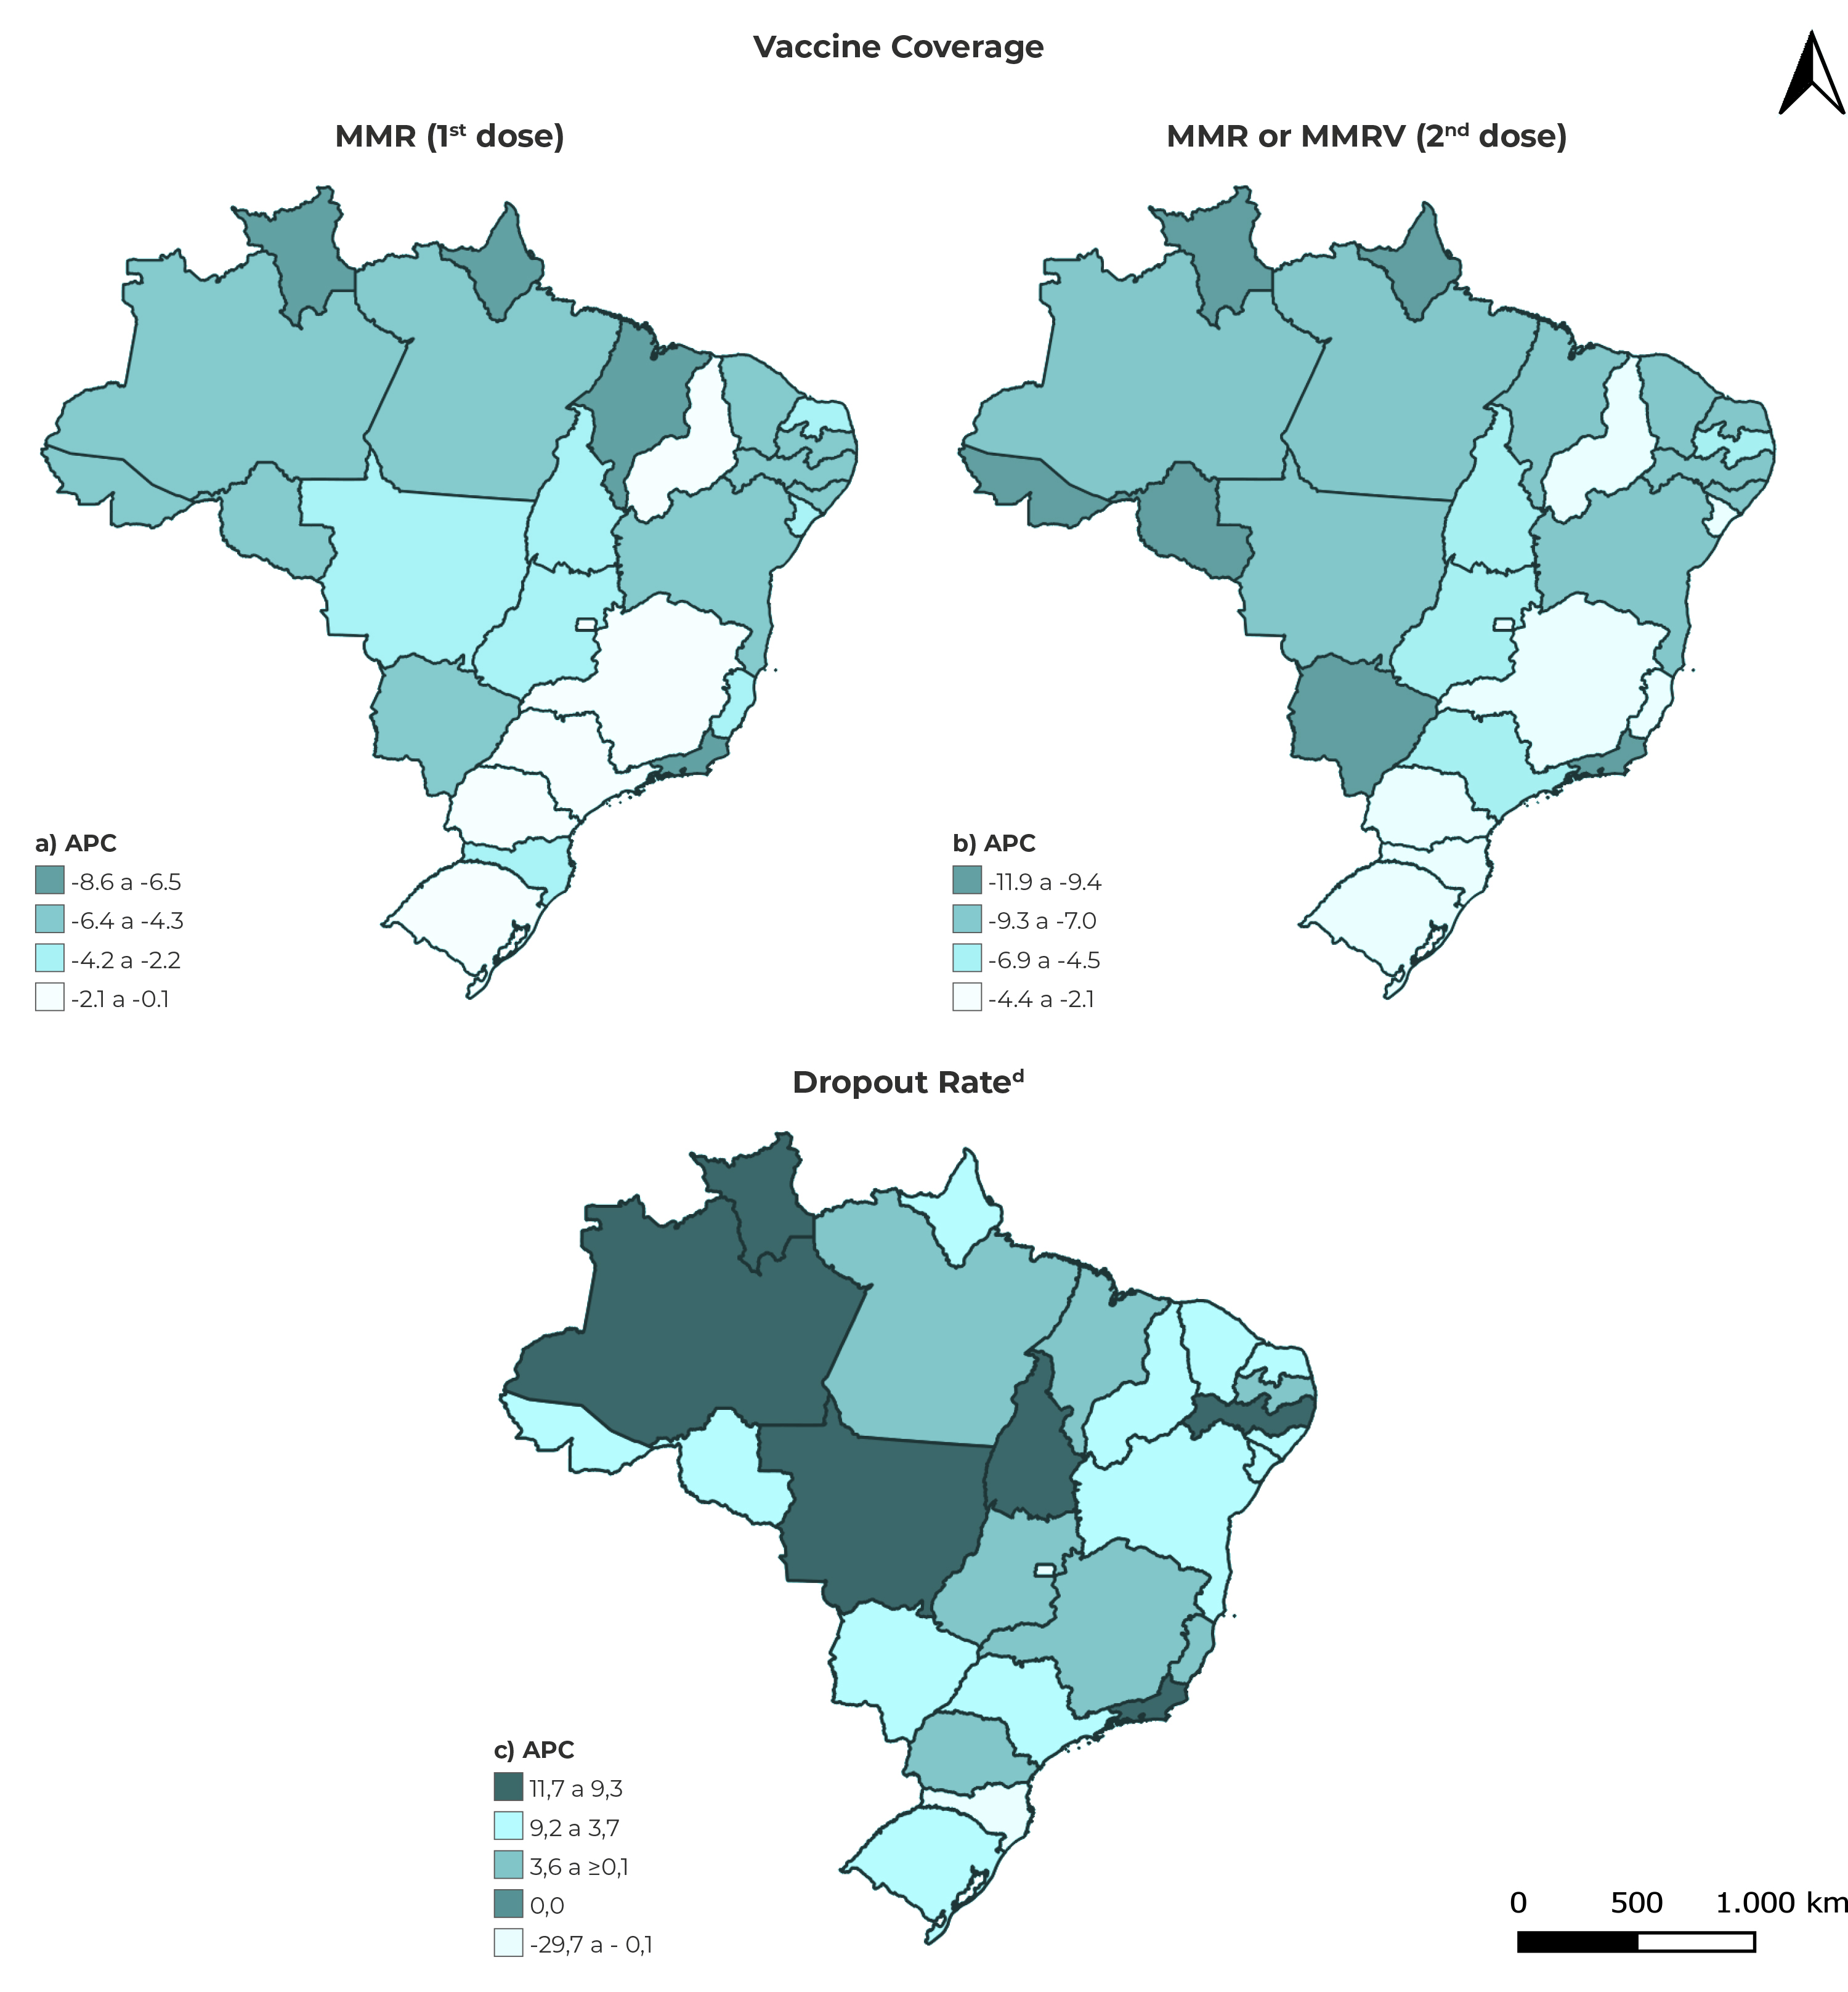
a), b) and c) ACP: Average change over the period. d) Dropout rate: Rate of vaccinated children that began but did not finish the schedule.
Figure 2 Spatial distribution of annual average percentage changes in immunization indicators and classification of the dropout rate trend in the Federative Units, Brazil, 2014-2021
DISCUSSION
In this study, coverage of both the first MMR vaccine dose and the second MMR dose - or its replacement with a dose of MMRV vaccine - decreased in Brazil as a whole, in the period selected for the study. The FUs, in particular, showed stationary or decreasing trends in vaccine coverage, either for the first or the second vaccine dose, over the period studied.
It should be noted that the temporal trend periods for second dose vaccination coverage were from 2014-2019 and 2019-2021 for all the Brazilian macro-regions. However, some FUs, such as Maranhão, Rio Grande do Norte, Bahia and the Federal District, differ from each other because their trend periods were 2014-2016 and 2016-2020, diverging from the periods applying to their respective macro-regions. These divergences point to the possibility of different factors interfering, at different times, in the vaccination coverage found.10
The dropout rate, indicative of the portion of the population that did not complete the vaccination schedule,15 had a stationary trend, both in Brazil as a whole and in all the country’s regions. The Northeast and Southeast regions had the same trend periods for the dropout rate (2014-2019 and 2019-2021), in relation to Brazil as a whole. Among the FUs, only Rondônia, Maranhão, Pernambuco, Sergipe, Bahia, São Paulo and Santa Catarina reported the same periods as Brazil and the Northeast and Southeast regions, in the temporal context of the study.
In the FUs with periods and trend behaviors different from their respective regions, heterogeneity can be seen within their regions, with regard to vaccination coverage and dropout rates.
Childhood vaccine coverage has made progress. However, in the period from 2010 to 2019, coverage of the third dose of DTP vaccine (diphtheria, tetanus and pertussis), the first dose of MMR vaccine and third dose of vaccine against poliomyelitis stagnated or decreased. Worldwide, 94 countries and territories (46%) recorded reductions in these coverage levels.
Global coverage of the first MMR vaccine dose stagnated at a level between 84% and 86% in the period 2010-2019, while coverage of the second MMR vaccine dose has increased from 42% to 71%, reflecting the introduction of the second dose in many countries.24
The second dose of the MMR and/or MMRV vaccine is not included in all vaccination schedules worldwide.24 In the case of Brazil, the inclusion of the second dose occurred in 2013 and its coverage remained below the target recommended by the National Immunization Program (< 95%) between 2014 and 2021.25
Heterogeneity of vaccination coverage of nine vaccines on the childhood schedule, among the Brazilian regions, is more prominent in the Midwest, where it was higher (90.6%), compared to the other regions of the country from 2015 to 2019. The FUs that make up the Northern region also showed temporal heterogeneity in the vaccination coverage of nine vaccines on the childhood schedule, with Rondônia standing out with the best coverage (100%) and Pará with the worst coverage (69.4%), also between 2015 and 2019.26
A study was conducted in Serbia on the temporal trends of mandatory childhood vaccination coverage between 2000 and 2017, using linear regression and joinpoint statistical methods. The linear regression revealed a significant drop in coverage of the first doses of poliomyelitis, DTP and MMR vaccines.
In the same period, coverage of all subsequent revaccinations decreased significantly.27
The impact of the COVID-19 pandemic contributed to an 84% reduction in global coverage of the first MMR vaccine dose, while coverage of the second MMR or MMRV vaccine dose remained stable, with average percentage values of 71% in 2019 and 70% in 2020, estimated based on recurring heterogeneity between the different regions of the world.28
High dropout rates are repeatedly found globally: in 2017, 6.2 million (31%) children started but did not complete the DTP vaccine schedule.29 It is noteworthy that high dropout rates can mean reduced herd immunity and increased of cases of vaccine-preventable diseases.15
The United Nations Development Programme reported that only 1% of the 10.7 billion doses of vaccines distributed worldwide were administered in low-income countries as at mid-2022. As such, the Immunization Agenda 2030 can not only help improve the quality of coverage estimates, but also help to identify and reach people needing to be vaccinated, including those from displaced and marginalized populations who are not being fully immunized in a timely manner.28),(29
Barriers to vaccine equity may be related to lack of credibility of the information and guidance provided by health authorities and health professionals regarding vaccination. “Fake news” decreases the population’s confidence in the health system and, in particular, with regard to vaccination actions and campaigns. However, as government policies expand the availability of vaccines and health professionals engage in the vaccination process, this process is strengthened, as is the health system as a whole.10
As for the limitations of this study, it is worth mentioning possible uncertainties/imprecision in the calculation of vaccination coverage, when the denominator used to calculate the rates includes population estimates that underestimate or overestimate the population under 1 year old, in addition to the insufficient number of observations analyzed. Moreover, constant changes in immunization information systems can lead to typing errors and information that is not migrated from one system to another and, consequently, underestimated vaccine coverage and an overestimated dropout rate.
This study makes progress by identifying temporal heterogeneity and periods of trends, in addition to differences in the geographical distribution of indicators, this being a form of analysis that should be incorporated into the routine of health services, in addition to addressing the dropout rate, which is an immunization indicator little discussed in the scientific literature.
We conclude that further studies are needed to characterize the spatial heterogeneity of MMR vaccine coverage and its dropout rate, as well as possibly associated factors. Furthermore, immunization services need to monitor temporal trends in vaccine coverage, with the aim of intensifying educational actions aimed at greater timely adherence by the population to vaccination.

