Serviços Personalizados
Journal
Artigo
Indicadores
-
 Citado por SciELO
Links relacionados
-
 Similares em
SciELO
Compartilhar
Boletim do Museu Paraense Emílio Goeldi Ciências Naturais
versão impressa ISSN 1981-8114
Bol. Mus. Para. Emilio Goeldi Cienc. Nat. v.1 n.2 Belém ago. 2006
Growth of trees and microclimates in a gap dependent forest in Central Amazônia
Crescimento de árvores e microclima em clareira florestal na Amazônia Central
Akio TsuchiyaI; Akira TanakaII; Niro HiguchiIII; Pedro Braga LisboaIV
IHiroshima University. Graduate School of Integrated Arts and Sciences. Department of Environmental Studies. Higashi-Hiroshima, Hiroshima, Japão (tsuchiya@hiroshima-u.ac.jp)
IICentro de Pesquisas Ecológicas da Amazônia. Manaus, Amazonas, Brasil (piquia@hotmail.com)
IIIInstituto Nacional de Pesquisas da Amazônia. Coordenação de Pesquisas em Silvicultura Tropical. Manaus, Amazonas, Brasil (liro@inpa.gov.br)
IVMuseu Paraense Emílio Goeldi. Coordenação de Botânica. Belém, Pará, Brasil (plisboa@museu-goeldi.br)
ABSTRACT
Forest inventory, stem core sampling, and meteorological observations were carried out in a dense tropical forest in Novo Aripuanã, Amazonas. In the research quadrat (1.9 ha), 210 woody species belonging to over 38 botanical families, and 14 palm species were identified. The aboveground biomass, which was estimated to be 202.72 t/ha, was standard for Amazonia, but the forest was considered to repeat regeneration by tree-fall gaps because early succession species such as Iryanthera ssp. (Myristicaceae), Croton sp. (Euphorbiaceae), and palms were large in number. The relationship between tree height and percentage of vessel area in stem cross sections in the 2001 and 2002 growth rings had a positive correlation coefficient. The enlargement of vessel area was to improve the efficiency for absorbing sap against gravity, which means that the increase in pore zone leads to weakening the resistance of stems against squalls. From meteorological measurements, it was found that diurnal downward short-wave radiation at forest canopy was a few times to several dozen times as large as that at forest floor, and in consequence, net radiation surpassed 600 w/m2 in the canopy, while it was about 30 w/m2 on the floor. The radiation balance in tree-fall gaps was similar to that of forest canopy, but the gaps were characterized to have a large temperature difference between day and night (12 to 13 oC). Radiative cooling easily condensed humid air when temperatures decreased to 27-28 oC, and the condensation each night amounted to 5-7 g/m3, about double that of closed forests.
Keywords: Central Amazonia. Tree-fall gap. Vessel parameters. Radiation balance. Microclimate.
RESUMO
O inventário florestal, a observação macroscópia do cerne das árvores e a observação meteorológica foram feitos na floresta primária de Terra Firme, no município de Novo Aripuaña, Amazonas. Nas parcelas de 1,9 ha, encontraram-se 210 espécies florestais pertencente a 38 famílias. A biomassa aérea foi estimada como 202.72 t/ha a partir do resultado do inventário, que são valores típicos da floresta amazônica. A alta freqüência das espécies de sucessão primária, como Iryanthera ssp. (Miristicaceae), Croton sp. (Euphorbiaceae) e palmeiras (Arecaceae), permite considerar que a floresta local sofre a com alta densidade de clareiras naturais. A relação entre a altura das árvores e a percentagem de área de vaso no corte transversal das árvores no período de 2001 e 2002 mostrou coeficiente de correlação positiva. O alongamento do diâmetro de vasos melhorou a eficiência de absorção de água contra gravidade, no entanto, isso pode diminuir a resistência física do indivíduo. A observação meteorológica mostrou que a radiação de onda curta diurna, no sentido do solo ao dossel da floresta, é cerca de dez vezes maior do que ao nível do solo da floresta fechada, tendo valor de radiação liquida de 600 w/m2 e 30 w/m2, respectivamente. O balanço da radiação dentro da clareira é parecido ao do dossel da floresta. Porém, a clareira possui alta variação de temperatura, que caracteriza grande diferença de temperatura entre dia e noite (12 a 13 oC), o que causa o esfriamento durante a noite. Com isso a temperatura atinge ponto de orvalho (27-28oC) e resulta condensação de 5-7 g/m3, que é aproximadamente valor dublo no caso da floresta fechada.
Palavras-chave: Amazônia central. Clareira natural. Parâmetro de vaso. Balanço de radiação. Microclima
INTRODUCTION
It is a fact that more than 12% of forests have already disappeared in the legal Amazon due to large-scale felling and burning for pasture developments (FEARNSIDE, 1996; INPE, 1997; CAPOBIANCO et al., 2001). The monitoring of vegetation restoration (HIGUCHI et al., 1998; UHL et al., 1998) and experiments dealing with forest utilization policies that may reduce environmental destruction (VAN LEUWEEN et al., 1997) had started in recent years. Species richness and biomass evaluation were investigated a step earlier from the 1970s (RADAMBRASIL, 1974, 1978), and details of forest structure in various places have been reported (GENTRY, 1986; BROWN; GILLESPIE; LUGO, 1989; WORBES, 1997). Small-scale forest disappearance by slash-and-burn agriculture, and the amount of tree felling for cash crop cultivation were surveyed (HIRAOKA, 1995). However, it is poorly understood as to how pioneer species are established in open space after tree-fall gaps, burning, or abandonment. How is the space restored to a normal forest with several strata? Physical explanations to these processes need to be delineated.
Trees do not grow unlimitedly higher. An efficient water conducting system is needed to transport water against gravity. Water potential has been discussed by many researchers (SCHULZE et al., 1985; FEBRUARY et al., 1995; LOVISOLO; SCHUBERT 1998), but the relationship between sap flow and extension growth of tropical species has been left untouched. This study aims to explain individual tree growth and the development of strata from vessel parameters, using Hagen-Poiseuille's Law. Competition and restoration in tree-fall gaps have been investigated in tropical regions (HARTSHORN, 1978; BROKAW 1987; UHL et al., 1988), but they are mainly based on ecological and forestry viewpoints. Light and temperature environments are considered with respect to the germination and establishment of seedlings (AUGSPRUGER, 1984; CHAZDON, 1988; VIANA, 1989; BONGERS; POPMA, 1990; ACKERLY; BAZZAZ, 1995; TANAKA, 1998), but there are few studies which analyze radiation balance (WHITMORE et al., 1993; CAMARGO; KAPOS, 1995). In closed forests, differences in solar radiation between canopy and forest floor reaches several dozen times. A forest floor is not blessed with solar radiation, and there is no diurnal fluctuation between day and night. Contrarily, in gaps and secondary forests, downward radiation infiltrates to forest floors. Lighting stress for small-sized individuals is eased. Measuring these components in a closed forest, tree-fall gap, and man-made gap to provide a physical scale for understanding vegetation restoration is the second purpose of this study.
STUDY SITE AND METHODS
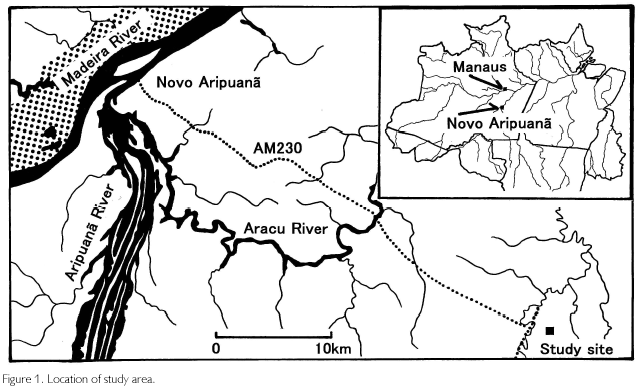
The study site is a terra firme forest in Novo Aripuana, Amazonas (Figure 1). A 100 km2 primary forest is conserved at a location about 40 km from Novo Aripuana city (5o18'S, 60o04'W), situated on a junction of the Madeira and Aripuana rivers. It is about 300 km southwest of Manaus, the capital of the state. According to vegetation classifications established by Athayde Bohrer and Gongalves (1991), the vegetation type is tropical alluvial dense forest, and RADAMBRASIL (1978) classified this region to be tropical flatland dense forests. Tanaka (1998) identified 163 woody species, and in particular, Scleronema micranthum (local name: Cardeiro), Cariniana micrantha (Tauari), Carapa guianensis (Andiroba), Peltogyne sp. (Roxinho), Eschweilera sp. (Ripeiro preto), Pouteria sp. (Abiurana), Swartzia sp. (Araba), Sclerolobium sp. (Faveira), Sclerolobium sp. (Taxi vermelho) were abundant in number. Tanaka pointed out that the succession was characterized to be gap dependent. The altitude is about 30 m, and the soil type is yellow latossol, which is rich in exchangeable aluminum but poor in nutrients. It covers about 15% of all Amazonia, and originates from sandy or silt sediments during Quaternary to Tertiary (SOUZA, 1991). Concerning climate, annual mean temperature is 26o, rainfall is 2.750 mm, and relative humidity is 85%. Climate type by Koppen is Af, but a weak dry season exists from June to August (monthly rainfall<100 mm). During December to April, rainfall exceeds 300 mm a month (SUDAM/PHCA, 1984).
Fieldwork was carried out in March 2002, but meteorological measurements were also conducted in August 2001. Heights of trees and palms, diameters at breast heights (D), widths of canopies, the heights of the lowest leaf layers, and locations of tree-fall gaps were measured. Sky-view photos were taken using a fish-eye lens (Sigma F4-8mm), and leaf samples of every species were collected in a quadrat of 1.9 ha. Trees with D smaller than 5 cm were excluded. A pole measure was used in tree height measurements, but a laser meter (Bushnell LRS600) was used when a tree was higher than 15 m and when measuring the lowest leaf layer. D was measured using a diameter tape, and canopy width was measured in the long and short axes using a measure. Species were identified in a herbarium of INPA, referring to leaf samples and local names. Also, stem core samples were obtained using an increment borer (Fujiwara 20 cm). When it did not insert to stems due to hardness, wedge-shaped samples were taken using a saw. In total, 240 samples were obtained, but because barks were separated from woods in some cores, 218 samples from over 65 species were utilized for analysis. They were brought to a laboratory alter receiving a permit from IBAMA (National Institute of Renewable Natural Resources). They were mounted on a rectangular piece of wood (25x25 mm) with a ditch (width: 4 mm, depth: 3 mm) using a bond, and alter drying a couple of days, they were polished using a grinder (Nichika RG5) to which sand paper was attached.
Number 100 was used first as mesh size. Then, mesh size was changed to finer types-from number 400 to 2,000 for completing the polishing. Wedge-shaped chips were also polished in the same way. Images of the 2001 and 2002 growth rings were transferred into a computer via a CCD camera (Tokyo Electric Industry CS5510) mounted on a measure scope (Nikon MM22), and only vessels were extracted using image analysis software (Mitani Mac Scope 2.5) to measure the numbers and diameters of vessels, and the percentage of vessel area in the range of interest (ROI), which was about 5.6 mm2 because x5 was used as an object lens. When a growth ring was larger, image input was repeated several times. Also, using x1 objective, vessel type such as diffused, radial, and tangential arrangements, vessel distribution such as solitary pore or radial pore multiple, and parenchyma type such as paratracheal and apotracheal parenchyma were observed. Ten sky-view photos taken in each of the following four sites were employed in estimating percentage of sky, and these images were input into a computer through a projection stand (SFC FLV80).
Meteorological measurements were conducted in two closed forests, one tree-fall gap, and one man-made gap during March 5 to 18, 2002. The date of measurement was different among the sites because there was only one set of equipments. In a closed forest which is named PRI, measurements were conducted during March 5 to 8, mainly to know radiation balance at canopy layer, fixing a net radiometer (Eiko MR40), a thermo-hygrometer (Hioki Type 3641), and a PAR sensor (Koito IKS25) to the height of 35 m of a giant tree (Copaifera sp.) whose height is 38 m. The parameters measured were downward and upward short- and long-wave radiations (SWdown, SWup, LWdown, LWup), dome temperatures of both sides of radiometer (DTdown, DTup), temperature and relative humidity (T, H), and photosynthetically active radiation (PAR). Data were automatically stored to data loggers every 10 minutes. T, H, and PAR were measured at 20 m and 1 m heights as well. On ground level, two soil heat plates were buried to measure soil heat flux (G). Also, platinum resistance thermometers were installed in four depths in soil (1, 5, 20, and 40 cm) to monitor soil temperatures (TS). In the second site of a closed forest (FLO), whose measurements were conducted during March 9-11, radiation components were measured at the height of 1 m, while T, H, and PAR were measured at two heights (20 cm and 1 m). G and TS measurements were the same as those in PRI. Likewise, in a tree-fall gap with an area of 20x25 m (GAP) and in a man-made gap with an area of 20x100 m (ENR), which was out of the research quadrat, and was opened for enrichment afforestation experiments, measurements were continued during March 12 to 14 and 15 to 18, respectively. Also, daily rainfall was observed using a portable rain gauge.
RESULTS
Forest inventory
From forest inventory in 1.9 ha, 1.938 tree individuals comprising over 38 botanical families and 210 species (D<5 cm: excluded), and 1,064 palms from over 14 species were found. As for trees, 144 further individuals were found, but could not been identified. Botanical families with more than 100 individuals were Leg. Mimosoideae (the number of individuals: 203), Sapotaceae (178), Lecythidaceae (164), Leg. Caesalpinioideae (142), and Annonaceae (125). Among 210 species, Chrysophyllum prieurii of Sapotaceae (local name: Abiurana vermelho, 68), Protiumsp. (Burseraceae, Breu branco, 63), Couepia bracteosa (Chrysobalanaceae, Pajurá, 47), Eschweilera odora (Lecythidaceae, Matamatá branco, 46), Landenbergia sp. (Rubiaceae, Canela de velho, 45), Ingaparaensis(Leg. Mimosoideae, Ingarana, 44), Micropholis venulosa (Sapotaceae, Abiurana branca, 42), and Neer sp. (Nyctanginaceae, João mole, 40) had more than 40 individuals each. Palm species Orbignya phalerata (Babaçu, 382), Mauritia aculeate (Caranai, 279), Geonoma sp. (Perema), and Astrocaryum murumuru (Murumuru, 130).
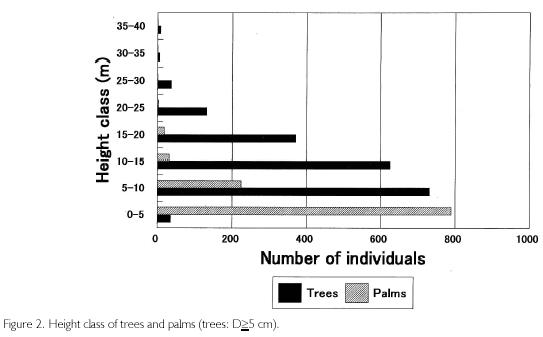
Height class is shown in Figure 2. Trees reached the 35 to 40 m class, and palms were up to the 20 to 25 m class, but these individuals were few in number. The largest frequency appeared in the 5 to 10 m class for trees and in the 0 to 5 m class for palms, one step lower than trees. In the figure, it seems that the lowest forest space is occupied by palms, but if trees of D<5 cm are included, they must concentrate in the same 0 to 5 m class. Palms have a high demand for light, and most of them were concentrated in 15 tree-fall gaps distributed in the quadrat.
Aboveground biomass was estimated using the allometric equation proposed by Higuchi et al. (1 994). It is composed of two equations dependent on D: ln(FW) = -2.4768 + 2.2301 • ln(D) + 0.6518 • ln(TH) (5≤D<20 cm) and ln (FW) = -3.8102 + 1.4631 • ln(D) + 1.8190 • ln(TH) (D≥20 cm). Here, FW: fresh weight (t), D: DBH (cm), TH: tree height (m). Dry weight (DW, t) is estimated from DW=0.604 • FW. In most cases (95.1% of all the individuals), the individual biomass was smaller than 1 t, but there were four individuals over 10 t. The total biomass was 202.72 t/ha.
Vessel parameters
The 218 stem samples are equivalent to 11.2% of all the individuals, and 65 species are 30.4% of all the species identified in the quadrat. Elements of stem cross section of hardwood species are composed of vessels, fibers, axial and radial parenchyma. Concerning vessel arrangement, 172 samples had diffused, 43 had radial, and three had tangential arrangements. When classifying the species with regard to radial distribution of vessels, 35.8% were radial pore multiple, and 64.2% were solitary pore. Classifying 139 species described by Loureiro, Freitas, J. e Freitas, C. (1997), Loureiro et al., (2000) and SUDAM (1981), 30.2% were radial pore multiple, and 69.8% were solitary pore. Both classifications were similar to each other, but there is subjectivity involved in distinguishing radial pore multiples from solitary pores. When classifying with respect to whether parenchyma was independent from vessels or enclosed vessels, apotracheal parenchyma was 53.7%, and paratracheal parenchyma was 46.3%. This is an objective classification, but the results were different from those described in the above-mentioned references (apotracheal: 34.5%, paratracheal: 65.5%).
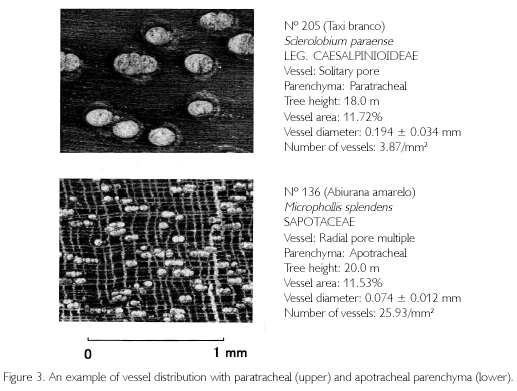
Figure 3 shows an example of diffused arrangement of solitary pores with aliform paratracheal parenchyma (upper part of the figure: Sclerolobium paraense, Leg. Caesalpinioideae). The lower one is an example of radial pore multiple with scalariform apotracheal parenchyma (Micropholis splendens, Sapotaceae). Tree height (TH) of both individuals is commonly 18 to 20 m, and percentages of vessels (VA) are similar to each other (11% level). However, vessel diameter of S. paraense is 0.194 mm, while that of M. splendens is 0.074 mm, distribution density is also greatly different (3.87 to 25.93/mm2). S. paraense has large-sized vessels but a low distribution density, while M. splendens has small-sized vessels with a high density.
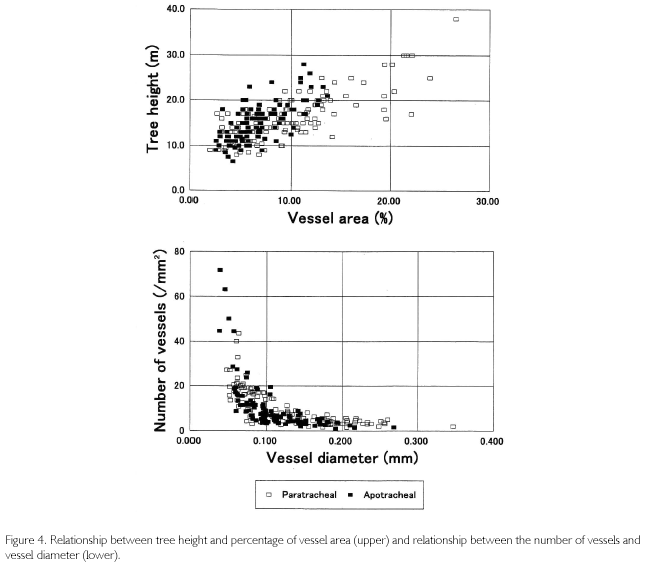
The relationship between TH and VA shown in the upper part of Figure 4 has a positive correlation, known as Hagen-Poiseuille's Law in that trees enlarge VA to increase the efficiency for absorbing water from underground (ZIMMERMANN, 1983; CALKIN; GIBSON; NOBEL, 1986; TYREE; EWERS, 1991). In the Figure 4, VA is less than 10% when the height is smaller than 10 m, whereas it exceeds 20% in individuals over 30 m high. This is a comparison among individuals, but even in the same individual, VA% is kept low when the tree is small, but it rises as the tree grows higher. The lower part of Figure 4 shows the relationship between the number of vessels (/mm2) and the vessel diameter. It was regressed in an exponential function. An individual with a large-sized vessel diameter tends to have a low distribution density, but in contrast, an individual with a small-sized diameter has a high distribution density. In both figures, individuals with paratracheal parenchyma are indicated in white squares, and individuals with apotracheal parenchyma are indicated in black squares. It seems that the regression curve is slightly different between the two types of parenchyma. Individuals of apotracheal type, for example, were biased to the upper-left in the upper figure, while individuals of paratracheal type extended to the lower-right side in the lower part of the figure.
Using these relationships, vessel parameters of all the individuals found in the quadrat were estimated. Estimations were conducted in three patterns: using all individuals, using the individuals of paratracheal parenchyma, and using the individuals of apotracheal parenchyma. First, when using all individuals together, the regression equation between TH and VA is as follows: TH = 0.7708 • VA+9.3126 (R2=0.5174). The number of vessels (N) and vessel diameters (D) were regressed in the following equation: N = 0.3126-D-1.4375 • (R2 = 0.6745). Here, VA is almost synonymous with the product of N and D2. Actually, VA and N • D2 had a high correlation coefficient: N • D2=0.0107 • VA+0.0125 (R2=0.8013). VA of all the individuals was estimated from tree heights Then, D was calculated from the third equation, substituting the second equation with the third one. Finally, N was estimated from the second equation. However, the range of applicable estimation is dependent on tree heights. Because the average height is 15.8 m, and the standard deviation is ±4.8 m, if ±1δ is allowed as the range, it is limited to from 20.6 to 11.0 m, which is equivalent to 51.1% of all the numbers of individuals. As a result, as shown in Figure 5 (medium line), the maximum VA was estimated to be 13.87%, the minimum one was 2.19%, D was from 0.306 to 0.021 mm, and N was from 1.71 to 79.29 (/mm2). In the figure, individual trees were sorted by height (upper-left of the figure). VA changes with TH, and D also varies in the same phase, but N is in inverse proportion to them, meaning that trees thicken vessel diameter with extension growth to increase efficiency for transporting sap up to the leaf layers.
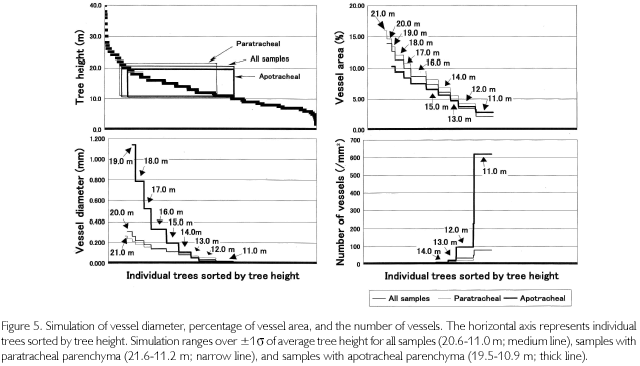
Next, limiting samples to paratarachel parenchyma (n=117), vessel parameters were simulated. The above-mentioned regression equations are as follows: TH = 0.7702 • VA+8.7384 (R2=0.5889), N = 0.4397 • D-1.3236 (R2 = 0.6792), and N • D2 = 0.0101 • VA+0.0184 (R2=0.7403). The range of tree heights, which is applicable to simulation, is from 21.6 to 11.2 m. It covers 44.1% of all the individuals in the quadrat. As marked in narrow line, it was found that when VA changes from 15.92 to 3.59%, D changes from 0.265 to 0.046 mm, and N changes from 2.55 to 26.16 (/mm2).
When limited to individuals of apotracheal parenchyma (n=101), regression equations are as follows: TH=1.0693 • VA+7.9800 (R2=0.4554), N = 0.1356 • D-1.7532 (R2 = 0.7365), and N • D2 = 0.0132 • VA+0.0041 (R2 = 0.9396). Considering the applicable range of tree heights (19.5-10.9 m), which covers 48.7% of all the individuals, VA was estimated to change from 10.31 to 2.82%, D was from 1.143 to 0.008 mm, and N was from 0.11 to 619.86 (/mm2) as indicated in thick line.
Radiation balance and microclimate
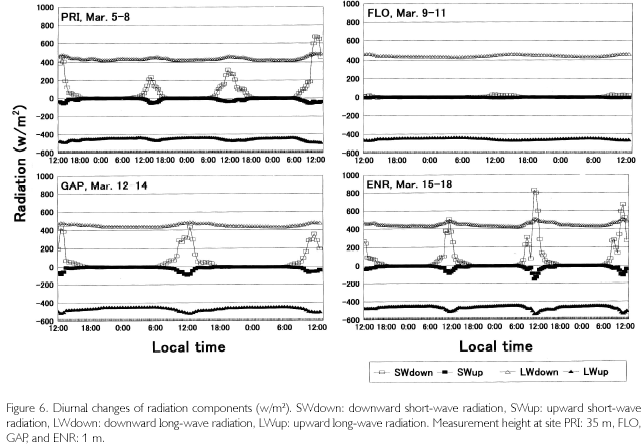
Meteorological parameters were measured in four sites (PRI, FLO, GAP, ENR) during March 5 to 18, 2002. The area of GAP (20x25 m2) is a medium one among 15 tree-fall gaps in the quadrat, and ENR is a strip-like narrow vacant lot opened for enrichment experiments (20x100 m2). Diurnal changes of radiations in the four sites are shown in Figure 6. Data are plotted every 30 minutes after employing a one-hour moving average. Longwave radiation was revised by means of adding δ. T4 (δ Stefan-Boltzmann constant, T: dome temperature (oC) + 275.15K) to output data. Although the measurement period is different among sites, the daily maximum downward short-wave radiation (SWdown) was 200-600 w/m2 at the height of 35 m in PRI, almost zero at the forest floor in FLO, about 400 w/m2 in GAR and 250-800 w/m2 in ENR. The difference among sites is influenced by the area which receives SWdown (percentage of the area of sky: sky-view factor). Sky-view photos were taken 10 times in each site where a net radiometer was set, and sky-view factor was calculated by image analysis. It was 31.4±4.9% in GAR 10.3±2.0% in FLO, 40.7±5.6% in ENR, and 52.1±8.9% in PRI. Even in the same site, SWdown changed according to the weather. When it was a fine day like March 8, the maximum value passed 600 w/m2 in PRI. It was cloudy during March 6 and 7. There was a squall during March 12 to 14, and the amount of rainfall was 40 mm, 60 mm, and 45 mm, respectively. In ENR, there was a 25 mm shower at 14:00 on March 15, and a 10 mm shower at 11:00 on March 17. The larger SWdown is, the larger SWup becomes. SWup was observed in ENR, GAR and PRI with an open space, but it was almost zero in FLO. Downward and upward long-wave radiation levels were almost constant in FLO throughtout each day  while |LWup| tended to be slightly larger than |LWdown| in the other three sites during nighttime. Photosynthetically active radiation (PAR), which has a wavelength from 400 to 700 nm, had the same phase as SWdown. It was 500-1,70 µE/s•m2 at 35 m high of PRI, 1,000-1,700µE/s•m2in GAP and 500-1,700 µE/s•m2 in ENR, but it was almost zero in both FLO and on the forest floor in PRI.
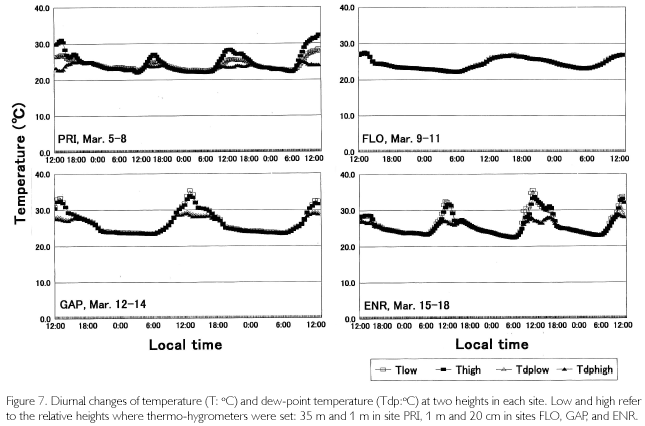
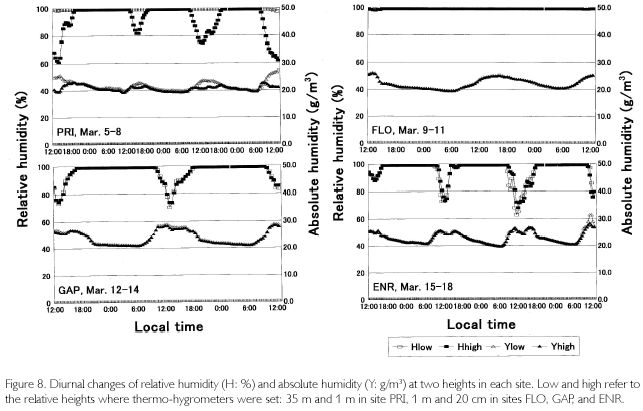
As is shown in Figure 7, temperatures (T) exceeded 30 oC where direct sunlight infiltrated in GAP ENR, and sometimes at the height of 35 m in PRI. Near the soil surface, T was basically higher in GAP and ENR. During cloudy and rainy hours, it dropped below 30oC. This was seen in FLO and on the forest floor of PRI, too. Minimum temperatures were commonly 23-24 oC, and were recorded at dawn. Diurnal temperature fluctuation was larger in open sites such as GAP and ENR (12-13 oC), whereas it was about 4-5 oC in FLO. During fine weather, relative humidity (H), shown in Figure 8, decreased to 6080% in daytime at the height of 35 m high in PRI, GAP and ENR, but when there was rain, it became 100% even in daytime. At nighttime, it was basically 100% during all times. On the forest floor of PRI and FLO, it was 100% throughout each day. Dew-point temperatures (Tdp: oC) shown in Figure 8 were calculated as follows. First, saturated vapor pressure (ES: mb) was calculated from the Goff-Gratch's equation described below: log10ES = 10.79574•(1-Ti/T)-5.02800•log10(T/Ti) + 1.50475•10-4{1-10-8.2969?(T/Ti-1)} + 0.42873•10-3•{104.76955?(1-Ti/T)_1}+0.78614 (Ti: triple-point temperature of water (273.16K), T: absolute temperature (oC+273.15K)). Then, vapor pressure (E: mb) was calculated from ES•H/100, and alter converting units to kg/cm2, Tdp was calculated as in this equation: Tdp = 98.0416+26.5184•ln(E)+1.7479•(ln(E))2+0.0645•(ln(E))3. Tdp is a temperature at which water vapor is condensed, and depends on both temperature decrease and the amount of water vapor in the air. In every site, T overlapped with Tdp until 18:00, but in ENR they overlapped at about 15:00 on March 15 and 16. Tdp was 25 oC in PRI, and was a little higher (27-28 oC) in GAP and ENR. The relationship between T and Tdp was T>Tdp during daytime. The time when T became higher than Tdp was the earliest in ENR, GAP is the next, and the last one was in PRI at heights of 35 m. In the evening as well, T became equal to Tdp, overlapping first in ENR, next in GAP and last in PRI at 35 m. On the forest floor of PRI and FLO, T was equal to Tdp throughout each day. As condensation progresses at H=100% and T=Tdp, dewdrops are formed on surface ground or leaves, and the amount of water vapor in the air decreases. Water vapor is evaluated by absolute humidity (Y:g/m3): Y=217•E/T. In Figure 8, Y greatly decreased in the evening, kept decreasing gradually in nighttime, and changed into a rise in daytime because dew evaporated as a result of solar radiation and temperature increases. The minimum value was commonly 20 g/m3 among the sites, but the maximum one was different and there was a case in ENR that passed 30 g/m3 (March 18). A difference was found in the diurnal fluctuation, too. That is, it was 10 g/m3 in GAP and ENR, while it was 5-7 g/m3 in PRI and FLO. The nighttime decrease was a little steeper in ENR. Decrease in Y is regarded as the the amount of condensation in a night. It was large in GAP and ENR (5-7 g/m3), and was about 3 g/m3 in PRI.
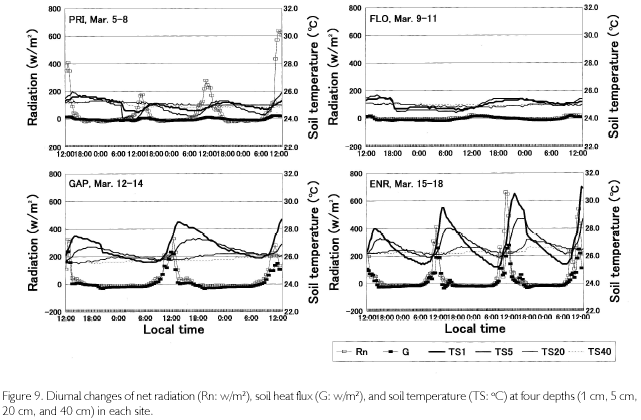
The bowen ratio (β), which is a ratio between sensible and latent heat fluxes, greatly fluctuated in daytime except for in FLO, but basically |β| was less than 1.00, meaning that sensible heat surpassed latent heat flux. In nighttime, β was stable around 0.40, but tended to slightly increase until dawn because more energy was used for temperature decrease as vapor pressure decreased with the rise in condensation. It is not possible to calculate the fluxes from β because the fetch is too short in a forest. However, when the net radiation (Rn = (SWdown + LWdown)-(SWup + LWup)) and soil heat flux (G) are figured, differences among sites are found (Figure 9). In PRI, G is suppressed quite small because radiations were measured at the height of 35 m, while G was measured at the soil surface. In FLO, radiation parameters were almost zero because they were measured at the forest floor, and G was also zero. GAP and ENR are similar in that the distribution to G was conspicuously large (200300 w/m2) because there is little coverage above the sites. In the nighttime, G remained minus, which means that a weak radiative cooling took place. It is recognized from soil temperatures, too, as shown in TS in Figure 9. Temperatures at the depth of 1 cm (TS1) gradually decreased after reaching the peak at 14:00-15:00, and after sunset TS1 became lower than TS5. This means that direction of heat flux was upward. The daytime trend was in a reverse manner; heat flux directed downward, the diurnal fluctuation being about 5 oC at TS1 and about 3 oC at TS5 in ENR. There was a two-hour phase difference between the two depths. Neither diurnal fluctuation nor phase difference was found as the depth became deeper, such as at TS20 and at TS40. Although diurnal fluctuation was found in PRI and FLO as well, it was less than 2 oC.
DISCUSSION
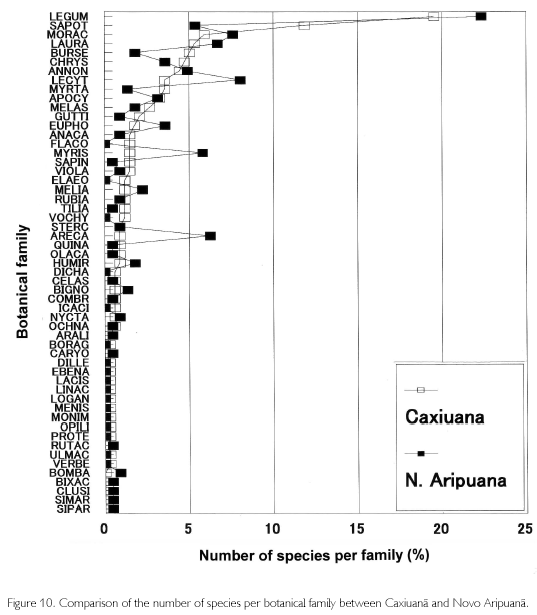
Since the 1970s, forest inventories have been carried out in the whole Amazonia to accurately evaluate forest resources. Almeida, Lisboa and Silva (1993) reported that the number of botanical families was 30-47, species was 84-265, and the number of individuals over 10 cm in D was 315-594/ha. Also, they described that biodiversity in Caxiuana National Park, located in western Para state, was outstanding because 50 botanical families, 338 species, and 610 individuals with D of 10 cm or more were found in a hectare base. Aboveground biomass of primary forests was summarized to range from 90 to 397 t/ha by Brown, Gillespie and Lugo (1989), 215±61.7 t/ha by Fearnside (1987), and 228 t/ha by Higuchi et al. (1998). The area surveyed of these inventories differs from 1.0 to 4.0 ha, but the results of this study (39 botanical families and 224 species, including Arecaceae) are obviously smaller than those in Caxiuana, but bear comparison with the other inventories, including biomass (202 t/ha). According to the number of species per family, however, characteristics of Novo Aripuana can be found. Figure 10 shows percentages of the number of species per family in Caxiuana and Novo Aripuana, in which families are sorted into numbers of species appearing in Caxiuana. It is found that Novo Aripuana has high percentages of Myristicaceae and Arecaceae. The percentage of Euphorbiaceae is also a little higher than that of Caxiuana. Contrarily, Lecythidaceae, Burseraceae, Myrtaceae, and Guttiferae, which appear frequently in closed forests, have few species except for Lecythidaceae. Flacourtiaceae, Elaeocarpaceae, and Vochysiaceae are also known as botanical families of closed forests, but they do not exist in Novo Aripuana. The number of individuals of Protium sp. (Burseraceae) is large, but the number of species of Burseraceae is less than half that in Caxiuana. Generally, the genus Iryanthera of Myristicaceae, genus croton of Euphorbiaceae, as well as palm species are more frequent in early stages of forest succession. Also, when comparing the number of palms (D≥10 cm), it is 6.1% of total numbers of trees and palms in Caxiuana, while palms are double the percentage, at 12.7%, in Novo Aripuana. From these circumstances, the Caxiuana is regarded to be a stable primary forest, while the Novo Aripuana is in a dymanic equilibrium, repeating tree-falls and restoration.
Vessel parameters estimated from samples obtained can be simulated (Figure 6). It does not really happen that all trees equally have paratracheal or apotracheal parenchyma, and there is no possibility that 620 vessels are concentrated in 1 mm2, or that vessel diameter exceeds 1 mm. However, there is no doubt that trees enlarge vessel diameter as they grow higher. Tsuchiya and Hiraoka (2002) pointed out that a primary forest and a secondary forest in an early stage of forest succession, which was investigated near Parintins in Amazonas state, had a different regression curve between TH and VA. From a comparison of three secondary forests with different ages in Caxiuana National Park, Tsuchiya et al. (2002) reported that VA increased as the canopy layer rose. While remaining near forest floors, trees do not need to increase efficiency of water absorption, but it means that they are destined to wither due to lack of light. Small trees have to depend on sunflecks, which are sunlight filtering through the trees, or make new stems sprout even though original stems die. In fact, shade-tolerant species exist in Amazonia, such as Cupania hubiginosa, Cupania ribiginosa of Sapotaceae, and Poecilanthe effusa of Leg. Papilionoideae. However, even in closed forests, once a tree-fall gap is formed, the lighting environment is improved, and growth of trees accelerates. For example, most seedlings which germinate in closed forests in the dry season die because of lack of light; seedlings can establish themselves only in tree-fall gaps. On the other hand, trees which have reached the canopy height can enjoy sufficient light regardless of gaps, but the extension growth is not guaranteed unlimitedly. The issue concerning increases in VA% is an example. Among samples obtained, there was an individual whose TH was 38 m, and VA was 27%. Expansion of vessel area is appropriate for conducting more water, but this brings a decrease in supporting stem strength because the ratio of fibers relatively decreases. As a tree pokes up out of the canopy layer, it comes to be easily influenced by wind, and raises the possibility of falling down.
In the past, micrometeorological observation in Amazonian forests often dealt with cumulative temperatures in relation to germination, and photosynthetically active radiation associated with photosynthesis of seedlings. There have been few studies concerned with radiation balance except for Marques Filho (1997) and Marques Filho and Dallarosa (2000) measured short-wave radiation, focusing on the vertical absorption and scattering in closed forests. Sink and sources of CO2 along with characteristics of soil respiration, are now intensively investigated (PHILLIPS et al., 1998; DAVIDSON et al., 2000), but their purposes and methods are both different, and other studies aim to anticipate the variation of CO2concentration caused by forest disappearance in Amazonia (FEARNSIDE, 1996; FEARNSIDE; GUIMARÃES, 1996; HOUGHTON et al., 2000). In the present study, there was not a large difference in LWdown between PRI and FLO, but several to several dozen times of differences were found in the daytime SWdown. A small amount of SWup was observed in PRI, but it was zero in FLO. Also, LWup was a little PRI>FLO. As a result, Rn amounted to 150 w/m2 (cloudy day) to more than 600 w/m2 (sunny day) in PRI, while it was limited to about 30 w/m2 in FLO. For understory individuals, the 30 w/m2, which is supplied as sunfleck, is too small to survive unless they arrive at canopy layer. On the other hand, sufficient Rn, which was equivalent to that at the height of 35 m in PRI, was observed in GAP and ENR. Sky-view factor was a little different such as 31% in GAP 41% in ENR, and 52% in PRI, but there were relatively few areas of coverage in the zenith of GAP and ENR, while leaves and branches covered the above in PRI. No site differences were found in the minimum temperatures, but the maximum temperatures were a little higher in GAP and ENR than they were in PRI. Therefore, diurnal difference was larger in GAP and ENR; in particular, temperature decrease during nighttime was obvious in ENR. The drop easily condensed humid air of the rainy season at Tdp=27-28 oC, a little higher than that at a height of 35 m in PRI (Tdp=25 oC). In the former two sites, both the time when condensation started and ended was earlier than that in PRI. Also, the amount of condensation each night was 5 to 7 g/m3 in GAP and ENR, and it was larger than 3 g/m3 in PRI. These results in GAP and ENR are caused by the fact that open space exists on the ground surface. The air above open space is easily warmed by direct radiation in daytime, and is easily cooled by radiative cooling. A large fluctuation of G or TS originates in such an open space. In closed forests with thick vegetation such as PRI, on the other hand, Rn is not distributed to G so much. It is because the input energy is converted to sensible and latent heat fluxes as explained by Marques Filho and Dallarosa (2000).
When a tree-fall gap is formed, SWdown or Rn is suddenly improved, and it provides better environments for trees which have been stressed. With respect to heat balance, there is the possibility that the increase in G or TS during daytime accelerates germination. But an antithesis exists; when soil surface is covered, soil is hard to dry, and squall-like intensive rains are blocked, whereas in gaps squall directly reaches soil surface in the rainy season, and evaporation decreases soil water in the dry season. These environmental factors are complicatedly related, and palms or pioneer species establish in gaps. Future research goals include comparing vessel parameters of the same individual tree before and after gap formation, investigating changes in vessels after a gap closes, measuring microclimatic mitigation effects in several gaps with different sizes, and comparing radiation/heat balance between rainy and dry seasons more precisely.
ACKNOWLEDGEMENTS
This study was financially supported by Mazda Foundation, Hiroshima University Foundation, and Asahi Beer Science Promotion Foundation. We appreciate local workers who assisted our fieldwork.
REFERENCES
ACKERLY, D. D.; BAZZAZ, E. A. 1995. Seedling crown orientation and interception of diffuse radiation in tropical forest gaps. Ecology, v. 76, p. 1134-1146.
ALMEIDA, S. S.; LISBOA, P. L. B.; SILVA, A. S. L. 1993. Diversidade florística de uma comunidade arbórea na estação científica Ferreira Penna em Caxiuanã (Pará). Boletim do Museu Paraense Emílio Goeldi, série Botânica, v. 9, p. 93-128.
ATHAYDE BOHRER, C. B.; GONÇALVES, L. M. C. 1991. Vegetação. In: GEOGRAFIA do Brasil, Região Norte. Rio de Janeiro: IBGE. p. 137-168. v. 3.
AUGSPRUGER, C. K. 1984. Light requirements of neotropical tree seedlings: a comparative study of growth and survival. Journal of Ecology, v. 72, p. 777-795.
BONGERS, F.; POPMA, J. 1990. Leaf dynamics of seedlings of rain forest species in relation to canopy gaps. Oecologia, v. 82, p. 122-127.
BROKAW, N. V. L. 1987. Gap-phase generation of three pioneer species in a tropical forest. Journal of Ecology, v. 75, p. 9-20.
BROWN, S.; GILLESPIE, A. J. R.; LUGO, A. E. 1989. Biomass estimation models for tropical forests with applications to forest inventory data. Forest Science, v. 5, p. 881-902.
CALKIN, H. W.; GIBSON, A. C.; NOBEL, P. S. 1986. Biophysical model of xylem conductance in tracheids of Fern Pteris vittata. Journal of Experimental Botany, v. 37, p. 1054-1064.
CAMARGO, J. L. C.; KAPOS, V. 1995. Complex edge effects on soil moisture and microclimate in central Amazonian forest. Journal of Tropical Ecology, v. 11, p. 205-221.
CAPOBIANCO, J. P. R. et al. 2001. Amazônia legal brasileira, cartografia temática. In: BIODIVERSIDADE na Amazônia Brasileira. São Paulo: Estação Liberdade. p. 353-385.
CHAZDON, R. L. 1988. Sunfecks and their importance to forest understory plants. Advances in Ecological Research, v. 18, p. 2-54.
DAVIDSON, E. A. et al. 2000. Effects of soil water content on soil respiration in forests and cattle pastures of eastern Amazonia. Biogeochemistry, v. 48, p. 53-69.
FEARNSIDE, P. M. 1987. Summary of progress in quantifying the potential contribution of Amazonian deforestation to the global carbon problem. In: WORKSHOP Proceedings on Biogeochemistry of Tropical Rain Forests: problems for research. Piracicaba: [s.n.]. p. 75-82.
FEARNSIDE, P. M. 1996. Socio-economic factors in the management of tropical forests for carbon. In: APPS, M.; PRICE, D. (Ed.). Forest Ecosystems, Forest Management and the Global Carbon Cycle. Berlin: Springer. p. 349-361.
FEARNSIDE, P. M. 1996. Amazonian deforestation and global warming: carbon stocks in vegetation replacing Brazil's Amazon forest. Forest Ecology and Management, v. 80, p. 21-34.
FEARNSIDE, P. M.; GUIMARÃES, W. M. 1996. Carbon uptake by secondary forests in Brazilian Amazonia. Forest Ecology and Management, v. 80, p. 35-46.
FEBRUARY, E. C. 1995. Relationships between water availability and selected vessel characteristics in Eucalyptus grandis and two hybrids. IAWA Journal, v. 6, p. 269-276.
GENTRY, A. H. 1986. An overview of neotropical phytogeographic patterns with an emphasis on Amazonia. In: SIMPÓSIO DO TRÓPICO ÚMIDO FLORA E FLORESTA.,1., Anais... Brasília: EMBRAPA/CPTU. p. 19-35. v. 2.
HARTSHORN, G. S. 1978. Tree falls and tropical forest dynamics. In: TOMLINSON, P. B.; ZIMMERMANN, M. H. (Ed.). Tropical Trees as Living Systems. London: Cambridge University Press. p. 617-638.
HIGUCHI, N. et al. 1994. Aboveground biomass estimate for Amazonian dense tropical moist forest. Memoirs of Faculty of Agriculture,Kagoshima University, v. 30, p. 43-54.
HIGUCHI, N. et al. 1998. Pesquisas Florestais para a Conservação da Floresta e Reabilitação de Áreas Degradadas da Amazônia. Manaus: INPA. 264 p.
HIRAOKA, M. 1995. Land use changes in the Amazon estuary. Global Environmental Change, v. 5, p. 322-336.
HOUGHTON, R. A. et al. 2000. Annual fluxes of carbon from deforestation and regrowth in the Brazilian Amazon. Nature, v. 403, p. 301-304.
INPE. 1997. Deflorestamento 1995-1997 Amazônia. São José dos Campos: INPE. 24 p.
LOUREIRO, A. A.; FREITAS, J. A.; FREITAS, C. A. A. 1997. Essências Madeireiras da Amazônia. Manaus: INPA. 103 p. v. 3.
LOUREIRO, A. A. et al. 2000. Essências Madeireiras da Amazônia. Manaus: INPA. 191 p. v. 4.
LOVISOLO, C.; SCHUBERT, A. 1998. Effects of water stress on vessel size and xylem hydraulic conductivity in Vitis vinifera L. Journal of Experimental Botany, v. 49, p. 693-700.
MARQUES FILHO, A. O. 1997. Regime de radiação solar e características da vegetação modelos de inversão. Acta Amazônica, v. 27, p. 119-134.
MARQUES FILHO, A. O.; DALLAROSA, R. C. 2000. Interceptação de radiação solar e distribução especial de área foliar em floresta de terra firme da Amazônia Central, Brasil. Acta Amazonica, v. 30, p. 453-470.
PHILLIPS, O. L. et al. 1998. Changes in the carbon balance of tropical forests: evidence from long-term plots. Science, v. 282, p. 439-442.
RADAMBRASIL. 1974. Levantamento de Recursos Naturais. Belém: Geologia, Geomorfologia, Solos, Vegetação e Uso Potencial da Terra; Rio de Janeiro: DNPM/MME. 480 p. v. 5. Folha SA23.
RADAMBRASIL. 1978. Levantamento de Recursos Naturais. Purus: Geologia, Geomorfologia, Solos, Vegetação e Uso Potencial da Terra; Rio de Janeiro: DNPM/MME. 561 p. v. 17. Folha SB20.
SCHULZE, E. D. et al. 1985. Canopy transpiration and water fluxes in the xylem of the trunk of Larix and Picea trees, a comparison of xylem flow porometer and cuvette measurements. Oecologia, v. 66, p. 475-483.
SOUZA, C. G. 1991. Solos. In: GEOGRAFIA do Brasil, Região Norte. Rio de Janeiro: IBGE. p. 123-136. v. 3.
SUDAM. 1981. Madeiras da Reserva Florestal de Curuá-Una Estado do Pará, Caracterização Anatômica, Propriedade Gerais e Aplicações. Belém: SUDAM. 118 p.
SUDAM/PHCA. 1984. Atlas Climatológico da Amazônia Brasileira. Belém: SUDAM. 125 p.
TANAKA, A. 1998. Ecofisiologia do estabelecimento de plântulas em plantios de enriquecimento em Novo Aripuanã. 113 f. Dissertação (Mestrado em Ciência de Florestas Tropicais) - Programa de Pós-Graduação em Biologia Tropical e Recursos Naturais do Convénio INPA/UA, Manaus, INPA.
TSUCHIYA, A.; HIRAOKA, M. 2002. Differences of primary and secondary terra firme forests along the Uaicurapa River near Parintins, AM according to the relationship between individual tree size and vessel area in stem cross section. Boletim do Museu Paraense Emílio Goeldi, série Bot., v. 17, p. 367-387.
TSUCHIYA, A. 2002. The relationship between stem vessel parameters and the development of strata in the early stages of secondary forest succession in Amazonia. Acta Amazonica, v. 32, p. 241-256.
TYREE, M. T.; EWERS, F. W. 1991. The hydraulic architecture of trees and other woody plants. New Phytologist, v. 119, p. 345-360.
UHL, C. P. 1988. Vegetation dynamics in Amazonian treefall gaps. Ecology, v. 69, p. 751-763.
UHL, C. P. et al. 1998. Uma abordagem integrada de pesquisa sobre o manejo dos recursos florestais na Amazonia brasileira. In: GASCON, C.; MOUTINHO, P. (Ed.). Floresta Amazônica: Dinâmica, Regeneração e Manejo. Manaus: INPA. p. 313-331.
VAN LEUWEEN, J. et al. 1997. Sistemas agroflorestais para a Amazônia: importância e pesquisas realizadas. In: NODA, H.; SOUZA, L. A. G.; MENEZES-FONESCA, O. J. (Ed.). Duas Décadas de Contribução do INPA a Pesquisa Agronômica no Trópico Úmido. Manaus: INPA. p. 131-146.
VIANA, V. M. 1989. Seeds and seedling availability as a basis for management of natural forest regeneration. In: ANDERSON, A. B. (Ed.). Alternatives to Deforestation, Steps towards Sustainable Use of the Amazon Rain Forest. New York: Columbia University Press. p. 99-111.
WHITMORE, T. C. et al. 1993. Use of hemispherical photographs in forest ecology: measurement of gap size and radiation totals in a Bornean tropical rain forest. Journal of Tropical Ecology, v. 9, p. 131-151.
WORBES, M. 1997. The forest ecosystem of the floodplains. In: JUNK, W. J. (Ed.). The Central Amazon Floodplain. Berlin: Springer. p. 223-265. (Ecological Studies, 126).
ZIMMERMANN, M. H. 1983. The hydraulic architecture of plants. In: XYLEM structure and the ascent of sap. Berlin: Springer. p. 68-76.
 Endereço para correspondência:
Editora do Museu Paraense Emílio Goeldi
Av. Magalhães Barata, 376
São Braz – CEP 66040-170
Caixa Postal 399
Telefone/fax: 55-91-3219-3317
E-mail: boletim@museu-goeldi.br
Recebido: 02/02/2004
Aprovado: 11/04/2005


