


 English (pdf)
 Article in xml format
 Article references
 Curriculum ScienTI
 Send this article by e-mail
 Cited by SciELO
  Similars in
SciELO
Similars in
SciELO 
 Permalink
INTRODUCTION
Exploratory or descriptive data analysis involves gathering, characterising and presenting a set of data to properly describe the characteristics of this set1. There are many descriptive tools in statistics, such as plots, tables and synthesis measurements (percentages, indexes, averages, medians, etc.)2.
Time series is the class of phenomena in which data are distributed in an ordered sequence of observations, i.e., the set of observations is obtained sequentially with time. If the parameter t represents time, the series itself can be a function of some other physical parameter, such as space or volume. The series can be observed as a r x 1 vector, where t is a p x 1 vector. These series serve the following purposes: (1) to identify the behaviour of the series, as confirming the existence of tendencies, cycles and seasonal variations, outliers, etc.; (2) to use the variations in one series to explain those observed in another series; and (3) to make predictions of future values of the time series based on a mathematical model that describes the behaviour observed3.
Control charts are very useful to determine if the variations observed in a process are due to common causes, deemed to have little importance, or to special causes, which must be identified and eliminated from the process4. Thus, the control plot is a graphical representation of the process with time. The control plot consists of a central line (CL), that represents the distribution level, and two other lines that represent the upper and lower control limits (UCL and LCL)5 (Figure 1). These control limits are used to assess whether the process is under statistical control, which is true if the sampled data points lie between the two limits. However, if a data point lies outside the control limits, or when there are a sequence of points (seven or more consecutive data points), then the process is out of statistical control, which requires investigation into the attributable causes for this behaviour6.
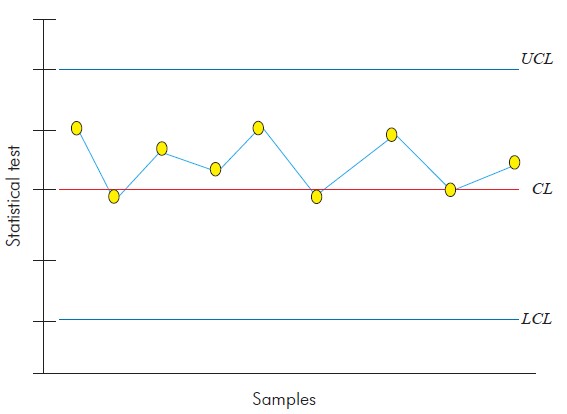
Control charts are based on certain premises, including a sampling statistic w, which continuously measures the variability of a quality trait, providing the mean and standard deviation. These statistical values correspond to the points in the control chart, and each point is obtained from one of the samples gathered from the process in well-defined time frames. Formally, the general model of control charts is defined as follows:
where k is the distance between the central line and each of the control limits, given as a function of the standard deviation7.
Certain assumptions must be made before creating a control chart, such as independence and normality of the data. If these assumptions are true, the charts are applicable, and conclusions about a given process can be drawn. Therefore, it is essential for the variability control of a process that the quality trait be not only normally distributed but also independently and identically distributed, which implies that the variables are not autocorrelated8.
Norovirus (NoV) is belonging to the Caliciviridae family, which includes four other genera: Sapovirus (SaV), Lagovirus, Vesivirus and Nebovirus. Along with SaV, NoV is called human caliciviruses, and NoV is the most prevalent genera in the world. This virus is morphologically characterised as non-enveloped viruses, measuring between 27 and 40 nm in diameter, with a non-smooth external surface and non-pronounced spikes. The viral capsid has icosahedral symmetry, consisting of one single structural protein that forms 32 depressions in the shape of chalices9.
Among all viral enteropathogens, NoV is the most important when considering outbreaks in human populations. This virus is the second major cause of severe viral acute gastroenteritis (AGE) in young children in the world, is responsible for 20% of family outbreaks and is the main cause of diarrhoea in travellers. This virus is particularly infectious in children and elderly people but they can infect individuals from all age groups. In addition to causing severe infections, NoV causes large economic losses, with annual supply and human resources expenditures of approximately US$ 650,000, not including hospitalisation costs, according to a study conducted in the USA10.
This virus is responsible for approximately 90% of all non-bacterial diarrhoea outbreaks and for 12% of AGE, which cause approximately 200,000 deaths of children under 5 years old, especially in developing countries. In the United States, studies conducted starting in 1972 estimate that 94% of the non-bacterial outbreaks and 38.6 million (80%) of the annual cases of AGE can be attributed to these agents11.
In Brazil, studies involving the epidemiological and molecular aspects of those viruses have already been conducted. The prevalence of NoV has been investigated in a longitudinal study conducted in urban shanty towns in Fortaleza, Ceará State, between 1990 and 1991, involving 120 children, with a positivity of 12.5%. This pathogen was also detected in 15% of the children hospitalised in Recife, Pernambuco State, between 2004 and 200512.
In 1996, the first outbreak caused by these viruses in Brazil occurred in Baixada Santista, São Paulo State13, and many outbreaks in the capital city of the same State were recorded in 1995 and from 2004 to 2006 with a positivity of 15.7%14.
NoV has also been associated with several AGE outbreaks in Rio de Janeiro, both in the capital of that State (37.6%) and other municipalities (66%)15,16, and has been observed in 14.5% of all clinical samples acquired from children who were hospitalised or received outpatient treatment in Rio de Janeiro. In the central-western region of the country, 8.6% positivity was observed among hospitalised children17, whereas in Espírito Santo State, the figure was 39.7%18.
In Pará State, tests conducted on faecal samples acquired from children admitted to a public hospital in the Capital Belém between 1992 and 1994 identified NoV in 15% of the samples19. According to other studies performed from 1998 to 2000, 2003 and from 2008 to 2010 the positivity rates for hospitalised children in the same city varied between 7.1% and 36.5%20,21,22.
The high infectiousness of this pathogen suggests a large variety of transmission routes. The main route is the faecal-oral one (person-to-person contact, fomites, vomit aerosolisation and consumption of contaminated food and water). The ease with which these viruses are transmitted and the low infecting dosage required to establish an infection result in the already mentioned extensive outbreaks, particularly in contained environments such as hospitals, hotels, schools, cruise ships, prisons, child care centres, restaurants and nursing homes. The main clinical manifestations characterising the infection are diarrhoea, vomit, nausea and abdominal pain lasting for approximately 48 h23,24.
Thus, the present study aimed to apply control charts of time series to the analysis of the seasonality observed in the NoV detected in children suffering from AGE in a paediatric hospital in Belém City, Pará State, Amazon region, Brazil, over a period of three years of monitoring.
MATERIALS AND METHODS
SAMPLE COLLECTION
Active surveillance was performed in a paediatric hospital for three years (May 2008 to April 2011). Children admitted with the symptoms of AGE, characterised by three or more episodes of liquid or loose diarrhoea in a period of 24 h, were observed. All sick children were initially tested for a rotavirus infection, and only those that tested negative were included in the present study. The selection of which children would be tested for a NoV infection was performed monthly in a random manner, using a ballot to minimise selection biases, and included approximately 20% of the children in the hospital.
A total of 10.030 cases of hospitalizations was registered during the three years of follow-up, with 2.276 faecal samples collected and included in this study, of which 483 were selected to be tested for the presence of NoV, adopting a confidence level of 95% and a sampling error of 4%.
The use of the samples obtained in this clinic was authorised by the Committee for Ethics in Research in Humans of the Instituto Evandro Chagas, under register CAAE: 0024.0.072.000-10 dated October 15th 2010.
LABORATORY PROCEDURES
Faecal suspensions were prepared either in an elution buffer of enzymatic assay or in Tris/HCl/Ca++ 0.01 M pH 7.2 at a concentration of 10% weight/volume.
All the samples were examined for the presence of NoV antigens using the commercial 3rd generation immunoenzymatic assay (IEA) Ridascreen® Norovirus (R-Biopharm, Darmstadt, Germany), according to the manufacturer's instructions. This IEA is based on monoclonal antibodies observed attached on the surface of the wells of the microplate, which capture antigens specific to NoV (GI and GII) observed in faecal samples. Regardless of the results, all the samples were also tested using molecular biology techniques.
Total nucleic acid extraction was performed using the silica method (Guanidine isothiocyanate)25. Complementary DNA (cDNA) was acquired using reverse transcription reaction with a random primer (pd [N] 6-50A 260 units - Amersham Biosciences, Piscataway, NJ) and reverse transcriptase enzyme (Superscript TM II RNAse H Reverse, Invitrogen, Eugene, Oregon, USA).
The genetic material was amplified via a polymerase chain reaction (PCR) using two primers, Mon 432/434 and Mon 431/433, which in the viral genome code is the 3' end of the B region of ORF 1 (RNA-dependent polymerase). These primers are specific to detect the GI and GII genogroups of NoV, forming a nucleotide fragment with 213 bp26.
Positive and negative controls were included at all the stages of these procedures, from the extraction of viral RNA to the PCR, to control and guarantee the quality of the results.
CONSTRUCTION OF THE CONTROL CHART OF THE TIME SERIES
The construction of this chart considers how well it detects points that are out of statistical control, if any such points exist. Monitoring the original values facilitates understanding and analysis of the data27, i.e., the central line allows seasonality traits of the series to be considered and the monitoring to be more effective. Thus, the limits of the control chart and the central line were given by the following:
where k is the distance from the central line to each of the control limits, given as a function of the standard deviation, ŷ is the t-th estimate obtained from the time series model (in this case k = 3 was used), and MAD is the mean absolute error computed as follows:
SOFTWARE
The statistical analyses were conducted using Gretl 1.9.5, Minitab 14 and BioEstat 5.028 computer programmes. The charts in this article were produced using Microsoft Office Excel 2007.
RESULTS
NoV-positivity of 35.4% (171/483) was detected in the period of surveillance, not being observed any cases of obit due to AGE. Three positivity peaks (cut-off 60%) were observed between May 2008 and April 2011, in September and October 2008 (63.6%) and February 2010 (62.1%) (Figure 2).
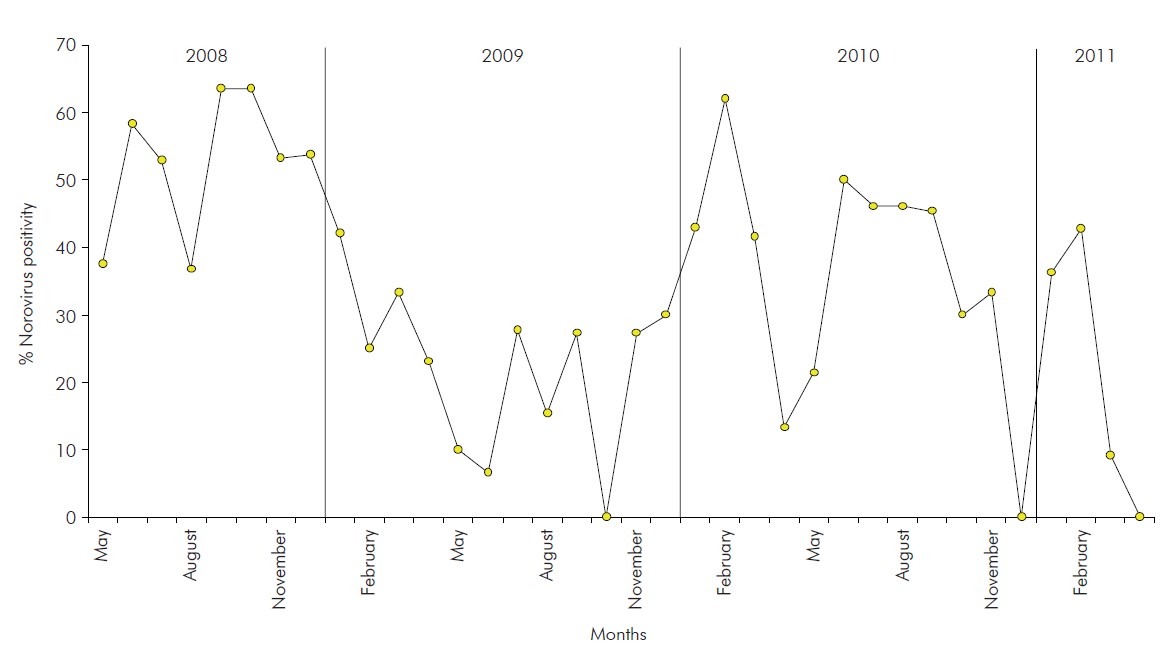
Figure 2 - Monthly distribution of positive norovirus cases detected in children hospitalised due to gastroenteritis during the three years of observation (May 2008 to April 2011) in a paediatric hospital in Belém, Pará, Brazil
To apply the models proposed in this study, it was necessary to make the series stationary, which was accomplished by applying the first difference of monthly NoV positivity rates. One single application sufficed to make the series stationary (Figure 3).
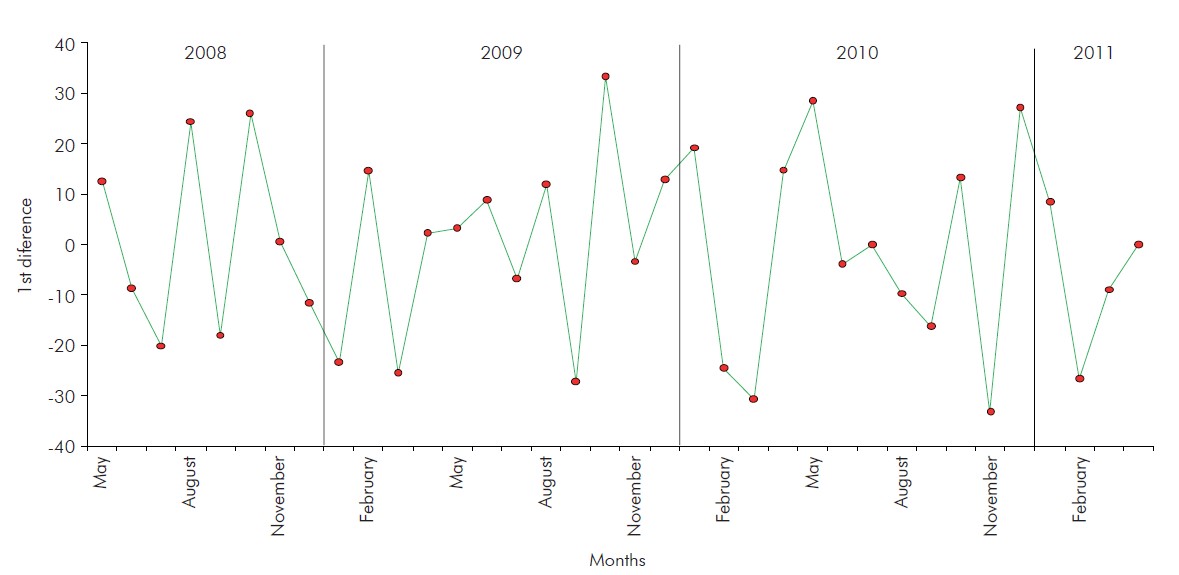
Figure 3 - First difference in monthly norovirus positivity rates detected in children hospitalised due to gastroenteritis during the three years of observation (May 2008 to April 2011) in a paediatric hospital in Belém, Pará, Brazil
Two models, MA(1) and AR(4), were assessed for series monitoring and predictions. Table 1 presents the MAD and the Akaike criterion for the monthly NoV positivity rate series, as observed in children hospitalised with AGE during the period of study. The MA(1) time series model was used, which was fitted to this data series as follows:
Table 1 - MAD and Akaike criterion for the series and monthly norovirus positivity rates observed in children hospitalised due to gastroenteritis during the three years of observation (May 2008 to April 2011) in a paediatric hospital in Belém, Brazil
| Model | MAD | Akaike criterion |
|---|---|---|
| MA(1) | 13.876 | 302.567 |
| AR(4) | 15.224 | 306.307 |
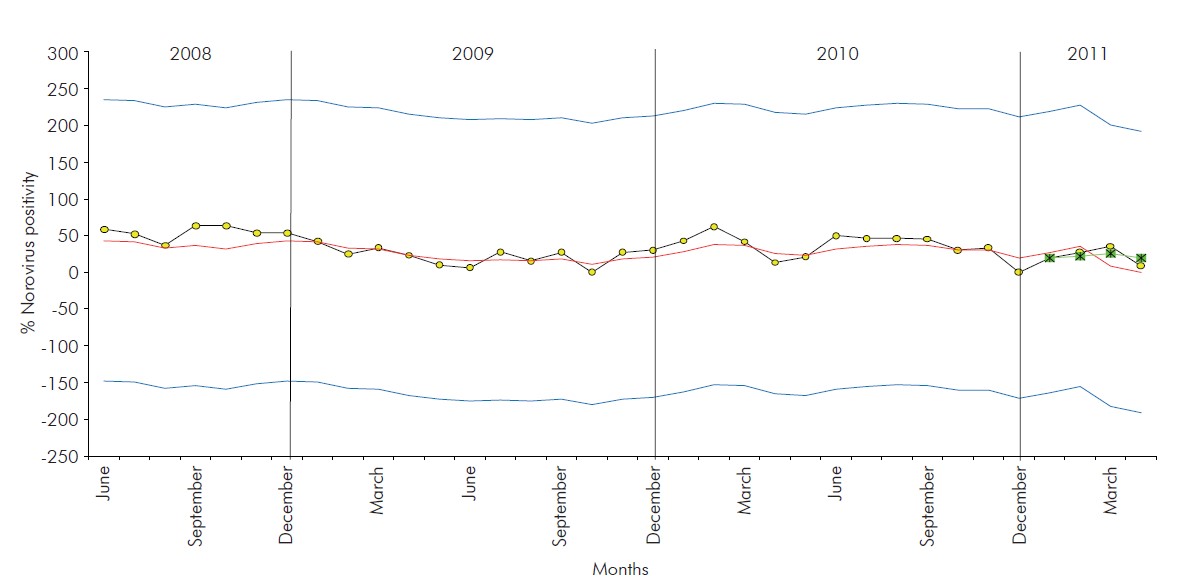
Control charts of time series were used to monitor the monthly positivity percentages as functions of time during the three years of observation. To construct these charts, it was crucial to verify whether the data were normally distributed, that was determined using the Kolmogorov-Smirnov normality test, in which the following hypotheses were tested: H0: the data are normally distributed; H1: the data are not normally distributed. The test results indicated that the data were normally distributed, yielding a p-value of 0.941 at a 5% significance level.
To monitor the series, the establishment of upper and lower control limits was also necessary; these limits were given by the following equations:
Thus, the time series control chart was constructed for the data from the monthly NoV positive case distribution as detected in the period of observation of this study (Figure 4).
DISCUSSION
Seasonality studies indicate an increase in NoV infection rates in winter months in countries of temperate climate29. This behaviour was also observed in a study conducted over a period of eight years (1998-2007) in the Southeastern Region of Brazil. However, in tropical regions such as the North of Brazil, infections caused by these pathogens are observed all year long, with some months of greater occurrence, but without establishing a seasonality pattern30.
NoV also circulate in the central region of the country (subtropical climate), with their prevalence peaking from September to March, which corresponds to the rainy season and higher humidity17. However, another study conducted in Rio de Janeiro observed a two-phase prevalence profile with peaks in the periods of March to May and of September to October of 200431. This latter peak is similar to the one observed in the present study. In fact, similar to these other regions, Belém did not display a seasonal NoV infection pattern.
These data indicate that further study is necessary to better clarify which factors affect the viral infection rates and whether climate or population behavioural factors are involved, especially considering that Brazil has continental dimensions and that the Amazon Region, the location where the study was conducted, is likely to significantly differ from other regions of the country and the entire world in epidemiological terms. Despite this, the idea of applying mathematical modelling to the results seems to be very beneficial to confirm, statistically, the findings. Furthermore, these analyses can be valuable to understand more complex interrelationships between numerous variables and shock factors.
Studies in which mathematical modelling is used are being conducted in the fields of biological and medical sciences to guide actions in public health32, assess infection control measures33 and examine therapeutic treatments34. In the context of time series, there are several criteria to select mathematical models for monitoring and predictive series, with the most commonly used being the Akaike information criterion (AIC), for which a lower value for AIC implies a better adjusted model35. Note that the value of MAD was lower for the MA(1) model than for the AR(4) model, and thus, the former has a lower AIC value, suggesting that MA(1) is a better model for estimating the series.
The time series control chart demonstrated that the series studied is under statistical control, with a tendency for stability, no evidence of seasonality (an indication of a fluctuation pattern with a yearly period) nor of cycle (an indication of patterns in the series that repeat at intervals larger than a year). No outlying values were observed during the three years, which strongly suggests that no atypical factor that could affect the stability of the series or biases in the monthly sample collection were present. Although, it has already been proven that exist other statistical methods it can be applied to assess the seasonality of pathogens, none is so accurate and allows many analyzes as the presented tool to this study.
CONCLUSION
The goal of this study was to model and monitor the monthly NoV positivity rates observed over a period of three years in children hospitalised due to AGE.
The NoV detected in these hospitalised children during this three-year period in Belém did not display any well-defined seasonality, in contrast with what is usually observed in countries in the Northern Hemisphere, which could be attributed to climate factors or behaviour traits of the population under study.
The mathematical model for time series analysis also suggests that the selection and sample collection were performed well, without the occurrence of outbreaks of the disease caused by NoV in the paediatric population under study. However, it should be noted that this type of seasonality assessment was conducted under an essentially non-representative premise about the true distribution of NoV infections because only children who tested negative for rotavirus were included in the study. This practice could potentially represent a significant bias but does not invalidate the present study.
Finally, this study demonstrated the applicability of time series control charts in the biomedical sciences as a useful tool for the seasonality analysis of several pathogens and is the first study to apply this kind of statistical analysis having norovirus as object of study.
ACKNOWLEDGEMENTS
The authors would like to thank the Statistical and Computational Study and Research Group (GEPEC) and the Information and Georeferencing Systems Laboratory (LASIG) at the Universidade Federal do Pará for their continuous teaching. The authors would also like to thank the Norovirus and others Enteric Virus Laboratory of the Instituto Evandro Chagas for all the technical and logistic support, particularly regarding the laboratory processing of the samples. Special thanks are due to those responsible for the children hospitalised in the Pará Paediatric Clinic, informally known as Clínica Serzedelo Corrêa, who accepted to participate in this study as volunteers and permitted the analysis of the relevant biological material. The authors are also thankful to the entire team of the Effectiveness Project, which conducted the on-site sample and data collection.

